. 2022 Feb:141:105061.
doi: 10.1016/j.compbiomed.2021.105061. Epub 2021 Nov 26.

Determining anatomical and electrophysiological detail requirements for computational ventricular models of porcine myocardial infarction

Affiliations

Determining anatomical and electrophysiological detail requirements for computational ventricular models of porcine myocardial infarction

Caroline Mendonca Costa et al. Comput Biol Med. 2022 Feb.

Abstract

Background: Computational models of the heart built from cardiac MRI and electrophysiology (EP) data have shown promise for predicting the risk of and ablation targets for myocardial infarction (MI) related ventricular tachycardia (VT), as well as to predict paced activation sequences in heart failure patients. However, most recent studies have relied on low resolution imaging data and little or no EP personalisation, which may affect the accuracy of model-based predictions.

Objective: To investigate the impact of model anatomy, MI scar morphology, and EP personalisation strategies on paced activation sequences and VT inducibility to determine the level of detail required to make accurate model-based predictions.

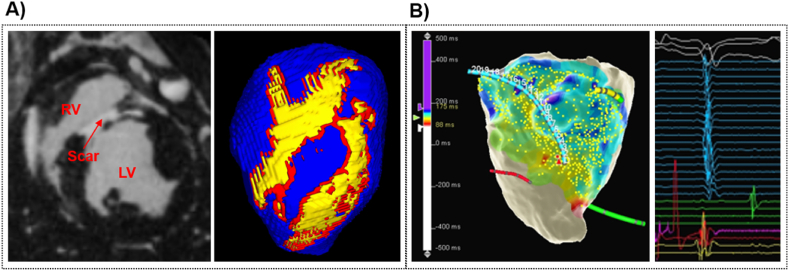
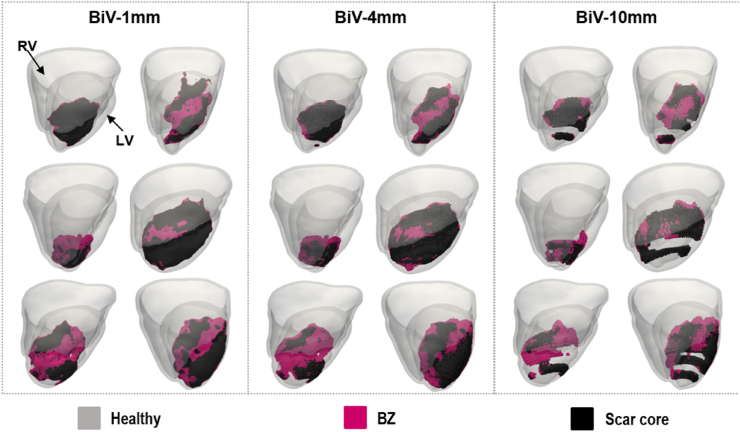
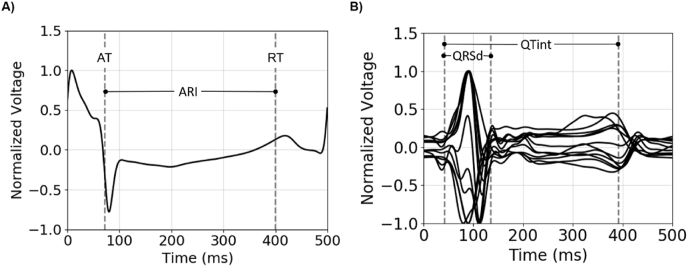
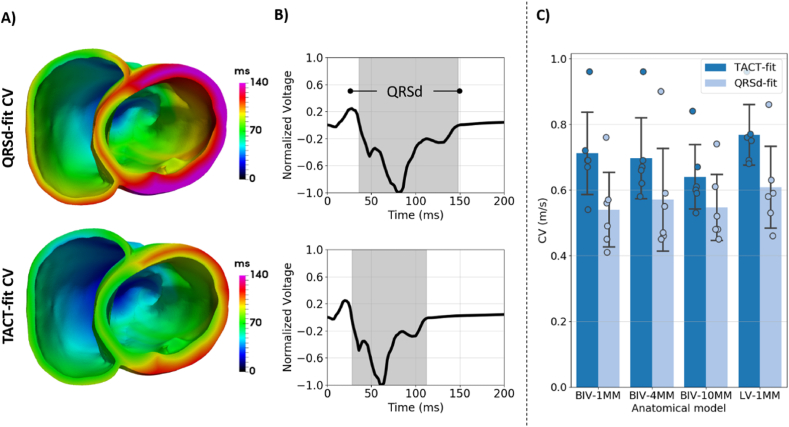
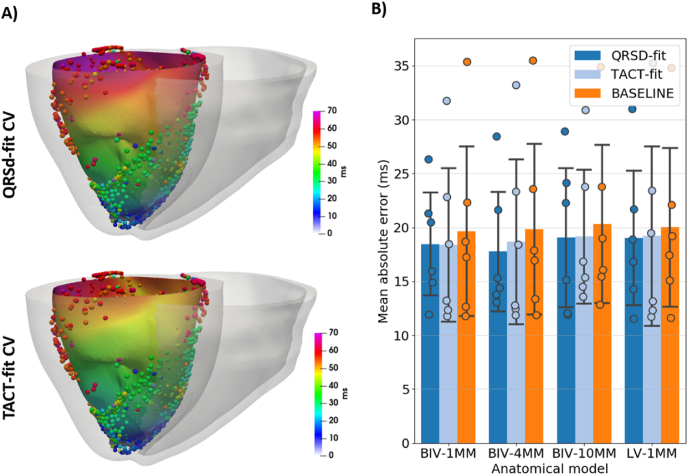
Methods: Imaging and EP data were acquired from a cohort of six pigs with experimentally induced MI. Computational models of ventricular anatomy, incorporating MI scar, were constructed including bi-ventricular or left ventricular (LV) only anatomy, and MI scar morphology with varying detail. Tissue conductivities and action potential duration (APD) were fitted to 12-lead ECG data using the QRS duration and the QT interval, respectively, in addition to corresponding literature parameters. Paced activation sequences and VT induction were simulated. Simulated paced activation and VT inducibility were compared between models and against experimental data.

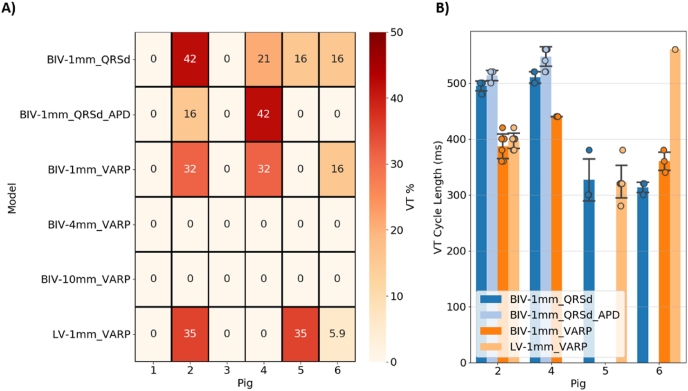
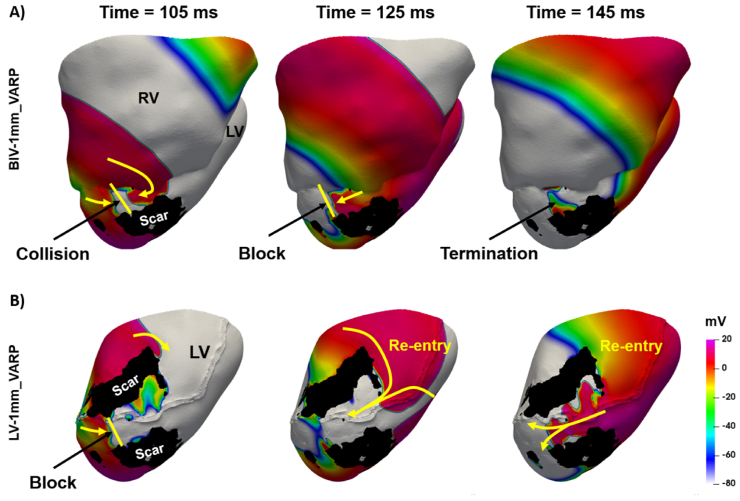
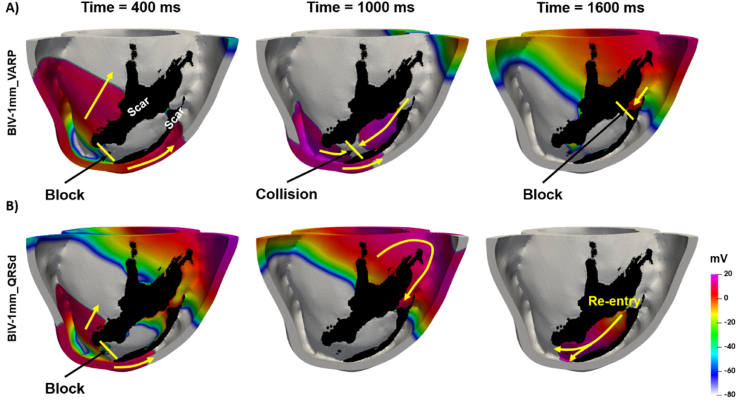
Results: Simulations predict that the level of model anatomical detail has little effect on simulated paced activation, with all model predictions comparing closely with invasive EP measurements. However, detailed scar morphology from high-resolution images, bi-ventricular anatomy, and personalized tissue conductivities are required to predict experimental VT outcome.

Conclusion: This study provides clear guidance for model generation based on clinical data. While a representing high level of anatomical and scar detail will require high-resolution image acquisition, EP personalisation based on 12-lead ECG can be readily incorporated into modelling pipelines, as such data is widely available.

Keywords: Cardiac electrophysiology; Myocardial infarction; Patient-specific models; Ventricular tachycardia.


Conflict of interest statement

The authors declare that they have no known competing financial interests or personal relationships that could have appeared to influence the work reported in this paper.

Figures

Fig. 1
Fig. 1
Experimental data. A) Example of LGE-MRI, showing the LV, RV, and the scar, with the corresponing LV (blue) segmentation, including scar (yellow) and border zone (red). B) Example of EP data acquired in-vivo using Precision™. Showing LAT map on the LV cavity computed by Precision™, and examples of acquired intra-cardiac EGMs (right).
Fig. 2
Fig. 2
BIV anatomical models (viewed from the RV lateral wall) showing the RV and LV anatomies in grey, the scar core in black and BZ in pink. Models are shown for the six pigs and the three scar resolutions (1, 4, and 10 mm).
Fig. 3
Fig. 3
EP data properties. A) Example of EGM trace and computed AT, RT, and ARI. B) Example of 12-lead ECG and computed QRSd and QTint.
Fig. 4
Fig. 4
CV fitted to the TACT (TACT-fit CV) and the QRSd on 12-lead ECG (QRSd-fit CV). A) Examples of activation sequences with TACT-fit CV and QRSd-fit CV. B) Corresponding trace of lead V1 of the 12-lead ECG and the computed QRSd. C) CVs obtained using both parameterization methods, with bars and error bars corresponding to mean and standard deviation of CV values across all pigs, respectively, and filled circles indicating each the CV of each pig.
Fig. 5
Fig. 5
Comparison between experimental activation sequences and the baseline (constituting no modelling personalisation) and fitted sequences. A) Examples of simulated activation sequences on the endocardial surface for QRSd-fit and TACT-fit CVs. The overlapping spheres represent the measured LAT. B) Mean absolute error between experimental and simulated paced activation. Bars and error bars represent the mean and standard deviation over all pigs, whereas the mean error for each pig is shown as filled circles. Results are shown for the baseline CV (0.67 m/s), QRSd-fit CV, and TACT-fit CV.
Fig. 6
Fig. 6
VT induction simulations: A) Heatmap of the percentage of VTs induced relative to the number of stimulus sites (19 for BIV, 17 for LV) for each model. B) Cycle lengths of the induced VTs for each model and pig, showing the computed cycle length for each pig as filled circles and mean and standard deviation over all pigs. “QRSd” and “VARP” correspond to QRSd-fit and VARP conductivities, respectively, and “APD” corresponds to the APD-fit action potential model.
Fig. 7
Fig. 7
Example of ventricular tachycardia induction using a BIV-1MM (A) and a LV-1MM (B) model. The colors represent the transmembrane voltage. The yellow arrows indicate the direction of wavefront progragation and the yellow lines indicate propagation block. The scar is shown in black. The times are counted from the time of delivery the S2 stimulus.
Fig. 8
Fig. 8
Example of ventricular tachycardia simulation using the A) VARP and B) QRSd-fit conductitivies. The colors represent the transmembrane voltage. The yellow arrows indicate the direction of wavefront progragation and the yellow lines indicate propagation block. The scar is shown in black. The times are counted from the time of delivery the S2 stimulus.

References

    1. Niederer S.A., Lumens J., Trayanova N.A. Computational models in cardiology. Nat. Rev. Cardiol. 2019;16(2):100–111. doi: 10.1038/s41569-018-0104-y. - DOI - PMC - PubMed
    1. Arevalo H.J., et al. Arrhythmia risk stratification of patients after myocardial infarction using personalized heart models. Nat. Commun. 2016;7 doi: 10.1038/ncomms11437. - DOI - PMC - PubMed
    1. Lee A.W.C., et al. A rule-based method for predicting the electrical activation of the heart with cardiac resynchronization therapy from non-invasive clinical data. Med. Image Anal. Oct. 2019;57:197–213. doi: 10.1016/j.media.2019.06.017. - DOI - PMC - PubMed
    1. Strocchi M., et al. His-bundle and left bundle pacing with optimized atrioventricular delay achieve superior electrical synchrony over endocardial and epicardial pacing in left bundle branch block patients. Heart Rhythm. 2020;17(11):1922–1929. doi: 10.1016/j.hrthm.2020.06.028. - DOI - PubMed
    1. Mendonca Costa C., et al. Pacing in proximity to scar during cardiac resynchronization therapy increases local dispersion of repolarization and susceptibility to ventricular arrhythmogenesis. Heart Rhythm. 2019;16(10):1475–1483. doi: 10.1016/j.hrthm.2019.03.027. - DOI - PMC - PubMed

Publication types