

Clinical application of free/total PSA ratio in the diagnosis of prostate cancer in men over 50 years of age with total PSA levels of 2.0-25.0 ng ml-1 in Western China
- PMID: 34916475
- PMCID: PMC8887115
- DOI: 10.4103/aja202182
Clinical application of free/total PSA ratio in the diagnosis of prostate cancer in men over 50 years of age with total PSA levels of 2.0-25.0 ng ml-1 in Western China
Abstract
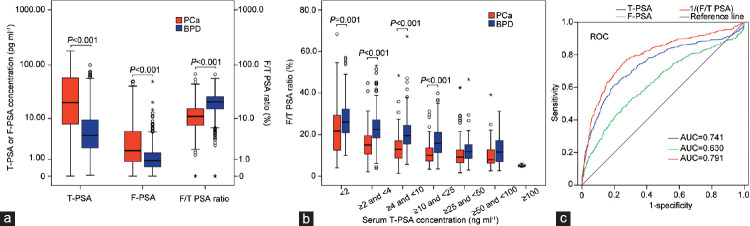
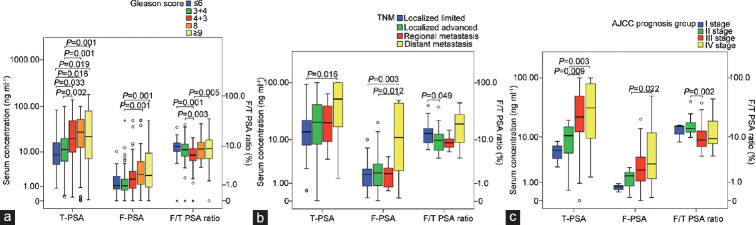
The goal of this study was to investigate the clinical application of free/total prostate-specific antigen (F/T PSA) ratio, considering the new broad serum total PSA (T-PSA) "gray zone" of 2.0-25.0 ng ml-1 in differential diagnosis of prostate cancer (PCa) and benign prostate diseases (BPD) in men over 50 years in Western China. A total of 1655 patients were included, 528 with PCa and 1127 with BPD. Serum T-PSA, free PSA (F-PSA), and F/T PSA ratio were analyzed. Receiver operating characteristic curves were used to assess the efficiency of PSA and F/T PSA ratio. There were 47.4% of cancer patients with T-PSA of 2.0-25.0 ng ml-1. When T-PSA was 2.0-4.0 ng ml-1, 4.0-10.0 ng ml-1, and 10.0-25.0 ng ml-1, the area under the curve (AUC) of F/T PSA ratio was 0.749, 0.769, and 0.761, respectively. The best AUC of F/T PSA ratio was 0.811 when T-PSA was 2.0-25.0 ng ml-1, with a specificity of 0.732, a sensitivity of 0.788, and an optimal cutoff value of 15.5%. The AUC of F/T PSA ratio in different age groups (50-59 years, 60-69 years, 70-79 years, and ≥80 years) was 0.767, 0.806, 0.815, and 0.833, respectively, and the best sensitivity (0.857) and specificity (0.802) were observed in patients over 80 years. The T-PSA trend was in accordance with the Gleason score, tumor node metastasis (TNM) stage, and American Joint Committee on Cancer prognosis group. Therefore, the F/T PSA ratio can facilitate the differential diagnosis of PCa and BPD in the broad T-PSA "gray zone". Serum T-PSA can be a Gleason score and prognostic indicator.
Keywords: free/total prostate-specific antigen ratio; gray zone prostate-specific antigen; prostate cancer; total prostate-specific antigen.
Conflict of interest statement
None
Figures


Similar articles
-
Measurement of serum zinc improves prostate cancer detection efficiency in patients with PSA levels between 4 ng/mL and 10 ng/mL.Asian J Androl. 2005 Sep;7(3):323-8. doi: 10.1111/j.1745-7262.2005.00044.x. Asian J Androl. 2005. PMID: 16110361
-
The cutoff level of free/total prostate specific antigen (f/t PSA) ratios in the diagnosis of prostate cancer: a validation study on a Turkish patient population in different age categories.Kaohsiung J Med Sci. 2014 Nov;30(11):545-50. doi: 10.1016/j.kjms.2014.03.008. Epub 2014 Apr 20. Kaohsiung J Med Sci. 2014. PMID: 25458043 Free PMC article.
-
Complexed prostate-specific antigen, complexed prostate-specific antigen density of total and transition zone, complexed/total prostate-specific antigen ratio, free-to-total prostate-specific antigen ratio, density of total and transition zone prostate-specific antigen: results of the prospective multicenter European trial.Urology. 2002 Oct;60(4 Suppl 1):4-9. doi: 10.1016/s0090-4295(02)01896-4. Urology. 2002. PMID: 12384156
-
In prostatism patients the ratio of human glandular kallikrein to free PSA improves the discrimination between prostate cancer and benign hyperplasia within the diagnostic "gray zone" of total PSA 4 to 10 ng/mL.Urology. 1998 Sep;52(3):360-5. doi: 10.1016/s0090-4295(98)00245-3. Urology. 1998. PMID: 9730444
-
Diagnostic accuracy of prostate-specific antigen below 4 ng/mL as a cutoff for diagnosing prostate cancer in a hospital setting: A systematic review and meta-analysis.Investig Clin Urol. 2022 May;63(3):251-261. doi: 10.4111/icu.20210429. Investig Clin Urol. 2022. PMID: 35534215 Free PMC article.
Cited by
-
Solid Lipid Nanoparticles Based on Babassu Oil and Copaiba Oleoresin: A Promising Approach for Prostate Cancer Therapy.Nanomaterials (Basel). 2024 Jun 12;14(12):1014. doi: 10.3390/nano14121014. Nanomaterials (Basel). 2024. PMID: 38921890 Free PMC article.
-
Association of Vitamin D and Prostate Health Status in Men: An Analytical Cross-Sectional Study.Cureus. 2024 Dec 2;16(12):e74959. doi: 10.7759/cureus.74959. eCollection 2024 Dec. Cureus. 2024. PMID: 39744261 Free PMC article.
-
Development and validation of risk-stratified biopsy decision pathways incorporating MRI and PSA-derived indicators.Ann Med. 2025 Dec;57(1):2446695. doi: 10.1080/07853890.2024.2446695. Epub 2025 Jan 1. Ann Med. 2025. PMID: 39742889 Free PMC article.
-
Diagnostic performance of apparent diffusion coefficient values in differentiating benign from malignant lesions in prostate PI-RADS v2.1 category 1 "nodules in nodule".Abdom Radiol (NY). 2025 Apr 28. doi: 10.1007/s00261-025-04930-y. Online ahead of print. Abdom Radiol (NY). 2025. PMID: 40293519
References
-
- Bray F, Ferlay J, Soerjomataram I, Siegel RL, Torre LA, et al. Global cancer statistics 2018: GLOBOCAN estimates of incidence and mortality worldwide for 36 cancers in 185 countries. CA Cancer J Clin. 2018;68:394–424. - PubMed
-
- Gu XY, Zheng RS, Zhang SW, Zeng HM, Sun KX, et al. [Analysis on the trend of prostate cancer incidence and age change in cancer registration areas of China, 2000 to 2014] Zhonghua Yu Fang Yi Xue Za Zhi. 2018;52:586–92. [Article in Chinese] - PubMed
-
- Catalona WJ, Smith DS, Ornstein DK. Prostate cancer detection in men with serum PSA concentrations of 2.6 to 4.0 ng/mL and benign prostate examination. Enhancement of specificity with free PSA measurements. JAMA. 1997;277:1452–5. - PubMed
-
- Bruzzese D, Mazzarella C, Ferro M, Perdonà S, Chiodini P, et al. Prostate health index vs percent free prostate-specific antigen for prostate cancer detection in men with “gray” prostate-specific antigen levels at first biopsy: systematic review and meta-analysis. Transl Res. 2014;164:444–51. - PubMed
MeSH terms
Substances
LinkOut - more resources
Full Text Sources
Medical
Research Materials
Miscellaneous
