. 2021 Dec 16;12(1):7314.
doi: 10.1038/s41467-021-27530-y.

R-loop proximity proteomics identifies a role of DDX41 in transcription-associated genomic instability

Affiliations

R-loop proximity proteomics identifies a role of DDX41 in transcription-associated genomic instability

Thorsten Mosler et al. Nat Commun. .

Abstract

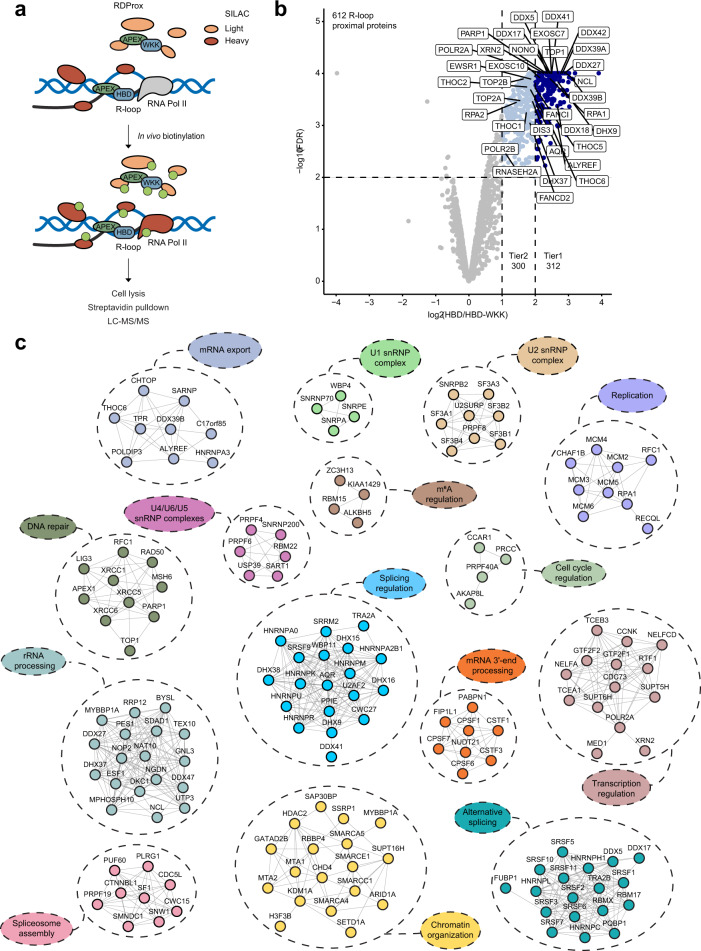
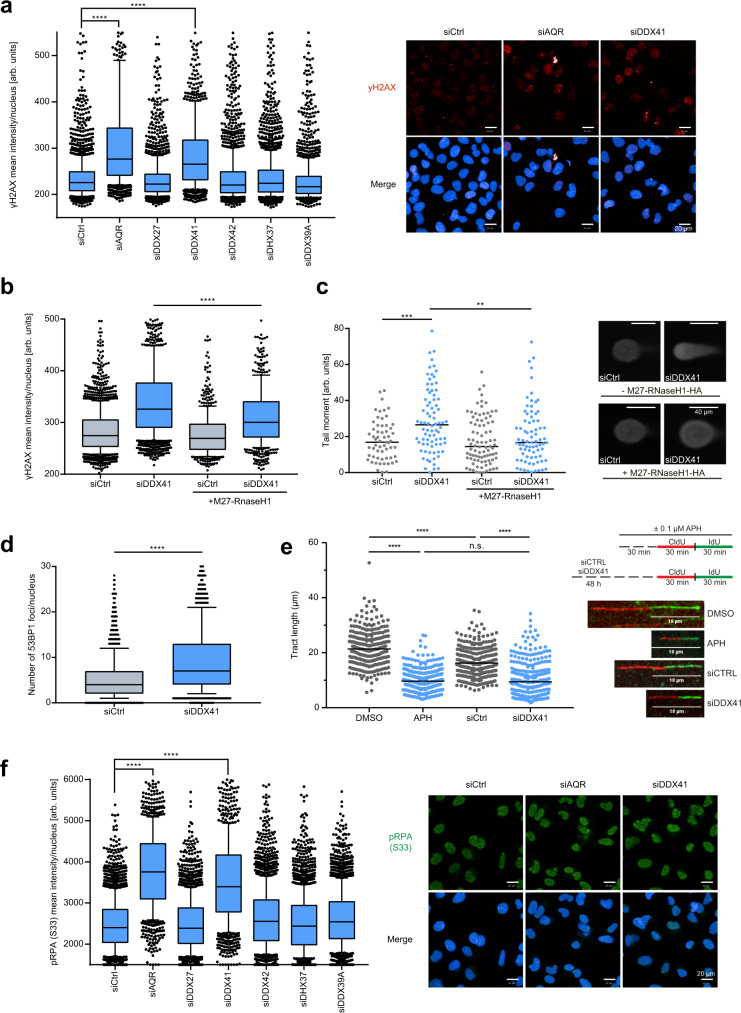
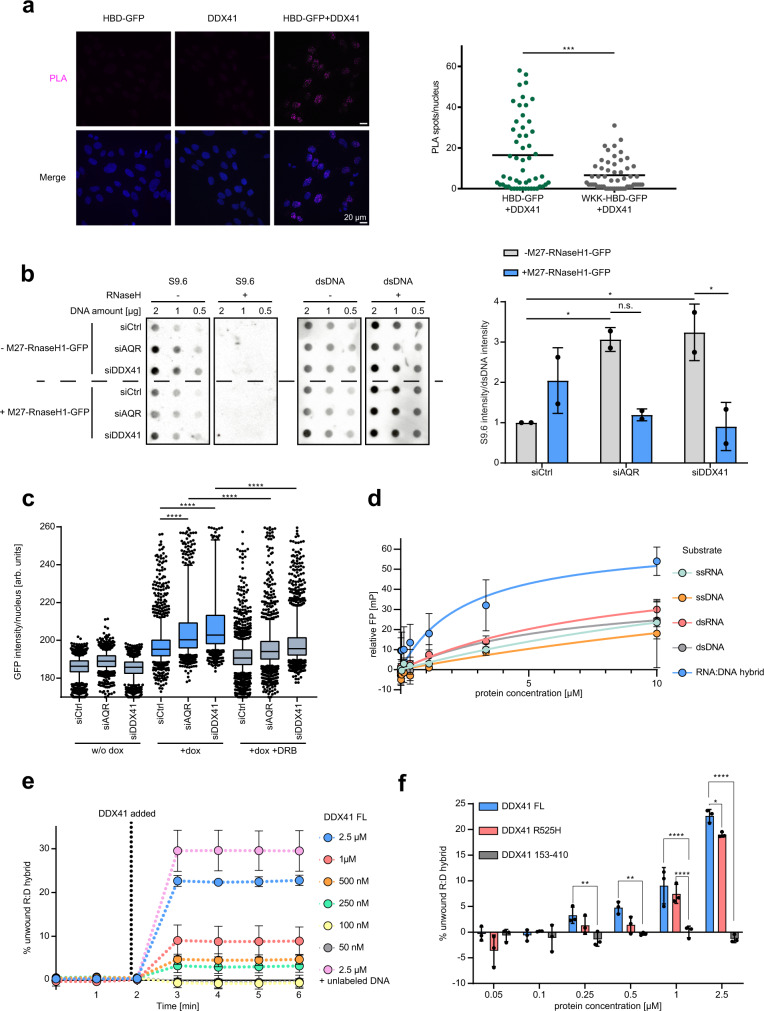
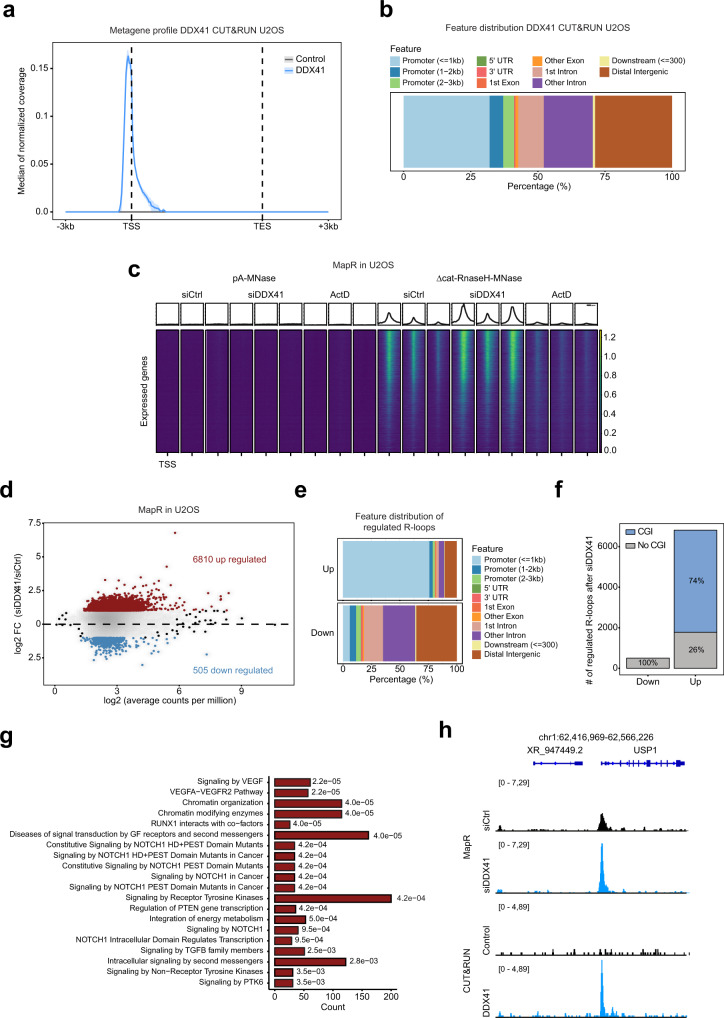
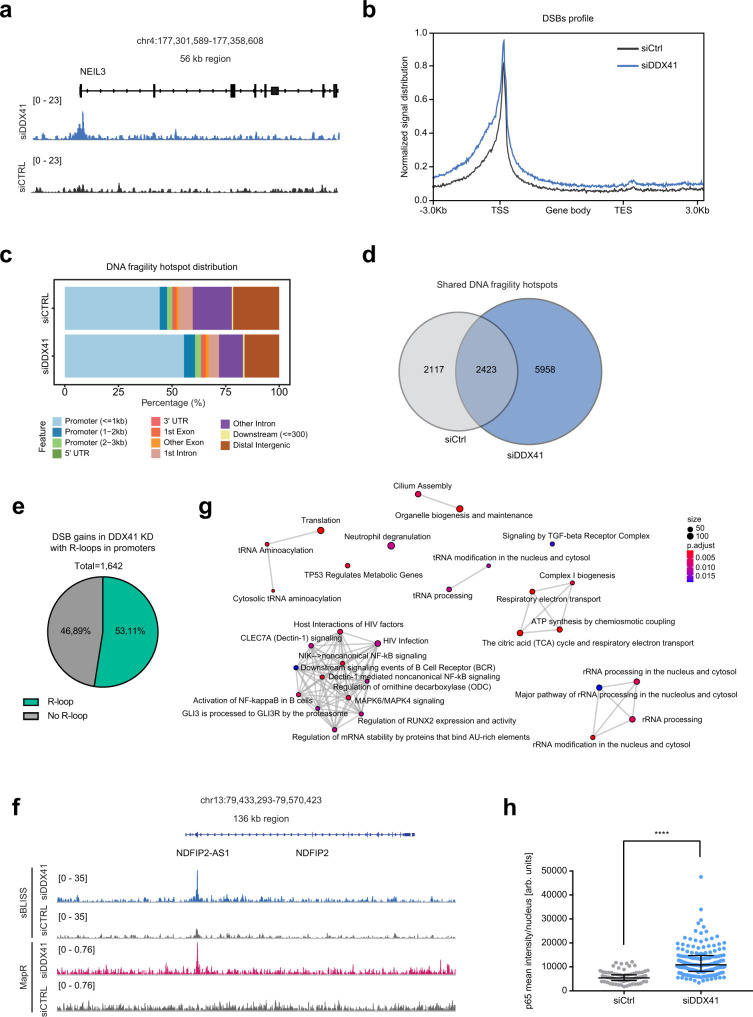
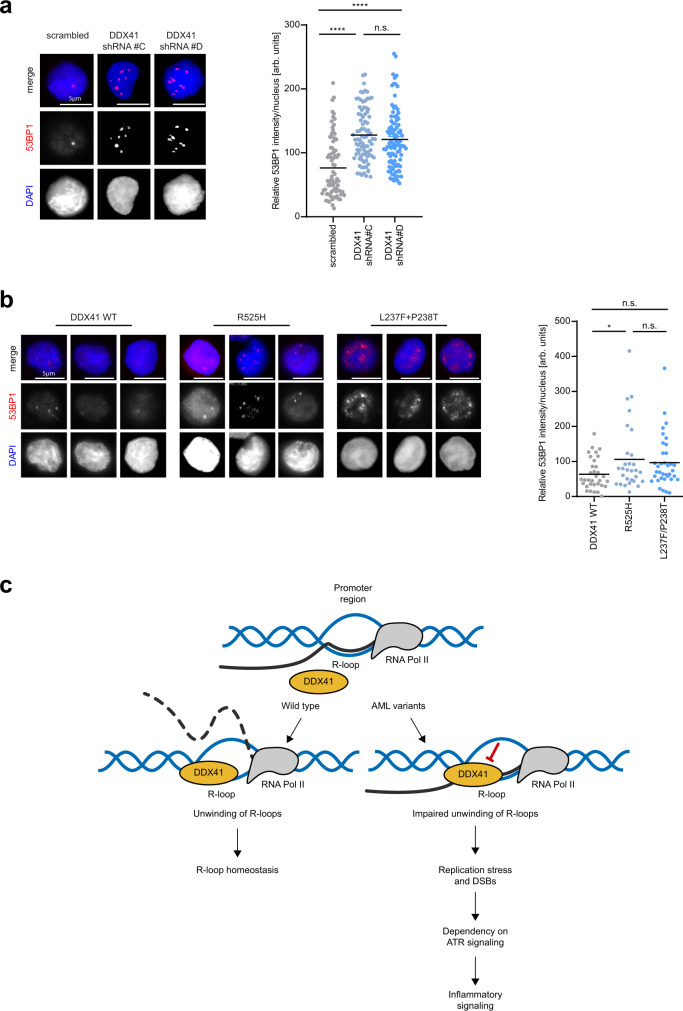
Transcription poses a threat to genomic stability through the formation of R-loops that can obstruct progression of replication forks. R-loops are three-stranded nucleic acid structures formed by an RNA-DNA hybrid with a displaced non-template DNA strand. We developed RNA-DNA Proximity Proteomics to map the R-loop proximal proteome of human cells using quantitative mass spectrometry. We implicate different cellular proteins in R-loop regulation and identify a role of the tumor suppressor DDX41 in opposing R-loop and double strand DNA break accumulation in promoters. DDX41 is enriched in promoter regions in vivo, and can unwind RNA-DNA hybrids in vitro. R-loop accumulation upon loss of DDX41 is accompanied with replication stress, an increase in the formation of double strand DNA breaks and transcriptome changes associated with the inflammatory response. Germline loss-of-function mutations in DDX41 lead to predisposition to acute myeloid leukemia in adulthood. We propose that R-loop accumulation and genomic instability-associated inflammatory response may contribute to the development of familial AML with mutated DDX41.


Conflict of interest statement

The authors declare no competing interests.

Figures

Fig. 1
Fig. 1. RDProx-Mapping R-loop-proximal proteome on native chromatin.
a Schematic representation of the RDProx workflow for identification of R-loop-proximal proteins. HBD or HBD-WKK fused N-terminally to APEX2 were transiently expressed in light or heavy SILAC-labeled HEK293T cells. Biotinylation was induced upon the addition of 500 µM biotin–phenol for 2 h at 37 °C and 1 mM H2O2 for 2 min at room temperature. Samples were pooled after cell lysis and biotinylated proteins purified using NeutrAvidin beads. Denatured proteins were separated by SDS-PAGE and in-gel digested before LC-MS/MS analysis. b Volcano plot of protein groups identified by RDProx in n = 3 biologically independent experiments. Mean log2 ratios of all replicates between HBD and HBD-WKK are plotted against the −log10 FDR. The FDR and enrichment were calculated using Limma. Significantly enriched proteins are highlighted in blue (FDR < 0.01). Light blue indicates proteins in Tier 2 (300 proteins) above 2-fold change of the mean ratio and dark blue indicates proteins in Tier 1 (312 proteins) with a 4-fold change or higher. c Functional interaction network of proteins identified by RDProx. Genes were manually annotated based on literature and corresponding GO terms (Biological Process and Molecular Function). Clusters were generated based on the manual annotation. Edges between the nodes indicate interactions based on STRING with a confidence score equal or above 0.7.
Fig. 2
Fig. 2. DDX41 depletion leads to replication stress and genomic instability.
a Immunofluorescence analysis of yH2AX in U2OS cells 48 h after indicated knockdowns. Center lines of boxplots indicate the median, the limits the 25th–75th percentile, whiskers the 10th–90th percentile, dots outliers. Representative data of n = 3 biologically independent experiments; p-values (p < 0.0001, p = 0.1788, p < 0.0001, p = 0.8259, p > 0.9999, p = 0.9569) were derived from >1000 cells using one-way ANOVA with Tukey correction for multiple comparisons. Representative images of yH2AX (red) staining and Hoechst33342 (blue). Scale bars—20 µm. b Immunofluorescence analysis of yH2AX in U2OS cells ± doxycycline-inducible GFP-tagged M27-RNaseH1. Quantification of cells with medium GFP intensity (medium M27-RNaseH1 expression). Representative boxplots of n = 2 biologically independent experiments. Center of boxplots indicates the median, limits the 25th–75th percentile, whiskers the 10th–90th percentile, dots outliers. p < 0.0001 derived from n > 500 cells using a two-sided Mann–Whitney test. c Single-cell electrophoresis of U2OS cells 48 h after knockdown ± doxycycline-inducible expression of HA-tagged M27-RNaseH1. Representative images are displayed (right). Scale bars—40 µm. Dots depict individual tail moments, black line the median. Representative results from n = 2 biologically independent experiments. p-values (p = 0.0001, p = 0.0031) were derived from n > 50 cells using one-way ANOVA with Tukey correction for multiple comparisons. d Immunofluorescence analysis of 53BP1 foci in U2OS cells 48 h after indicated knockdowns. Whiskers of the box plot represent the 10th–90th percentile, the center line the median, the limits the 25th–75th percentile, and the dots depict outliers. Representative of n = 3 biologically independent experiments. p-value < 0.0001 was derived from n > 1000 cells using an unpaired, two-sided Student’s t-test. e DNA fiber spreading assay of U2OS cells after 48 h knockdown of DDX41. Controls were either treated with DMSO or 100 nM aphidicolin for 1.5 h. Representative images (white line indicates 10 µm scale) and quantifications of fiber tract length. Dots represent individual values and the black line the median. At least 260 fibers were quantified across n = 1 experiment. p-values (p < 0.0001, p < 0.0001, p < 0.0001, p = 0.5794) were derived using one-way ANOVA with Tukey correction for multiple comparisons. f Immunofluorescence analysis of pRPA (Ser33) in U2OS cells 48 h after indicated knockdowns. Representative images (right): Hoechst33342 (blue), pRPA (Ser33) (green). Center of boxplots indicates the median, limits the 25th–75th percentile, whiskers the 10th–90th percentile, dots outliers. Representative data of n = 3 biologically independent experiments are displayed. p-values (p < 0.0001, p > 0.9999, p < 0.0001, p < 0.0001, p = 0.9384, p < 0.0001) were derived from n > 1000 cells using one-way ANOVA with Tukey correction for multiple comparisons. Scale bars—20 µm. Source data are provided as a Source Data file.
Fig. 3
Fig. 3. DDX41 opposes R-loop accumulation and can unwind hybrids in vitro.
a Proximity ligation assay (PLA) between endogenous DDX41 and GFP-tagged HBD or HBD-WKK. Representative images and quantification of nuclear PLA spots. Dots represent results from individual cells, black line indicates the median. p-value < 0.0001 derived from > 50 cells from n = 1 experiment using two-sided Student’s t-test. Scale bars—20 µm. b S9.6 and double-stranded DNA dot-blot analysis of U2OS cells expressing GFP-tagged M27-RNaseH1 upon doxycycline (dox) after 48 h of indicated knockdowns. Representative images (left). Data are represented as mean ± standard deviation (right). Black dots represent individual results from n = 2 biologically independent experiments. p-values (p = 0.437, p = 0.653, p = 0.338, p = 0.0281) derived using one-way ANOVA with Tukey correction for multiple comparisons. c HBD-GFP retention assay after indicated 48 h knockdowns in U2OS cells. Control cells were treated with 100 µM DRB for 3 h. Center of boxplots indicates the median of the population, limits the 25th–75th percentile, whiskers the 10th–90th percentile, and dots represent outliers. Representative data of n = 3 biologically independent experiments are shown. p-values (p < 0.0001, p < 0.0001, p < 0.0001, p < 0.0001) derived from n > 1000 cells using one-way ANOVA with Tukey correction for multiple comparisons. d Fluorescence polarization (FP) assay of full-length DDX41 and indicated 6-FAM-conjugated oligonucleotides in n = 2 independent experiments with individually thawed protein aliquots. The protein concentration on a log2-scale is plotted against the FP in mP (milipolarization unit). Data are represented as mean values ± standard deviation. Colored lines represent Michaelis–Menten fits. e FRET-based RNA–DNA hybrid displacement assay. Titrated full-length (FL) DDX41 is incubated with 100 nM RNA–DNA hybrid substrate and 5 µM ATP. Displacement of the IBFQ-conjugated 38-mer DNA oligo from the 6-FAM-conjugated 13-mer RNA oligo was measured by the change in fluorescence intensity. Data of n = 3 independent experiments with individually thawed proteins are represented as mean values ± standard deviation (n = 2 for 2.5 µM, unlabeled DNA). f Displacement assay from e using titrated full-length (FL) DDX41, R525H, or 153–410 mutant. Data are represented as mean ± standard deviation. Dots indicate results of n = 3 independent experiments with individually thawed proteins. p-values (p = 0.005, p = 0.0021, p < 0.0001, p = 0.0329, p < 0.0001) derived by two-way ANOVA with Tukey correction for multiple comparisons. Source data are provided as a Source Data file.
Fig. 4
Fig. 4. Genome-wide analysis of DDX41 binding to chromatin and R-loops.
a Metagene profile showing the distribution of the GFP-DDX41 CUT&RUN signal in U2OS cells along expressed genes. b Genomic features overlapping GFP-DDX41 CUT&RUN peaks in U2OS cells. Features are color-coded as indicated in the legend. c MapR performed in n = 3 biologically  independent experiments in U2OS cells after 48 h knockdown with control siRNA, DDX41 siRNA, or treatment with 4 µM Actinomycin D for 6 h. Heatmaps of normalized read coverage ranging from ±2 kb around the transcription start site of expressed genes sorted by gene expression based on the RNA-sequencing analysis of U2OS cells. d Scatter plot of MapR regions in U2OS cells. Consensus regions were constructed using the intersection of peaks for the replicates in each condition (siCtrl and siDDX41). The union of these regions was used for further analysis and quantification of the coverage/FC. The mean log2 fold change between siCtrl and siDDX41 is plotted against the log2 average counts per million representing the coverage. Genomic regions that are differentially regulated (FC > 2) are highlighted in red (up) or in blue (down). e Genomic feature distribution of the regulated MapR regions in U2OS cells after DDX41 knockdown. Features are color-coded as indicated in the legend. f The proportion of genomic regions with R-loop gains or losses in U2OS cells overlapping CGIs or not-overlapping regions are depicted. g Reactome pathway over-representation analysis for genes with R-loop gains in U2OS cells. The adjusted p-values (Fisher’s exact test with Bonferroni-Holm correction) are indicated. h Representative snapshot of a genomic region depicting R-loops and GFP-DDX41 binding profiled by MapR and greenCUT&RUN, respectively, in U2OS cells.
Fig. 5
Fig. 5. DDX41 loss leads to DSBs in promoters and inflammatory response.
a Representative snapshot of a genomic region depicting DNA fragility profiled by sBLISS in wild type and DDX41 knockdown HCT116 cells. b Metagene profile showing the double-strand break (DSB) signal distribution profiled by sBLISS along genes in wild type and DDX41 knockdown HCT116 cells. c Genomic features overlapping DNA fragility hotspots mapped by sBLISS in wild type and DDX41 knockdown HCT116 cells. Features are color-coded as indicated in the legend. d Venn diagram showing the number of unique and overlapped peaks mapped by sBLISS in wild type and DDX41 knockdown HCT116 cells. e Pie chart showing the percentage of double-strand breaks (DSB) gains (fold change (FC) > 2) mapped to promoters in DDX41 knockdown HCT116 cells that overlap or not with R-loops mapped in DDX41 knockdown (KD) HCT116 cells. f Representative snapshot of a genomic region showing accumulation of R-loops and DSBs profiled by MapR and sBLISS, respectively, in HCT116 cells. g Network of the Reactome pathway enrichment analysis of upregulated genes after DDX41 knockdown compared to control knockdown based on RNA-seq. All expressed genes were used as background. The size of the dots indicates the number of genes contributing to the displayed term. Gradual coloring represents the adjusted p-values based on Fisher’s exact test with Bonferroni correction for multiple comparisons. h Immunofluorescence analysis of p65 after 48 h of indicated knockdowns in U2OS cells. Dots represent measurements of individual cells, black line indicates the median of the population with interquartile range. Representative data of n = 2 biologically independent experiments. p-value < 0.0001 derived from n > 100 cells using unpaired, two-sided Students’s t-test. Source data are provided as a Source Data file.
Fig. 6
Fig. 6. Model for DDX41 function in R-loop homeostasis.
a Immunofluorescence analysis of HSPCs after 24 h of indicated knockdowns. Cells were nucleofected with plasmids encoding GFP and respective shRNAs. GFP-positive cells were sorted via FACS and seeded on coverslips. Representative images of 53BP1 (red) staining in HSPCs (left). DNA was counterstained with DAPI (blue). Quantification of nuclear 53BP1 intensity (right). Each dot represents a single measured value. The black line indicates the median. At least 80 cells across n = 2 biologically independent experiments were measured per condition. p-values (p < 0.0001, p < 0.0001, p = 0.2227) were calculated by one-way ANOVA with Tukey correction for multiple comparisons. Scale bars—20 µm. Source data are provided as a Source Data file. b Immunofluorescence analysis of HSPCs after expression of DDX41 WT, L237F + P238T or R525H mutants tagged with GFP. GFP-positive cells were sorted by FACS and used for the analysis. Representative images of 53BP1 (red) staining in HSPCs (left). DNA was counterstained with DAPI (blue). Quantification of nuclear 53BP1 intensity (right). Dots represent results from individual cells. The median is indicated by the black line. p-values (p = 0.0237, p = 0.624, p = 6.018) were derived from at least 30 cells across n = 1 experiment using one-way ANOVA with Tukey correction for multiple comparisons. Scale bars—20 µm. c Wild-type DDX41 associates with R-loops in promoters of active genes and balances R-loop levels by unwinding RNA–DNA hybrids. Pathogenic DDX41 variants found in acute myeloid leukemia (AML) display impaired RNA–DNA hybrid unwinding activity, leading to the accumulation of R-loops at promoters. Accumulation of R-loops at promoters results in increased replication stress, DSBs, and inflammatory signaling, rendering DDX41 mutated AML cells vulnerable to ATR inhibitors.

References

    1. Bradner JE, Hnisz D, Young RA. Transcriptional addiction in cancer. Cell. 2017;168:629–643. - PMC - PubMed
    1. Chédin F, Ginno PA, Lott PL, Christensen HC, Korf I. R-loop formation is a distinctive characteristic of unmethylated human CpG island promoters. Mol. Cell. 2012;45:814–825. - PMC - PubMed
    1. Arab K, et al. GADD45A binds R-loops and recruits TET1 to CpG island promoters. Nat. Genet. 2019;51:217–223. - PMC - PubMed
    1. Grunseich C, et al. Senataxin mutation reveals how R-loops promote transcription by blocking DNA methylation at gene promoters. Mol. Cell. 2018;69:426–437.e7. - PMC - PubMed
    1. Skourti-Stathaki K, Proudfoot NJ, Gromak N. Human senataxin resolves RNA/DNA hybrids formed at transcriptional pause sites to promote Xrn2-dependent termination. Mol. Cell. 2011;42:794–805. - PMC - PubMed

Publication types