. 2021 Dec 16;12(1):7322.
doi: 10.1038/s41467-021-27586-w.

Induction of Rosette-to-Lumen stage embryoids using reprogramming paradigms in ESCs

Affiliations

Induction of Rosette-to-Lumen stage embryoids using reprogramming paradigms in ESCs

Jan Langkabel et al. Nat Commun. .

Abstract

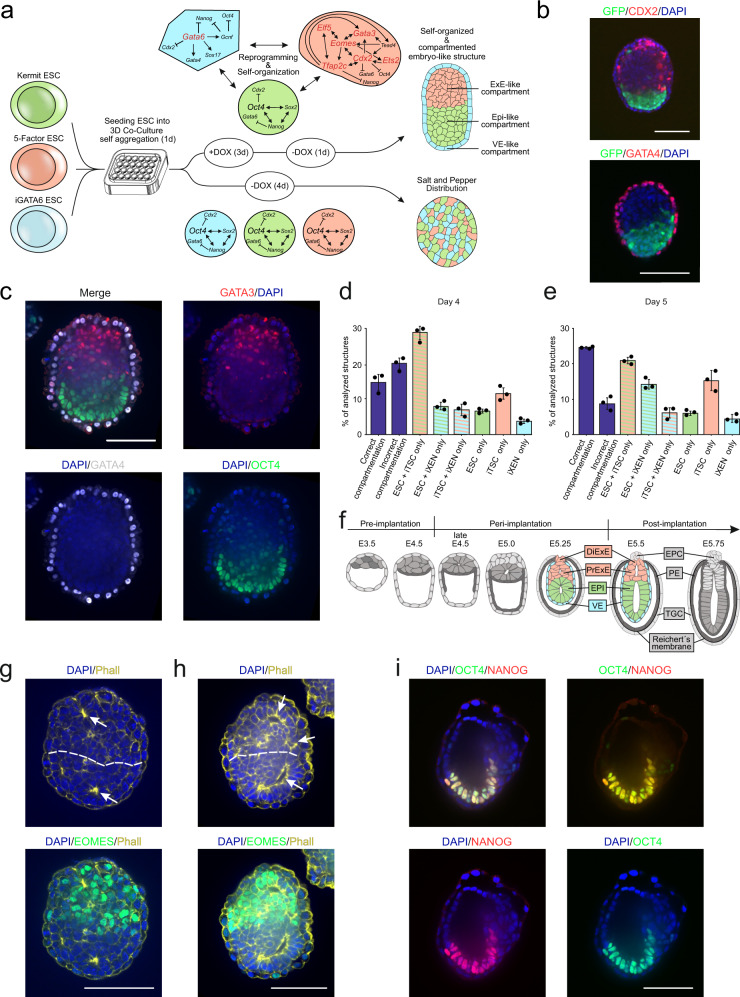
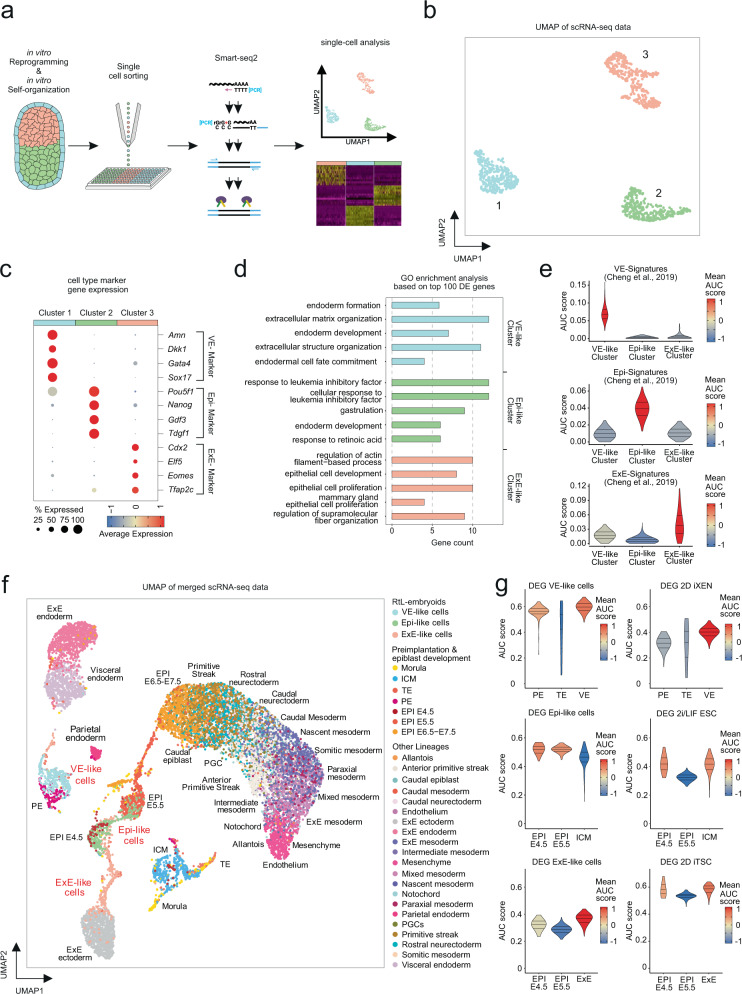
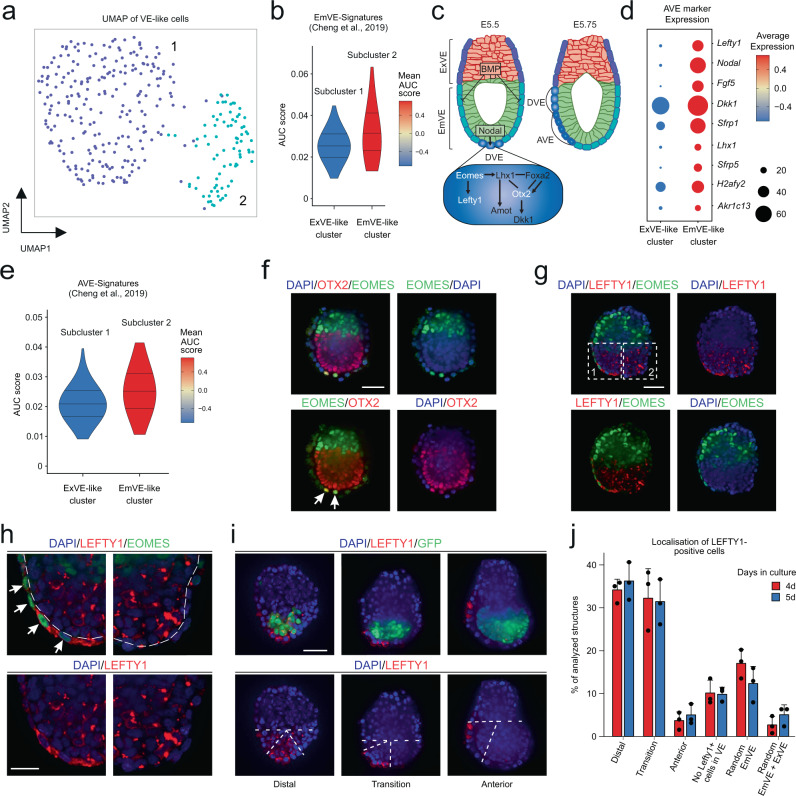
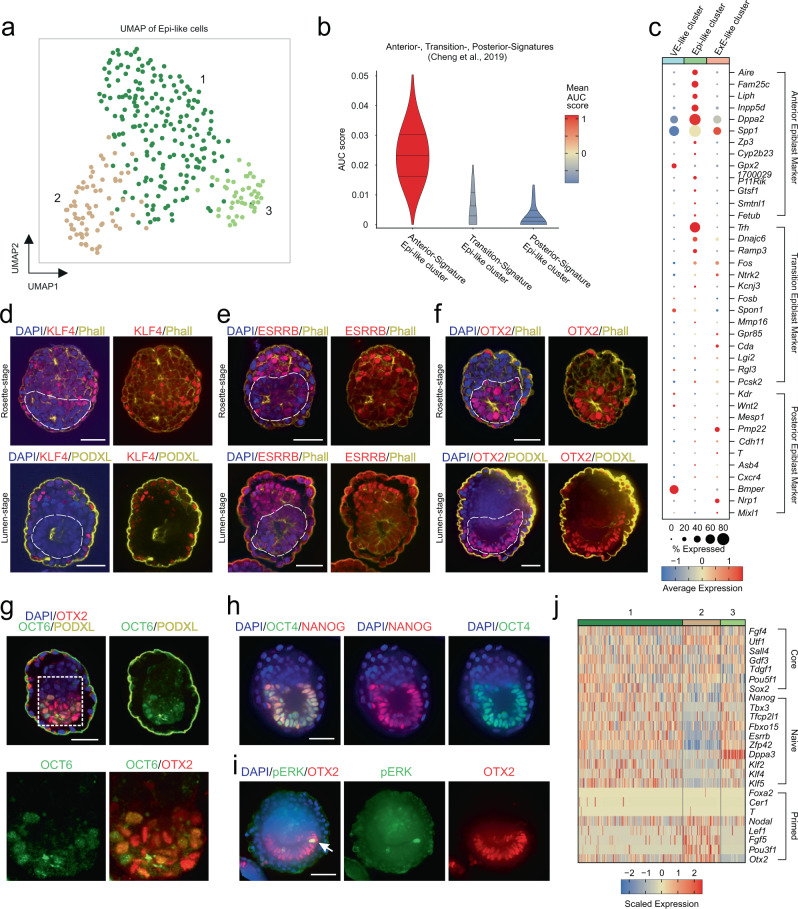
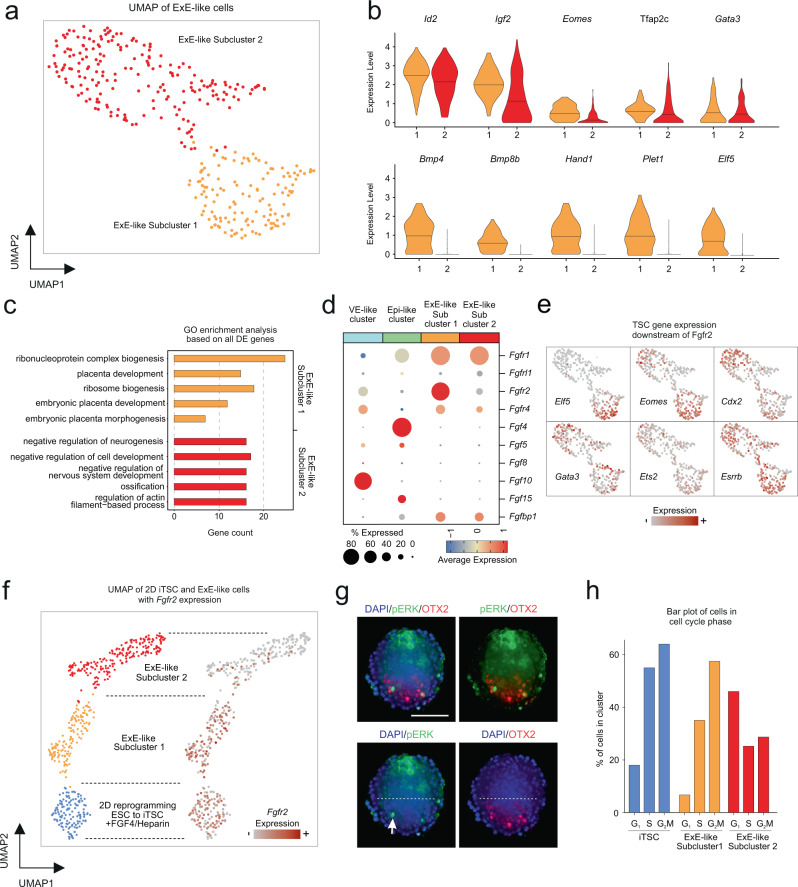
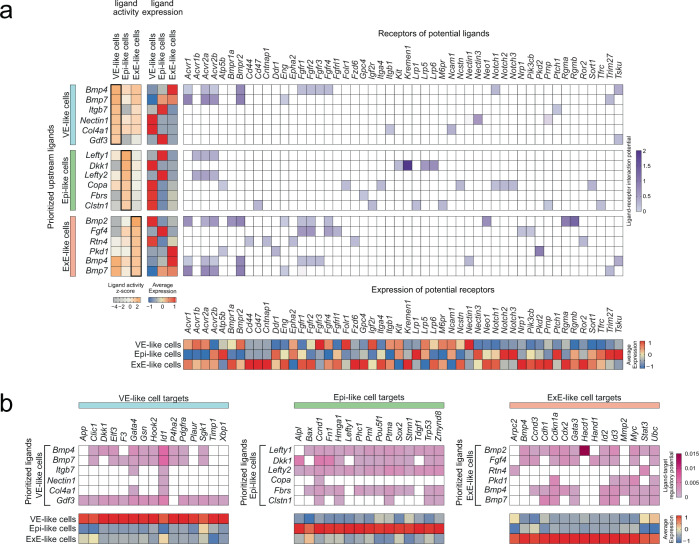
Blastocyst-derived stem cell lines were shown to self-organize into embryo-like structures in 3D cell culture environments. Here, we provide evidence that embryo-like structures can be generated solely based on transcription factor-mediated reprogramming of embryonic stem cells in a simple 3D co-culture system. Embryonic stem cells in these cultures self-organize into elongated, compartmentalized embryo-like structures reflecting aspects of the inner regions of the early post-implantation embryo. Single-cell RNA-sequencing reveals transcriptional profiles resembling epiblast, primitive-/visceral endoderm, and extraembryonic ectoderm of early murine embryos around E4.5-E5.5. In this stem cell-based embryo model, progression from rosette formation to lumenogenesis accompanied by progression from naïve- to primed pluripotency was observed within Epi-like cells. Additionally, lineage specification of primordial germ cells and distal/anterior visceral endoderm-like cells was observed in epiblast- or visceral endoderm-like compartments, respectively. The system presented in this study allows for fast and reproducible generation of embryo-like structures, providing an additional tool to study aspects of early embryogenesis.


Conflict of interest statement

The authors declare no competing interests.

Figures

Fig. 1
Fig. 1. Generation of embryo-like structures using reprogramming paradigms in ESCs.
a Schematic protocol for the generation of embryo-like structures following the method introduced in this study. The three starting cell lines are seeded in 3D Petri Dishes and are allowed to settle and aggregate for 24 h. Thereafter transgene expression in 5 Factor and iGATA6 ESCs is initiated by culture medium supplementation with DOX for three days. After an additional day of culture without DOX, aggregates have formed VE-, Epi-, and ExE-like cellular compartment, resembling early, inner embryonic architecture. b Self-assembled embryo-like structures showing early embryo architecture comprised of a OCT4+(GFP+; green) Epi-like compartment, next to a CDX2 + (red) ExE-like compartment, both of which are surrounded by a GATA4 + (red) VE-like compartment (lower image). DAPI, blue. c Substitution of Kermit ESCs with KNUT1 ESC, a non-fluorescent, unmodified ESC line resulted in similar self-organization, displaying restriction of Epi- (OCT4+; green), ExE- (GATA3+; red), and VE- (GATA4+; gray) marker expression to their respective compartments. DAPI, blue. d At Day 4 into the protocol (Day of DOX Stop) ~15% (total n = 1167) of the structures analyzed displayed embryo-like architecture. e At Day 5 into the protocol ~25% (total n = 778) of the structures analyzed displayed embryo-like architecture. Data of d and e are presented as mean values ± SD. Source data of d and e are provided as a Source Data file. f Scheme of embryonic architecture of E3.5 to E5.75 embryos. EPI-, ExE-, and VE-like compartments resemble the inner compartments of murine embryos between E5.25 and E5.5. DiExE Distal ExE, PrExE Proximal ExE, EPC ectoplacental cone, PE parietal endoderm, TGC trophoblast giant cell. g RtL-embryoids displayed rosette formation, indicated by aggregation of actin filaments. h RtL-embryoids displayed lumen formation in Epi- and ExE-like compartments. Phalloidin (Phall), yellow; EOMES, green; DAPI, blue. i In rare cases, complete lumenogenesis was observed, showing formation of a cavity spanning both Epi- and ExE-like compartments. Scale bars = 100 µm; Dotted lines indicate border of Epi- and ExE-like compartments. OCT4, green; NANOG, red; DAPI, blue. White arrows indicate rosette and lumen formation. Experiments were repeated independently at least three times with similar results (b, c, g, h, i).
Fig. 2
Fig. 2. Analysis of transcriptional profiles by scRNA-Seq.
a Schematic representation of assay performed for SMART-seq2 analysis. b UMAP representation of scRNA-seq results, showing 3 distinct transcriptomic clusters. c Dot Plots showing expression of stem-cell-specific marker genes (Amn, Dkk1, Gata4, Sox17 = VE-like cells; Pou5f1/Oct4, Nanog, Gdf3, Tdgf1 = Epi-like cells; Cdx2, Elf5, Eomes, Tfap2c = ExE-like cells). d GO term enrichment analysis of top 100 differentially expressed genes (log-fold change 1.5; FDR p < 0.05). Statistical test: GO terms were selected from the top sorting by adjusted P-value (p adjusted < 0.05, one-tailed hypergeometric test with Benjamini–Hochberg correction). Bars depict fold enrichment for terms with p < 0.05. e AUCell-based enrichment scores (AUC scores) showing similarity of gene expression signatures of the three clusters compared to their respective natural counterparts as assessed by Cheng et al.. f UMAP of four integrated reference datasets tracking cells during developmental stages from morula to E7.5 gastrulation in murine embryonic and extraembryonic lineages, in comparison to RtL-embryoid VE-, Epi-, and ExE-like cells. g AUCell-based enrichment scores comparing gene signatures of 2D mono-culture and 3D co-culture induced ESCs, TSCs, and XEN cells to natural murine embryo cell clusters from f. Source data of d are provided as a Source Data file.
Fig. 3
Fig. 3. Formation of DVE/AVE-like population in VE-like compartment.
a UMAP representation of VE-like cluster revealing two subclusters diverging in their transcriptional profile. b Comparison of EmVE-like cluster with published scRNA-Seq dataset for EmVE of natural murine embryos revealing high AUCell-based enrichment score and mean expression levels of EmVE genes within EmVE-like cluster. c Schematic representation of DVE and AVE formation in murine embryos between E5.5 and E5.75. d Analysis of AVE marker expression in VE-like subclusters displays higher expression of AVE marker gens inside the EmVE-like cell cluster. e Comparison of published AVE-signatures showing high AUCell-based enrichment score and high mean expression for cells of EmVE-like cluster, in contrast to a lower AUC score and mean expression levels in cells of ExVE-like cluster. f Expression of DVE/AVE markers EOMES and OTX2 was detected to colocalize in cells of the EmVE-compartment in RtL-embryoids, indicated by white arrows. OTX2, red; EOMES, green; DAPI, blue. Scale bar = 50 µm. g DVE/AVE marker LEFTY1 was found colocalizing with EOMES + cells, which was detected to be restricted to one side of the EmVE-like compartment in RtL-embryoids (white squares are magnified in h. Scale bar = 25 µm. h Magnification of the EmVE-like compartment as indicated by the white, dotted squares in g. LEFTY1, red; EOMES, green; DAPI, blue. Scale bar = 20 µm. White arrows indicate EOMES + /LEFTY1 + cells. i LEFTY1 + cells were detected in distal, transition or anterior position in RtL-embryoids. LEFTY1, red; GFP, green; DAPI, blue. Scale bar = 50 µm. j Quantification of LEFTY1 + cell location in RtL-embryoids at day 4 (4d) and day 5 (5d) into the protocol. The majority of RtL-embryoids displayed LEFTY1 + cells in either distal or transition positions, with few RtL-embryoids showing localization of LEFTY1 + in an anterior position, relative to the Epi-like compartments, both 4d (red bars) and 5d (blue bars) into the protocol. Total n = 375 for each, 4d and 5d conditions. Data are presented as mean values ± SD. Source data of j are provided as a Source Data file. Experiments were repeated independently at least three times with similar results (fh).
Fig. 4
Fig. 4. Progression from naïve- to primed-pluripotency in EPI-like compartment.
a The Epi-like compartment of RtL-embryoids shows three transcriptionally diverging subpopulations, assessed in UMAP representation. b Comparison to Anterior-, Transition-, and Posterior-Epiblast signatures published by Cheng et al. revealed highest transcriptional similarity with anterior-epiblast cells. c Marker gene expression for Anterior-, Transition-, and Posterior-marker genes. d, f IF staining against pluripotency markers during progression from rosette- to lumen stage. The Epi-like compartment of RtL-embryoids (indicated by dotted lines) displays downregulation of naïve-pluripotency markers KLF4 and ESRRB during progression from rosette to lumen stage. Expression of OTX2 was detected at both, rosette and lumen stage. Scale bars = 50 µm. KLF4/ESRRB/OTX2, red; Phalloidin (Phall)/ PODXL, yellow; DAPI, blue. g Primed-pluripotency marker OCT6 was detected to be weakly expressed in some OTX2 + cells at lumen stage; Lower Panel shows magnification of area indicated in panel above. Scale bars = 50 µm. OTX2, red; OCT6, green; PODXL, yellow; DAPI, blue. h Expression of OCT4 and NANOG was detected in RtL-embryoids throughout the culture period. Scale bars = 50 µm. OCT4, green; NANOG, red; DAPI, blue. i pERK pulses were detected in single Epi-like cells of RtL-embryoids at lumen stage, in addition to a diffuse and weak pERK activity in the ExE-like compartment. Scale bars = 50 µm. OTX2, red; pERK, green; DAPI, blue. White arrow indicates pERK+ Epi-like cell. j Single-cell heatmap of core-, naïve-, and primed- pluripotency markers among cells of the Epi-like Subclusters, revealing predominantly naïve-pluripotency factor expression in subcluster 1, while subcluster 2 displayed downregulation of naïve- and upregulation of primed-pluripotency factor in subcluster 2. Subcluster 3 displayed a PGC-like character. Experiments were repeated independently at least three times with similar results (di).
Fig. 5
Fig. 5. Bipartite transcriptional character of cells comprising the ExE-like cluster.
a UMAP representation reveals two transcriptionally diverging subclusters for the ExE-like cluster. b Violinplots show expression of trophoblast marker genes. The plots display cells with an expression >0 (line represent mean of cells). c GO Term analysis based on all variable genes of each of the ExE-like subclusters, revealed diverging biological functions of the two subcluster. d Dotplot displaying FGF-receptor and ligand expressing cells throughout VE-, Epi-, and ExE-like (Sub)clusters. e Featureplots depicting expression of FGF4 downstream signaling targets within the ExE-like cluster. f UMAP representation including transcriptional profiles of iTSCs obtained from reprogramming in FGF4/Heparin supplemented 2D mono-culture, shows close clustering of iTSCs and ExE-like Subcluster 1, both of which display high expression of the FGF4 receptor Fgfr2. g IF staining against pERK showed most intense pERK activity in the distal part of the ExE-like compartment. Scale bar = 100 µm; White arrow indicates pERK+ cell in Epi-like compartment; Dotted lines represents border of Epi- and ExE-like compartments. OTX2, red; pERK, green; DAPI, blue. h Bar plots displaying distribution of cell cycle phases in ExE-like Subcluster 1, 2 and iTSCs, as assessed by Nestorowa et al., confirming stem cell characteristics of ExE-like Subcluster 1 and differentiating character of ExE-like Subcluster 2. Experiments were repeated independently at least three times with similar results (g).
Fig. 6
Fig. 6. Ligand-to-target interaction landscape of major compartments in RtL-embryoids.
a Prioritized upstream ligands from all embryo-like compartments (left panel) based on the interaction with all other cells and their average expression (middle panel); In the right panel are potential receptors expressed by the corresponding compartment and (bottom) their average expression. b In the top panel are potential target genes of the prioritized upstream ligands and on the bottom panel their average expression.

References

    1. Rossant J, Tam PP. Blastocyst lineage formation, early embryonic asymmetries and axis patterning in the mouse. Development. 2009;136:701–713. - PubMed
    1. Tanaka S, Kunath T, Hadjantonakis AK, Nagy A, Rossant J. Promotion of trophoblast stem cell proliferation by FGF4. Science. 1998;282:2072–2075. - PubMed
    1. Evans MJ, Kaufman MH. Establishment in culture of pluripotential cells from mouse embryos. Nature. 1981;292:154–156. - PubMed
    1. Kunath T, et al. Imprinted X-inactivation in extra-embryonic endoderm cell lines from mouse blastocysts. Development. 2005;132:1649–1661. - PubMed
    1. Bedzhov I, Graham SJ, Leung CY, Zernicka-Goetz M. Developmental plasticity, cell fate specification and morphogenesis in the early mouse embryo. Philos. Trans. R. Soc. Lond. B. Biol. Sci. 2014;369:1657. - PMC - PubMed

Publication types