. 2021 Dec 16;4(1):1389.
doi: 10.1038/s42003-021-02852-1.

Deep dissection of the antiviral immune profile of patients with COVID-19

Affiliations

Deep dissection of the antiviral immune profile of patients with COVID-19

Djordje Atanackovic et al. Commun Biol. .

Abstract

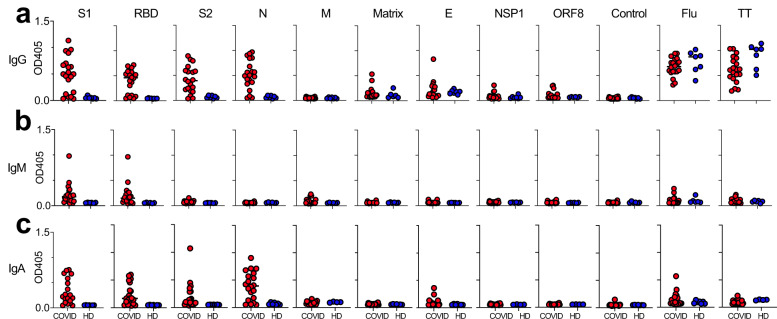
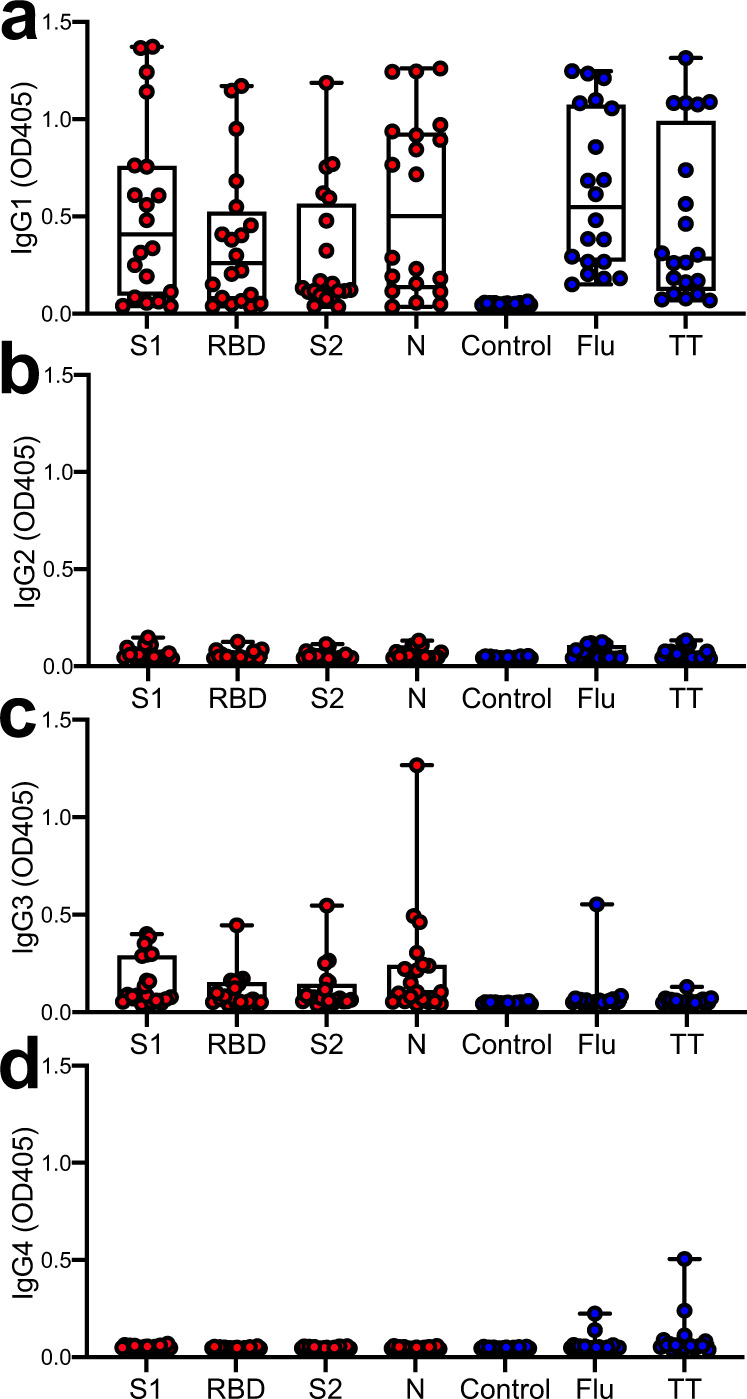
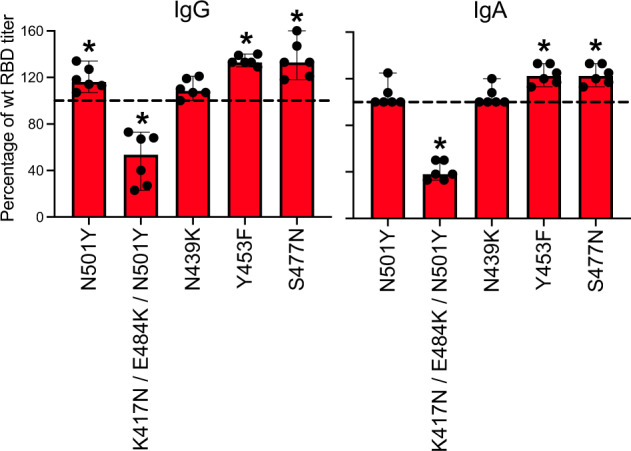
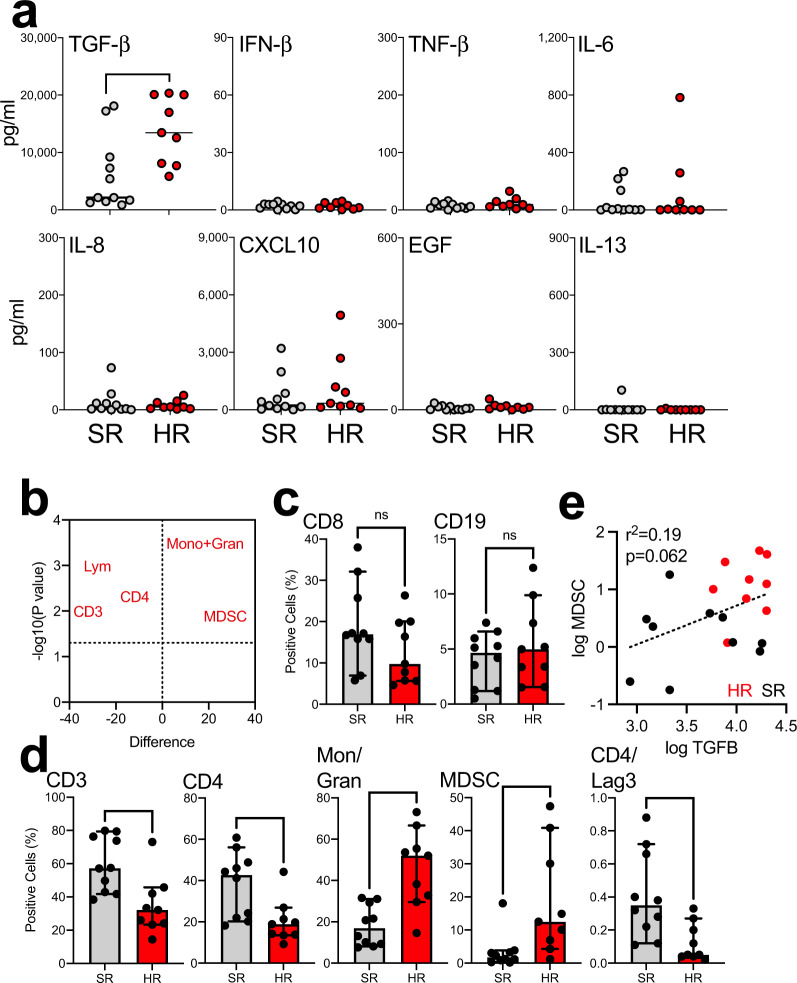
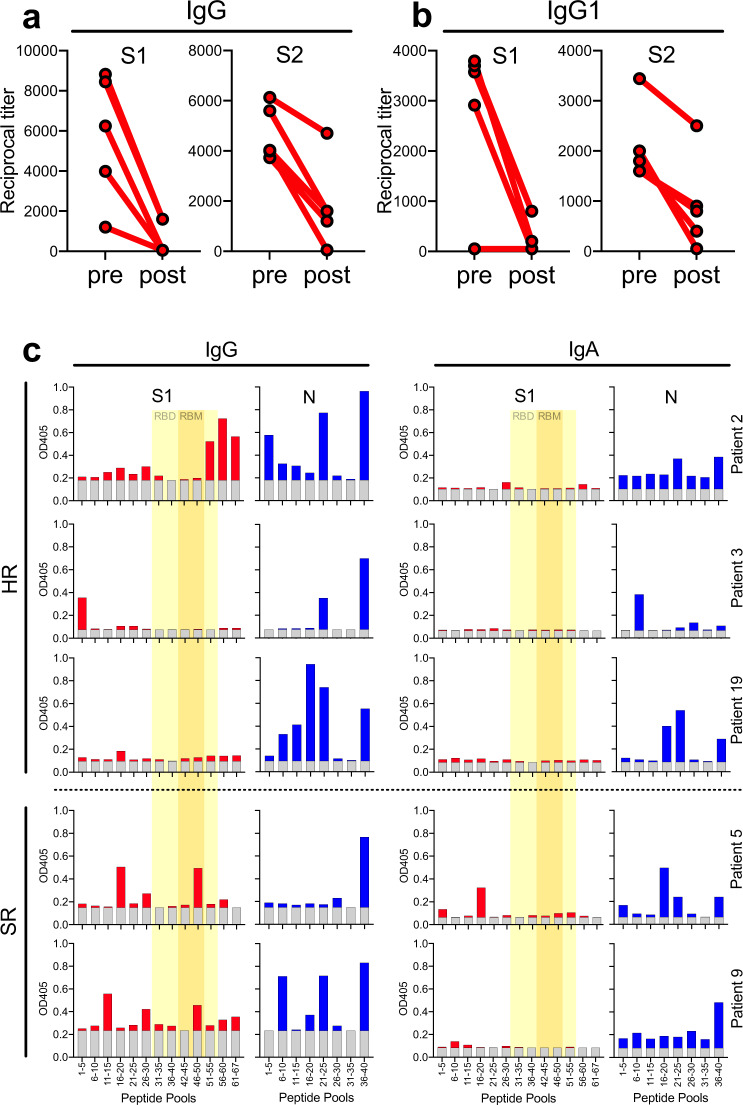
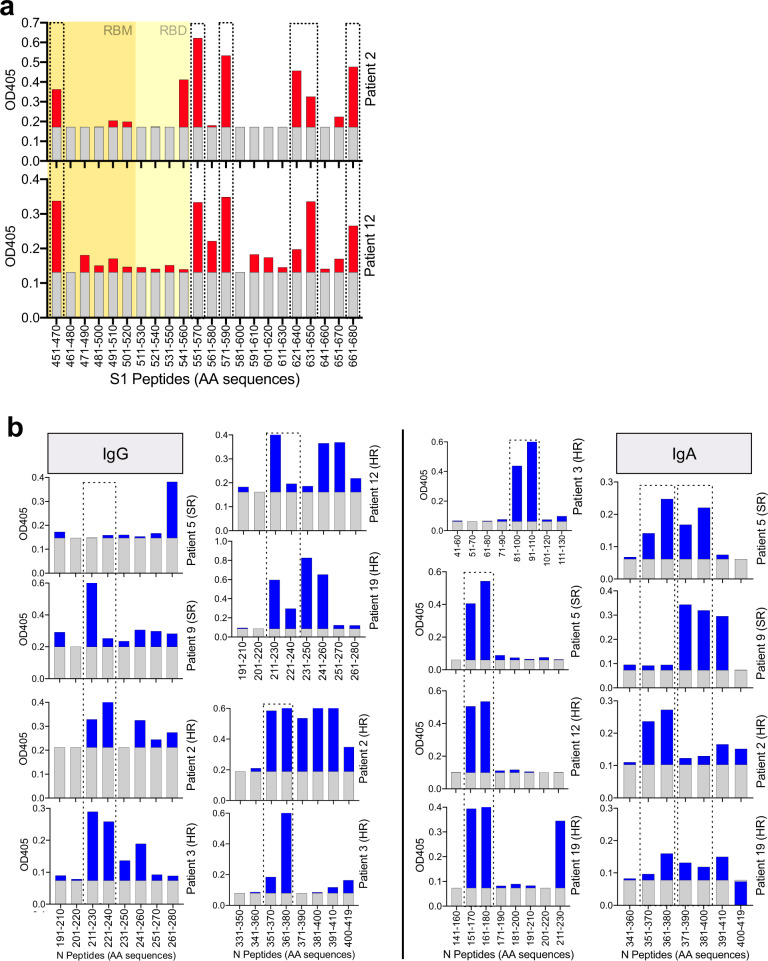
In light of Severe Acute Respiratory Syndrome Coronavirus 2 (SARS-CoV-2) variants potentially undermining humoral immunity, it is important to understand the fine specificity of the antiviral antibodies. We screened 20 COVID-19 patients for antibodies against 9 different SARS-CoV-2 proteins observing responses against the spike (S) proteins, the receptor-binding domain (RBD), and the nucleocapsid (N) protein which were of the IgG1 and IgG3 subtypes. Importantly, mutations which typically occur in the B.1.351 "South African" variant, significantly reduced the binding of anti-RBD antibodies. Nine of 20 patients were critically ill and were considered high-risk (HR). These patients showed significantly higher levels of transforming growth factor beta (TGF-β) and myeloid-derived suppressor cells (MDSC), and lower levels of CD4+ T cells expressing LAG-3 compared to standard-risk (SR) patients. HR patients evidenced significantly higher anti-S1/RBD IgG antibody levels and an increased neutralizing activity. Importantly, a large proportion of S protein-specific antibodies were glycosylation-dependent and we identified a number of immunodominant linear epitopes within the S1 and N proteins. Findings derived from this study will not only help us to identify the most relevant component of the anti-SARS-CoV-2 humoral immune response but will also enable us to design more meaningful immunomonitoring methods for anti-COVID-19 vaccines.


Conflict of interest statement

C.R. was a speaker for Merck Sharp and Dohme, AstraZeneca, and Roche (CH) and has research collaborations (non-financial support) with Guardant Health; advisory board activity: Archer, Inivata and MD Serono, Novartis, and BMS. Research grant from LCRF-Pfizer. The rest of the authors declare no competing interests.

Figures

Fig. 1
Fig. 1. Analysis of antibody responses against full-length proteins.
Analyzing plasma samples from 20 patients with COVID-19 in an ELISA we observed a IgG, b IgM (middle), and c IgA responses against a restricted group of four full-length recombinant proteins of the SARS-CoV-2 virus. Full-length GST (glutathione S-transferase) protein was used as a negative control and Influenza A nucleoprotein (Flu) and tetanus toxoid (TT) proteins served as positive controls. Dots indicate resulting OD values of patients (red) vs 7 healthy controls (blue). Asterisks indicate statistical significance of differences as determined by unpaired two-tailed Student’s t test. *p < 0.05; **p < 0.01; ***p < 0.001; ns: not significant.
Fig. 2
Fig. 2. Analysis of IgG subclasses in seropositive patients.
Analyzing plasma samples from 20 patients with COVID-19 for IgG responses against the four SARS-CoV virus proteins S1, RBD, S2, and N in an ELISA we found that these responses primarily consisted of the a IgG1 and c IgG3 but not the b IgG2 and d IgG4 subtypes. Full-length GST protein was used as a negative control and Flu and TT proteins served as positive controls. Boxplots extend from the 25th to 75th percentiles, the line indicates the median, and whiskers indicate the range.
Fig. 3
Fig. 3. Antibody responses against SARS-CoV-2 variants.
We analyzed plasma samples from six patients with known antibody response against the native RBD protein for binding of their polyclonal IgG (left) and IgA (right) antibodies to RBD proteins harboring distinct mutations typically found in different SARS-CoV variants. Binding of polyclonal sera was significantly reduced compared to the wildtype RBD (dashed line) in the case of the RBD protein containing three different mutations K417N/E484K/N501Y. Bar graphs indicate medians and whiskers indicate 95% C.I. Asterisks indicate significance levels of p < 0.05 when compared to responses against the native RBD protein in the same patient using a Wilcoxon test.
Fig. 4
Fig. 4. Analysis of cytokine patterns and T cell phenotypes in COVID-19 patients.
a We analyzed cytokine/chemokine levels in the peripheral blood of nine COVID patients who were critically ill (HR = high risk; red dots) and compared them to levels in 11 non-critically ill patients (SR = standard risk; gray dots). b Different lymphocyte subpopulations were quantified in the peripheral blood of our COVID patients using multicolor flow cytometry and subsets discriminating between HR and SR patients were identified using a volcano plot analysis. c No significant differences were detected with regard to two different subsets of interest: CD19+ B cells (data indicate percentages of all lymphoctes) and CD8+ T cells (data indicate percentages of all CD3+ lymphoctes). d Patients with HR disease showed lower proportions of total CD3+ T cells (data indicate percentages of all lymphoctes), CD4+ T cells (data indicate percentages of all CD3+ lymphoctes), and Lag-3-expressing CD4+ T cells (data indicate percentages of all CD3+CD4+ lymphoctes) but higher percentages of MDSC (data indicate percentages of all CD16HLA-DR monocytes/granulocytes). Numbers represent percentages of cells within the morphologic lymphocyte or monocyte gates, respectively. Groups were compared using a Mann–Whitney U test (*p < 0.05, **p < 0.01, ***p < 0.001). e Proportions of MDSC plotted against TGF-β concentrations; r2 and p value were determined by linear regression.
Fig. 5
Fig. 5. Quantification of antibody titers against SARS-CoV proteins.
a We performed a comparative analysis IgG, IgM, and IgA antibody titers against the SARS-CoV virus proteins S1, RBD, S2, and N in nine high-risk (HR, red bars) vs. 11 standard-risk (SR, gray bars) patients. Recombinant Flu and TT proteins served as controls. Bar graphs indicate medians and whiskers indicate ranges. Asterisks indicate significance differences between groups (*p < 0.05, **p < 0.01). b Comparative analysis of viral neutralization in patients with high-risk vs. standard-risk COVID-19. c Correlation of viral neutralization with IgG antibody titers against S1, RBD, and S2 performing linear regression.
Fig. 6
Fig. 6. Relevance of glycosylated and linear SARS-CoV epitopes.
Plasma samples from five patients with known anti-SARS-CoV reactivity were analyzed for a IgG and b IgG1 titers against deglycosylated vs. native S1 and S2 proteins. c We used peptide pools of five 20mer peptides each overlapping by 10aa to determine IgG and IgA reactivity against distinct regions within the S1 (red bars) and N (blue bars) proteins. Gray bars indicate background levels. RBD and RBM regions within the S1 protein are highlighted in yellow and orange, respectively. Asterisks indicate statistical significance of differences as determined by paired two-tailed Student’s t test. *p < 0.05; **p < 0.01.
Fig. 7
Fig. 7. Detailed characterization of the B cell epitope landscape in COVID-19 patients.
a Plasma samples from two patients with known SARS-CoV reactivity were analyzed for IgG responses against individual 20mer peptides of the S1 protein covering the RBD (highlighted in yellow), the RBM within the RBD (highlighted in orange), and the region C-terminally adjacent to the RBD. b Plasma samples from six patients with known SARS-CoV reactivity were analyzed for IgG and IgA responses against individual 20mer peptides of the N protein. Values represent ODs in an ELISA assay and shared epitopes are marked using dotted lines.

References

    1. Li R, et al. Substantial undocumented infection facilitates the rapid dissemination of novel coronavirus (SARS-CoV-2) Science. 2020;368:489–493. - PMC - PubMed
    1. World Health Organization. Coronavirus disease (COVID-19) pandemic. Available from: https://www.who.int/emergencies/diseases/novel-coronavirus-2019.
    1. Guan WJ, et al. Clinical characteristics of coronavirus disease 2019 in China. N. Engl. J. Med. 2020;382:1708–1720. - PMC - PubMed
    1. Richardson S, et al. Presenting characteristics, comorbidities, and outcomes among 5700 patients hospitalized with COVID-19 in the New York City Area. JAMA. 2020;323:2052–2059. - PMC - PubMed
    1. Li Q, et al. Early transmission dynamics in Wuhan, China, of novel coronavirus-infected pneumonia. N. Engl. J. Med. 2020;382:1199–1207. - PMC - PubMed

MeSH terms

Supplementary concepts