

Longitudinal dietary trajectories from preconception to mid-childhood in women and children in the Southampton Women's Survey and their relation to offspring adiposity: a group-based trajectory modelling approach
- PMID: 34916617
- PMCID: PMC8960403
- DOI: 10.1038/s41366-021-01047-2
Longitudinal dietary trajectories from preconception to mid-childhood in women and children in the Southampton Women's Survey and their relation to offspring adiposity: a group-based trajectory modelling approach
Abstract
Background: Rates of childhood obesity are increasing globally, with poor dietary quality an important contributory factor. Evaluation of longitudinal diet quality across early life could identify timepoints and subgroups for nutritional interventions as part of effective public health strategies.
Objective: This research aimed to: (1) define latent classes of mother-offspring diet quality trajectories from pre-pregnancy to child age 8-9 years, (2) identify early life factors associated with these trajectories, and (3) describe the association between the trajectories and childhood adiposity outcomes.
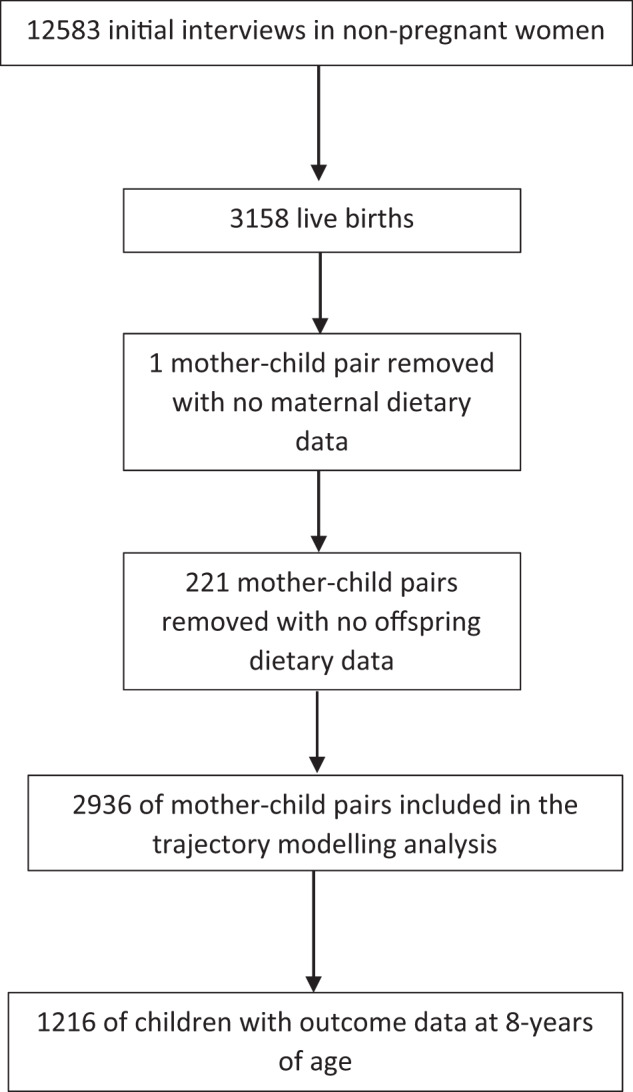
Design: Dietary data from 2963 UK Southampton Women's Survey mother-offspring dyads were analysed using group-based trajectory modelling of a diet quality index (DQI). Maternal diet was assessed pre-pregnancy and at 11- and 34-weeks' gestation, and offspring diet at ages 6 and 12 months, 3, 6-7- and 8-9-years using interviewer-administered food frequency questionnaires. At each timepoint, a standardised DQI was derived using principal component analysis. Adiposity age 8-9 years was assessed using dual-energy X-ray absorptiometry (DXA) and BMI z-scores.
Results: A five-trajectory group model was identified as optimal. The diet quality trajectories were characterised as stable, horizontal lines and were categorised as poor (n = 142), poor-medium (n = 667), medium (n = 1146), medium-better (n = 818) and best (n = 163). A poorer dietary trajectory was associated with higher maternal pre-pregnancy BMI, smoking, multiparity, lower maternal age and lower educational attainment. Using linear regression adjusted for confounders, a 1-category decrease in the dietary trajectory was associated with higher DXA percentage body fat (0.08 SD (95% confidence interval 0.01, 0.15) and BMI z-score (0.08 SD (0.00, 0.16) in the 1216 children followed up at age 8-9 years.
Conclusion: Mother-offspring dietary trajectories are stable across early life, with poorer diet quality associated with maternal socio-demographic and other factors and childhood adiposity. The preconception period may be an important window to promote positive maternal dietary changes in order to improve childhood outcomes.
© 2021. The Author(s).
Conflict of interest statement
In relation to the current work, none of the authors report any competing interests. KMG has received reimbursement for speaking at conferences sponsored by companies selling nutritional products, and is part of an academic consortium that has received research funding from Abbott Nutrition, Nestec, BenevolentAI Bio Ltd. and Danone. JB has received grants from Danone Nutricia Early Life Nutrition and is part of a collaboration with Iceland Foods Ltd.
Figures


References
-
- Koletzko B, Fishbein M, Lee WS, Moreno L, Mouane N, Mouzaki M, et al. Prevention of Childhood Obesity: A Position Paper of the Global Federation of International Societies of Paediatric Gastroenterology, Hepatology and Nutrition (FISPGHAN) J Pediatr Gastroenterol Nutr. 2020;70:702–10. - PubMed
-
- NCD Risk Factor Collaboration (NCD-RisC). Worldwide trends in body-mass index, underweight, overweight, and obesity from 1975 to 2016: a pooled analysis of 2416 population-based measurement studies in 128·9 million children, adolescents, and adults. Lancet Lond Engl. 2017;390: 2627–42. - PMC - PubMed
-
- National Child Measurement Programme. Executive summary: learning from local authorities with downward trends in childhood obesity. GOV.UK. https://www.gov.uk/government/publications/national-child-measurement-pr... (accessed 28 Jun 2021).
-
- Geserick M, Vogel M, Gausche R, Lipek T, Spielau U, Keller E, et al. Acceleration of BMI in Early Childhood and Risk of Sustained Obesity. N Engl J Med. 2018;379:1303–12. - PubMed
Publication types
MeSH terms
Grants and funding
- 17702/VAC_/Versus Arthritis/United Kingdom
- RG/15/17/31749/BHF_/British Heart Foundation/United Kingdom
- MC_PC_21003/MRC_/Medical Research Council/United Kingdom
- RG/15/17/3174/BHF_/British Heart Foundation/United Kingdom
- MR/V005839/1/MRC_/Medical Research Council/United Kingdom
- MC_U147585819/MRC_/Medical Research Council/United Kingdom
- MC_PC_21001/MRC_/Medical Research Council/United Kingdom
- MC_UP_A620_1014/MRC_/Medical Research Council/United Kingdom
- MC_UU_12011/1/MRC_/Medical Research Council/United Kingdom
- G0601019/MRC_/Medical Research Council/United Kingdom
- MC_UU_12011/4/MRC_/Medical Research Council/United Kingdom
- G0400491/MRC_/Medical Research Council/United Kingdom
- MC_U147585824/MRC_/Medical Research Council/United Kingdom
- MC_U147585827/MRC_/Medical Research Council/United Kingdom
- MC_PC_21000/MRC_/Medical Research Council/United Kingdom
LinkOut - more resources
Full Text Sources
Medical
