. 2022 Feb;17(2):206-216.
doi: 10.1038/s41565-021-01032-w. Epub 2021 Dec 16.

Intrapleural nano-immunotherapy promotes innate and adaptive immune responses to enhance anti-PD-L1 therapy for malignant pleural effusion

Affiliations

Intrapleural nano-immunotherapy promotes innate and adaptive immune responses to enhance anti-PD-L1 therapy for malignant pleural effusion

Yang Liu et al. Nat Nanotechnol. 2022 Feb.

Abstract

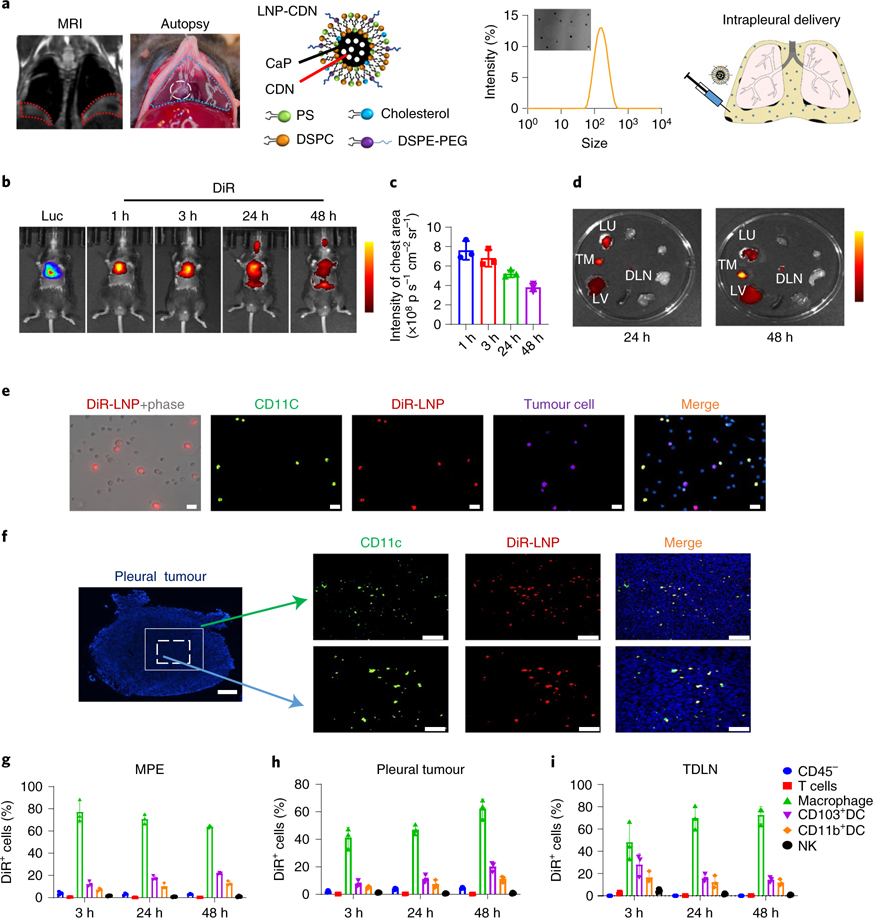
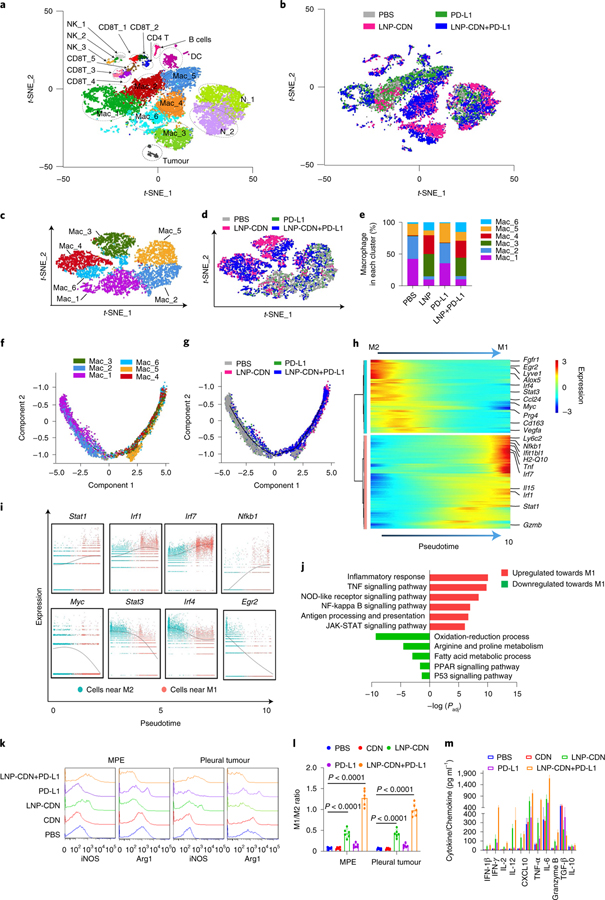
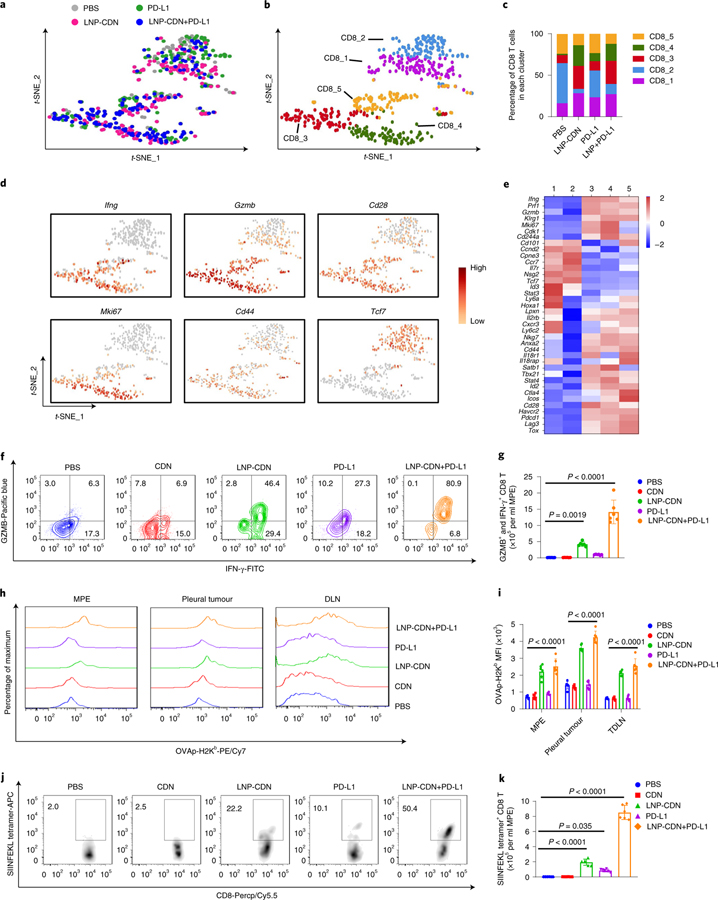
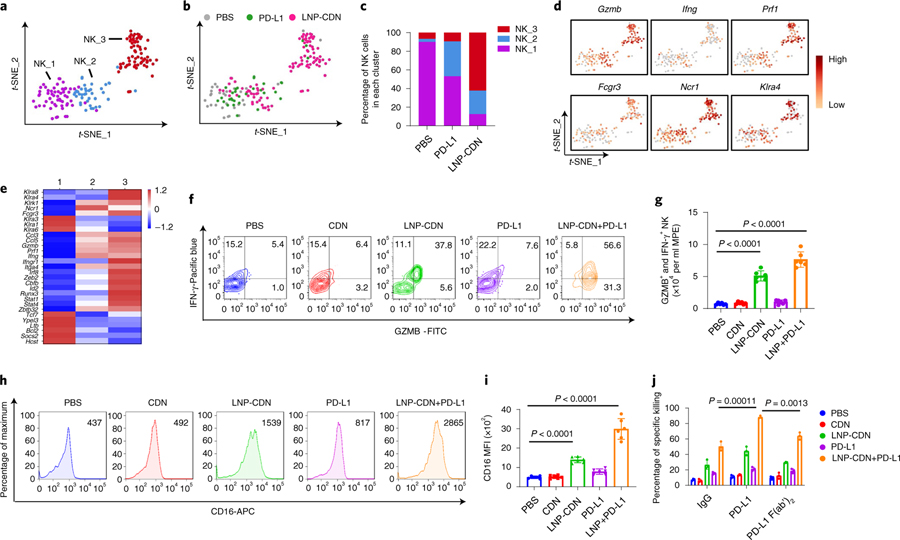
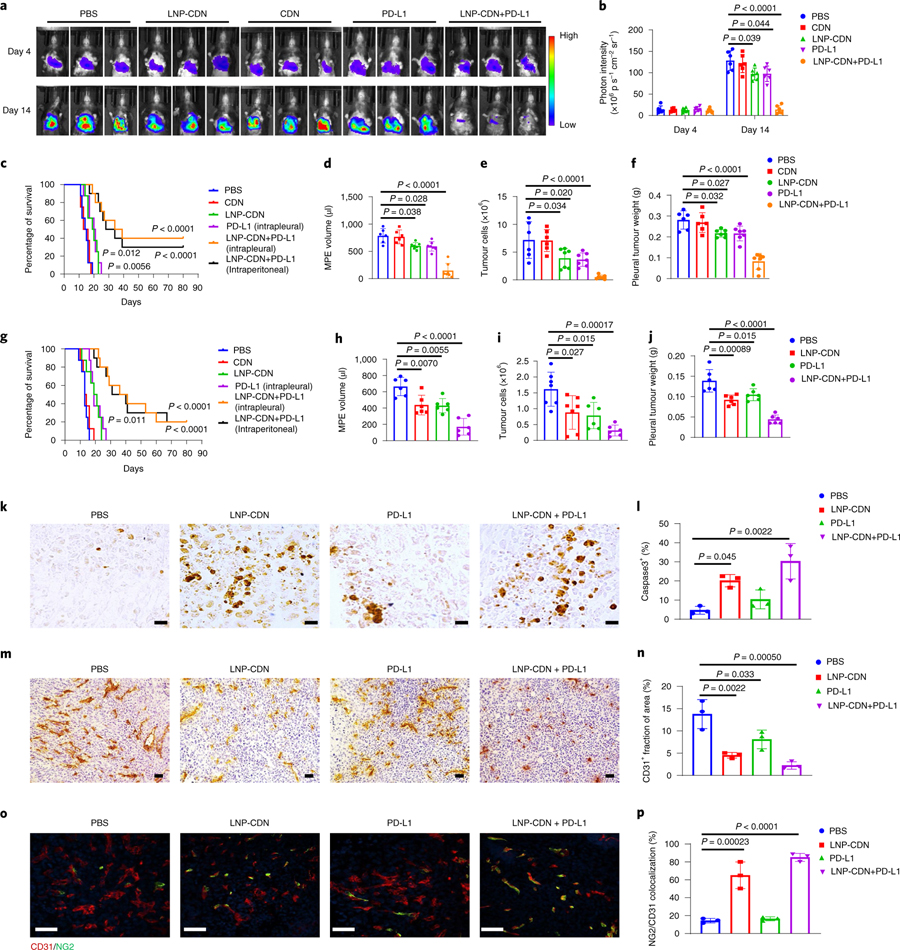
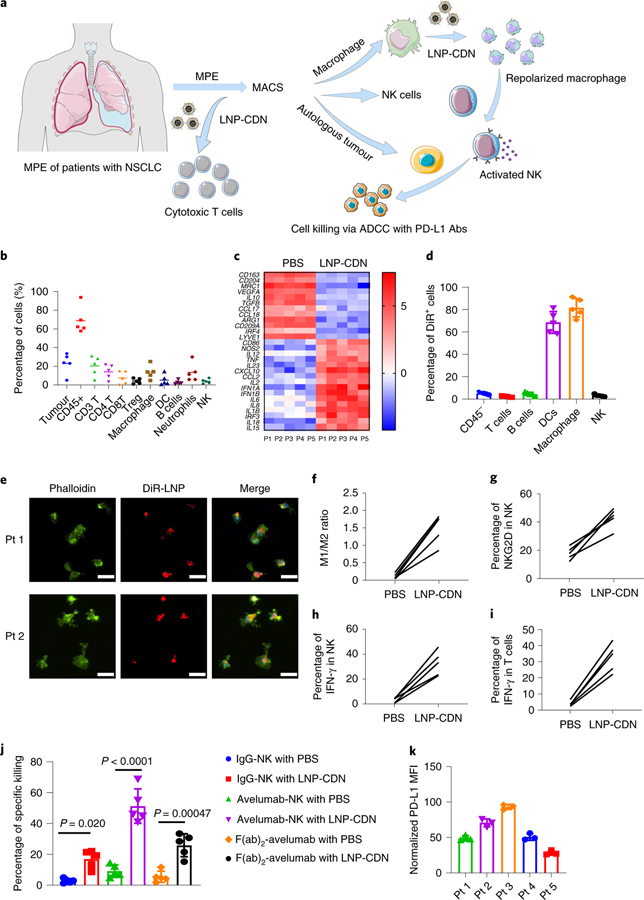
Malignant pleural effusion (MPE) is indicative of terminal malignancy with a uniformly fatal prognosis. Often, two distinct compartments of tumour microenvironment, the effusion and disseminated pleural tumours, co-exist in the pleural cavity, presenting a major challenge for therapeutic interventions and drug delivery. Clinical evidence suggests that MPE comprises abundant tumour-associated myeloid cells with the tumour-promoting phenotype, impairing antitumour immunity. Here we developed a liposomal nanoparticle loaded with cyclic dinucleotide (LNP-CDN) for targeted activation of stimulators of interferon genes signalling in macrophages and dendritic cells and showed that, on intrapleural administration, they induce drastic changes in the transcriptional landscape in MPE, mitigating the immune cold MPE in both effusion and pleural tumours. Moreover, combination immunotherapy with blockade of programmed death ligand 1 potently reduced MPE volume and inhibited tumour growth not only in the pleural cavity but also in the lung parenchyma, conferring significantly prolonged survival of MPE-bearing mice. Furthermore, the LNP-CDN-induced immunological effects were also observed with clinical MPE samples, suggesting the potential of intrapleural LNP-CDN for clinical MPE immunotherapy.


Conflict of interest statement

Competing interests

The authors declare no competing interests.

Figures

Fig. 1 |
Fig. 1 |. Intrapleurally administered LNP targets phagocytes in MPe and pleural tumours.
a, Establishment of a mouse MPE model and intrapleural injection of LNP-CDN with a diameter of 120 nm, measured by transmission electron microscopy (TEM) and dynamic light scattering. MRI and autopsy confirmed the development of intrapleural effusion and pleural tumours derived from LLC-Luc cells. b–c, In vivo IVIS imaging (b) and quantitative photon counts (c) over time post-intrapleural DiR-labelled LNPs. d, Representative ex vivo IVIS imaging (of three independent experiments) of major organs from MPE mice receiving intrapleural DiR-LNP. DLN, draining lymph node; LU, lung; LV, liver; TM, (pleural) tumour. Data are shown as the mean ± s.d. of n = 3 biologically independent mice per time point. Scale bar, yellow to dark red, signal intensity high to low. e, Live cells were collected from the MPE 24 h postintrapleural DiR-LNP for immunofluorescence microscopy. Double staining showed DiR-LNPs (red) colocalizing predominantly with CD11c+ phagocytes (green). LLC-Luc tumour cells (purple), 4′−6-diamidino-2-phenylindole (DAPI) (blue); scale bars, 20 μm. Representative images of three independent experiments. f, A representative pleural tumour was dissected from the pleural cavity 24 h after intrapleural DiR-LNP. Immunofluorescence staining showed that DiR-LNPs penetrated well intratumorally and colocalized with CD11c+ phagocytes. Whole pleural tumour, scale bar, 250 μm; top scale bars, 100 μm; bottom scale bars, 50 μm. Representative images of three independent animals. g–i, Flow cytometry analysis at different times after intrapleural DiR-LNP determined the percentage of DiR+ cells within their respective population in MPE (g) pleural tumours (h) and TDLNs (i) Data are shown as the mean ± s.d. of n = 3 biologically independent mice.
Fig. 2 |
Fig. 2 |. Intrapleural LNP-CDN reprograms immunosuppressive myeloid cells towards pro-inflammatory phenotype and remodels the immune landscape in MPe.
a, Unsupervised scRNA-seq of pooled whole MPE cells (n = 3 mice per treatment) obtained 48 h later revealed 20 colour-coded cell clusters. b, t-SNE plot of all cells colour-coded by treatment. c, t-SNE subclustering of six colour-coded subsets of intrapleural macrophages combined from all four treatments. d,e, t-SNE plot, colour-coded by treatment (d) and bar plot (e) showing subpopulations of macrophages distinctly separated between LNP-CDN or combination treatment and PBS or anti-PD-L1 alone, of which Mac_3, Mac_4 and Mac_6 were exclusive to LNP-CDN alone or in combination with anti-PD-L1. f, Macrophage subclusters (Mac_1 to Mac_6) superimposed on pseudotime trajectory. g, Macrophage superimposed on the pseudotime trajectory colour-coded by treatment. h, Heatmap of differentially expressed genes ordered based on their common kinetics through pseudotime during M2 to M1 repolarization. Cells (columns) are ordered along the M2 to M1 path. i, Representative gene expression of transcriptional factors involved in M2 to M1 repolarization plotted as a function of pseudotime. Each dot in the scatter plot represents the gene expression of a single cell. j, Selected significantly enriched terms in the GO and KEGG analyses based on the gradually upregulated (red) and downregulated (green) genes in M2 to M1 repolarization. The full list can be seen in Supplementary Table 1. k,l, Representative flow plots (k) showing intrapleural LNP-CDN-induced right shift of iNOS expression (M1-like marker) while a left shift of arginase1 (M2-like marker) on macrophages in both MPE and pleural tumours, and increased ratios of M1:M2 (l). Data are shown as the mean ± s.d. of n = 6 biologically independent mice. One-way ANOVA with Tukey’s post-hoc test. m, ELISA of various cytokines and chemokines in pleural fluid under the indicated treatment. Data are shown as the mean ± s.d. of n = 6 biologically independent mice.
Fig. 3 |
Fig. 3 |. Intrapleural LNP-CDN promotes polyfunctional CD8+ effector T cells, expands stem-like memory CD8+ T cells and generates tumour-specific cytotoxic T cells in MPe.
a, t-SNE plots of intrapleural Cd8a+ T cells colour-coded by treatment. b, t-SNE projection showing Cd8a+ T cells colour-coded by subclusters. c, Bar plots showing the frequency of Cd8a+ T cells within each cluster as a function of treatment. d, Gene expression patterns projected onto t-SNE plots of Ifng, Gzmb, Cd28, Mki67, Cd44 and Tcf7 (scale, log2 fold change). e, Heatmap showing z-scores of differentially expressed individual genes in subcluster 1–5 shown in b. a–e Data are from one experiment with n = 3 MPE samples pooled per treatment. The full differential expression gene list between subclusters is provided in Supplementary Table 4. f, Flow plots showing polyfunctional CD8+ T cells with double-positive staining for IFN-γ and Gzmb. g, Number of cells with double-positive staining quantitated. Data are shown as the mean ± s.d. of n = 6 biologically independent mice. One-way ANOVA with Tukey’s post-hoc test. h,i, Representative flow plots (h) and quantitative data (i) of the OVA peptide SIINFEKL–MHC class I molecule Kb complex on CD103+ (CD11c+, CD103+, CD11b) DCs in MPE, pleural tumours and TDLNs. Data are shown as the mean ± s.d. of n = 6 biologically independent mice. One-way ANOVA with Tukey’s post-hoc test. j,k, Representative flow plots (j) and quantitative data (k) of the SIINFEKL tetramer + CD8+ T cells in MPE under the indicated treatment. Data are shown as the mean ± s.d. of n = 6 biologically independent mice. One-way ANOVA with Tukey’s pos-hoc test.
Fig. 4 |
Fig. 4 |. LNP-CDN promotes the effector function and cytotoxic activity of NK cells.
a, t-SNE projection showing three colour-coded subclusters of Klrb1c+ NK cells in MPE. b, The t-SNE plot in a, colour-coded by treatment. c, Bar plots showing the frequency of NK cells within each cluster as a function of treatment. d, Gene expression patterns projected onto the t-SNE plots of Gzmb, Ifng, Prf1, Fcrg3, Ncr1 and Klra4 (log2 fold change). e, Heatmap showing the z-scores of differentially expressed individual genes in each subcluster from a. a–e Data are from one experiment with n = 3 MPE samples pooled per treatment. f, Flow plots showing polyfunctional NK cells with double-positive staining for IFN-γ and Gzmb. g, Number of cells with double-positive staining quantitated. Data are shown as the mean ± s.d. of n = 6 biologically independent mice. One-way ANOVA with Tukey’s post-hoc test. h,i, Representative flow plots (h) and quantitative data (i) of CD16 expression in NK cells under the indicated treatment. Data are shown as the mean ± s.d. of n = 6 biologically independent mice. One-way ANOVA with Tukey’s post-hoc test. j, Ex vivo cell killing of NK cells isolated from the MPE of LLC mice under the indicated treatment in the presence of the IgG2b isotype, anti-mouse PD-L1 or PD-L1 F(ab’)2. Data are shown as the mean ± s.d. of n = 3 biologically independent experiments. One-way ANOVA with Tukey’s post-hoc test.
Fig. 5 |
Fig. 5 |. Intrapleural LNP-CDN in combination with anti-PD-L1 Ab suppresses pleural tumour growth, reduces MPe volume and prolongs survival of MPe mice.
a, Intrapleural tumour burden monitored with BLI of mice with the indicated treatment on days 4 and 14. b, Quantitative photon counts within the chest area. Data are shown as the mean ± s.d. of n = 6 biologically independent mice. One-way ANOVA with Tukey’s post-hoc test. c, Kaplan–Meier survival assay of LLC MPE mice with the indicated treatment. n = 10 in the LNP-CDN+ PD-L1 group, n = 8 in the other groups. P = 0.012 in LNP-CDN versus PBS and P = 0.0056 in PD-L1 versus PBS, respectively; two-sided log-rank test. d–f, MPE volume (d), non-haematological cell (CD45) counts in MPE by flow cytometry (e) and pleural tumour weight (f) were measured on day 14 in the LLC-Luc MPE mice (n = 6 in the PBS and CDN groups, n = 7 in the other group). Data are shown as the mean ± s.d.; one-way ANOVA with Tukey’s post-hoc test. g–j, Kaplan–Meier survival assay of CMT167-Luc MPE mice with the indicated treatment (g), MPE volume (h), non-haematological cell (CD45) counts in MPE (i) and pleural tumour weight (j) on day 14 in the CMT167-Luc MPE mice. n = 10 in the LNP-CDN+ PD-L1 group, n = 8 in the other groups for the survival assay; P = 0.011 in LNP-CDN versus PBS; two-sided log-rank test. n = 6 per group for the MPE evaluation in h–j. Data are shown as the mean ± s.d. Two-sided log-rank test for the survival assay, one-way ANOVA with Tukey’s post-hoc test for the others. k–p, Immunohistochemical staining (k) and quantification (l) of active caspase3+ apoptotic cells, immunohistochemical staining (m) and quantification (n) of CD31+ cells and immunofluorescence staining (o) and quantification (p) of CD31+ and NG2+ cells in pleural tumours of n = 3 biologically independent mice with LLC-Luc MPE under the indicated treatment. Data are shown as the mean ± s.d. Scale bars, 20 μm (k) or 50 μm (m and o). One-way ANOVA with Tukey’s post-hoc test.
Fig. 6 |
Fig. 6 |. LNP-CDN reprograms tumour-associated macrophages, activates cytotoxic effector NK cells and CD8+ T cells and enhances the cytotoxic activity of NK cells in the MPe of patients with NSCLC.
a, Schemes of treating patients’ MPE with LNP-CDN. b, Cellular compositions of MPE freshly obtained from patients with NSCLC (n = 5) determined by flow cytometry. Each spot represents an individual MPE sample. Tumor and CD45+ cells were the percentage of live cells; other immune cells were the percentage of CD45+ cells. Data are shown as the mean ± s.d. c, Pairwise comparison of gene expression profiles showing LNP-CDN induced M1-associated genes while suppressing M2-associated genes in macrophages. The heatmap data are shown as the mean log2 fold change normalized to normal human PBMCs. d, Specific uptake of DiR-LNP by macrophages and DCs in patients’ MPE (n = 5) by flow cytometry. The percentage of DiR+ cells in their own population are presented. Data are shown as the mean ± s.d. e, Immunofluorescence imaging of the uptake of DiR-LNP (red) by macrophages (green) isolated from representative patients’ MPE. Scale bars, 20 μm. Representative images of three independent experiments. f, Flow plots showing increased ratios of M1 (CD80)/M2 (CD206) after LNP-CDN treatment of individual MPE samples (n = 5). g,h, LNP-CDN activated NK cells in patients’ MPE (n = 5). Sorted NK cells from patient MPEs were cocultured with supernatant from LNP-CDN-treated macrophages for 18 h; the cell surface expression of NKG2D (g) and intracellular expression of IFN-γ (h) were determined by flow cytometry. i, LNP-CDN activated CD8+ T cells in patients’ MPE (n = 5). j, NK cell cytotoxicity and PD-L1 Ab-mediated ADCC enhanced by LNP-CDN. Data are shown as the mean ± s.d. of n = 5 patient samples. One-way ANOVA with Tukey’s post-hoc test. k, Heterogeneous expression of PD-L1 on tumour cells observed among the samples of five individual patients. Data are shown as the mean ± s.d. of n = 3 biologically independent experiments.

References

    1. Zamboni MM, da Silva CT Jr., Baretta R, Cunha ET & Cardoso GP Important prognostic factors for survival in patients with malignant pleural effusion. BMC Pulm. Med. 15, 29 (2015). - PMC - PubMed
    1. Murthy P et al. Making cold malignant pleural effusions hot: driving novel immunotherapies. Oncoimmunology 8, e1554969 (2019). - PMC - PubMed
    1. Morgensztern D, Waqar S, Subramanian J, Trinkaus K & Govindan R Prognostic impact of malignant pleural effusion at presentation in patients with metastatic non-small-cell lung cancer. J. Thorac. Oncol. 7, 1485–1489 (2012). - PubMed
    1. American Thoracic Society. Management of malignant pleural effusions. Am. J. Respir. Crit. Care Med. 162, 1987–2001 (2000). - PubMed
    1. Stathopoulos GT & Kalomenidis I Malignant pleural effusion: tumor-host interactions unleashed. Am. J. Respir. Crit. Care Med. 186, 487–492 (2012). - PMC - PubMed

Publication types

MeSH terms