. 2022 Jan;25(1):26-38.
doi: 10.1038/s41593-021-00975-6. Epub 2021 Dec 16.

TREM2 interacts with TDP-43 and mediates microglial neuroprotection against TDP-43-related neurodegeneration

Affiliations

TREM2 interacts with TDP-43 and mediates microglial neuroprotection against TDP-43-related neurodegeneration

Manling Xie et al. Nat Neurosci. 2022 Jan.

Abstract

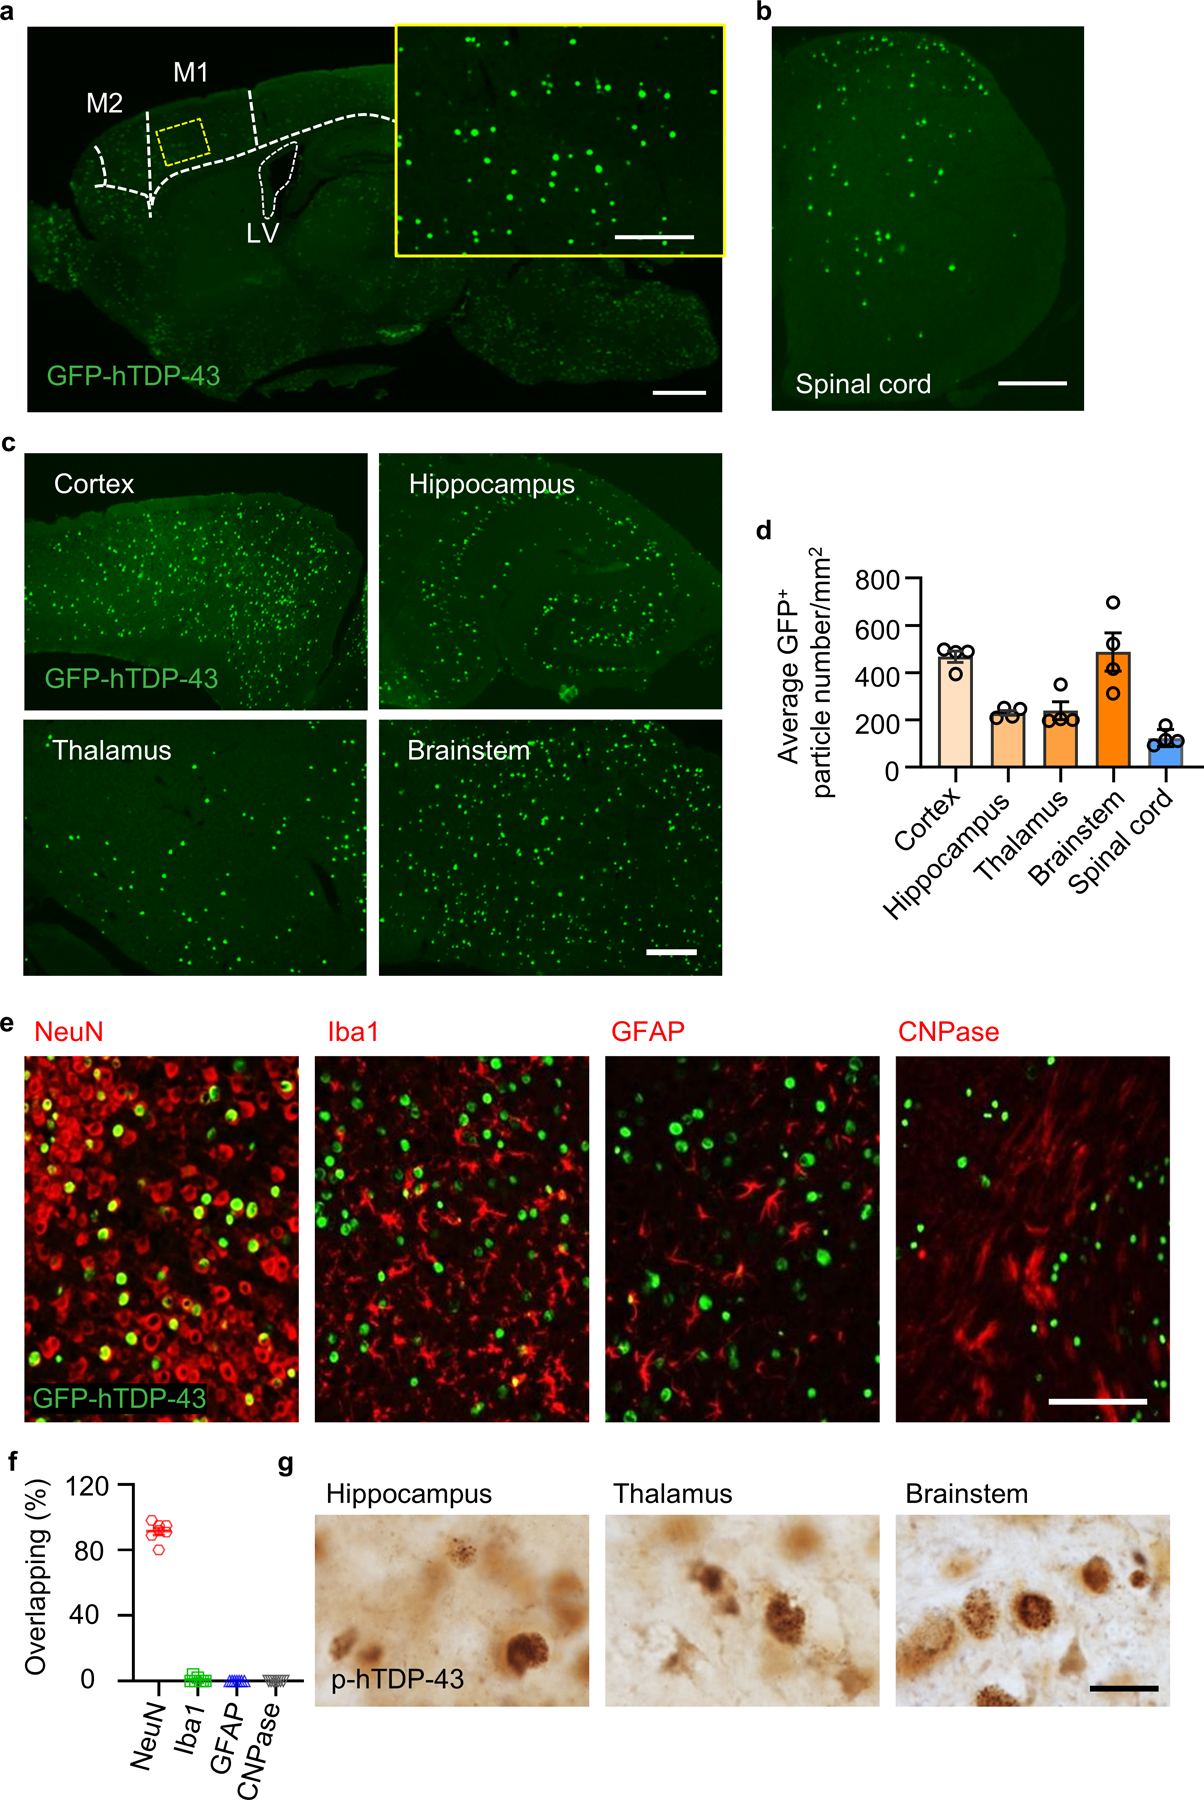
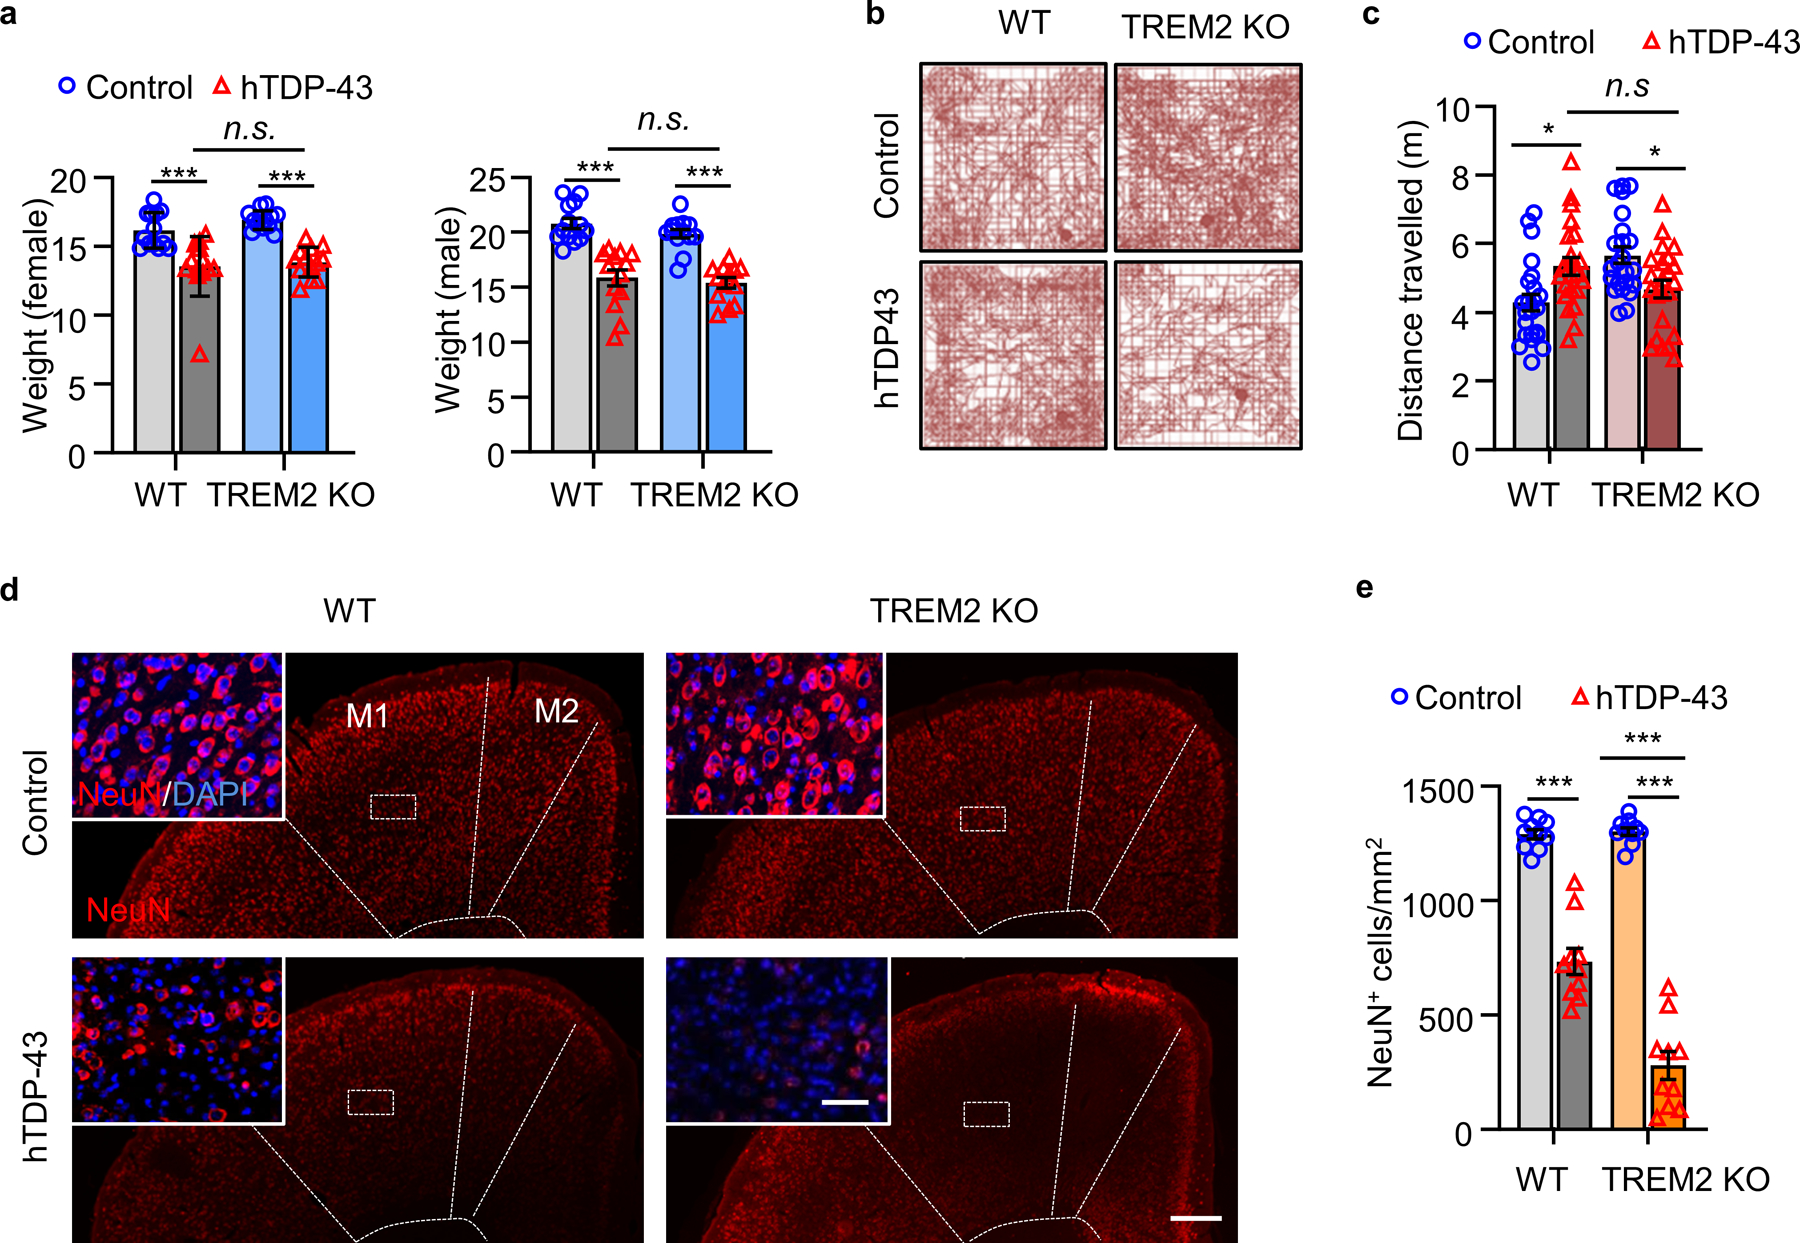
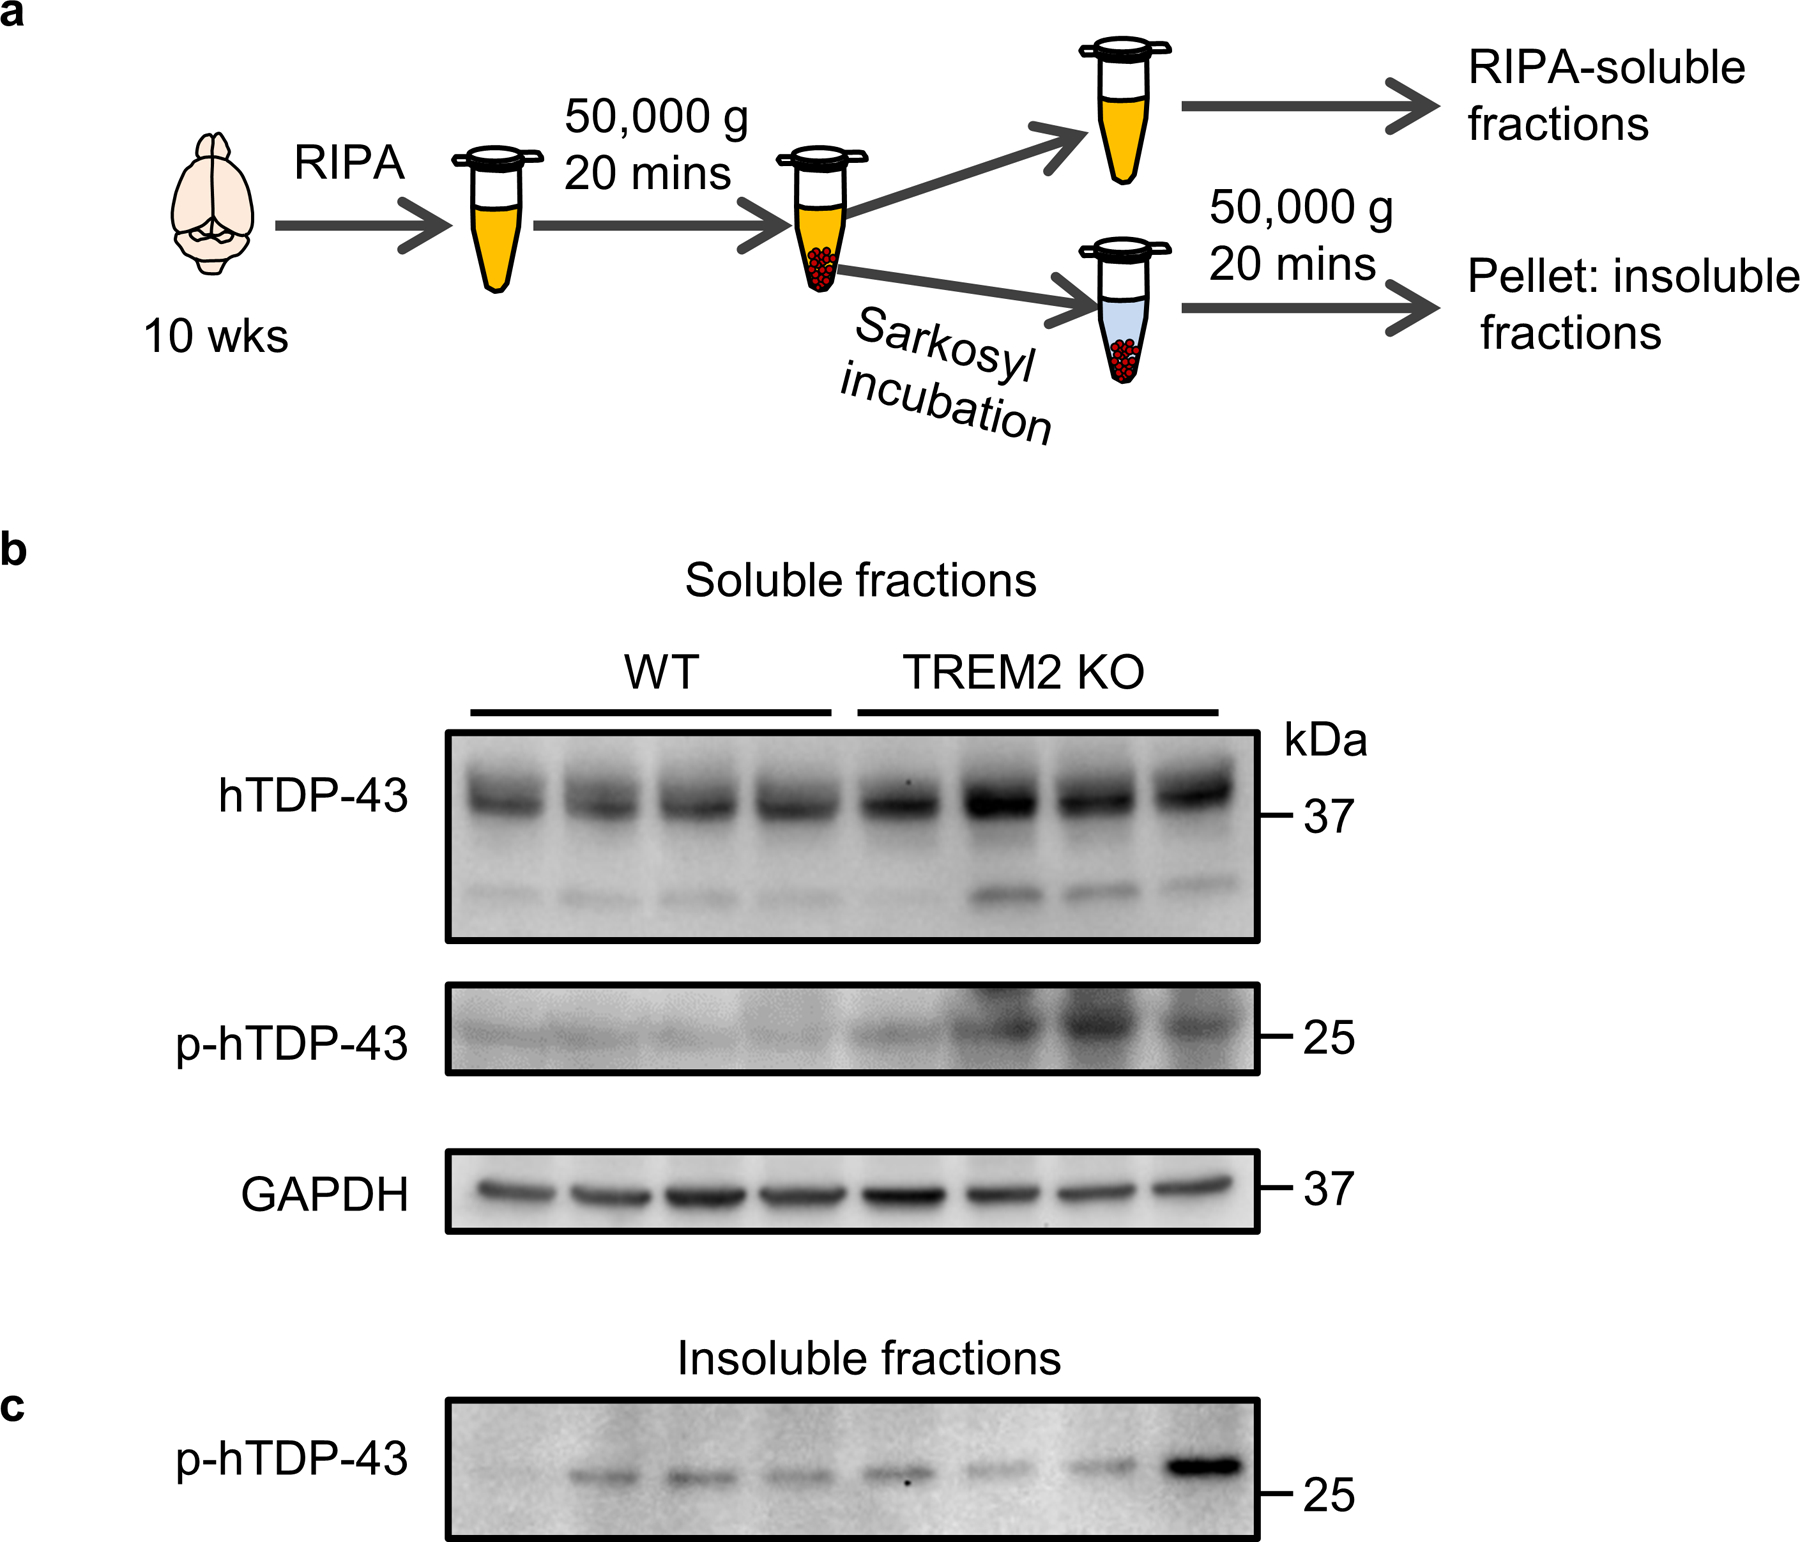
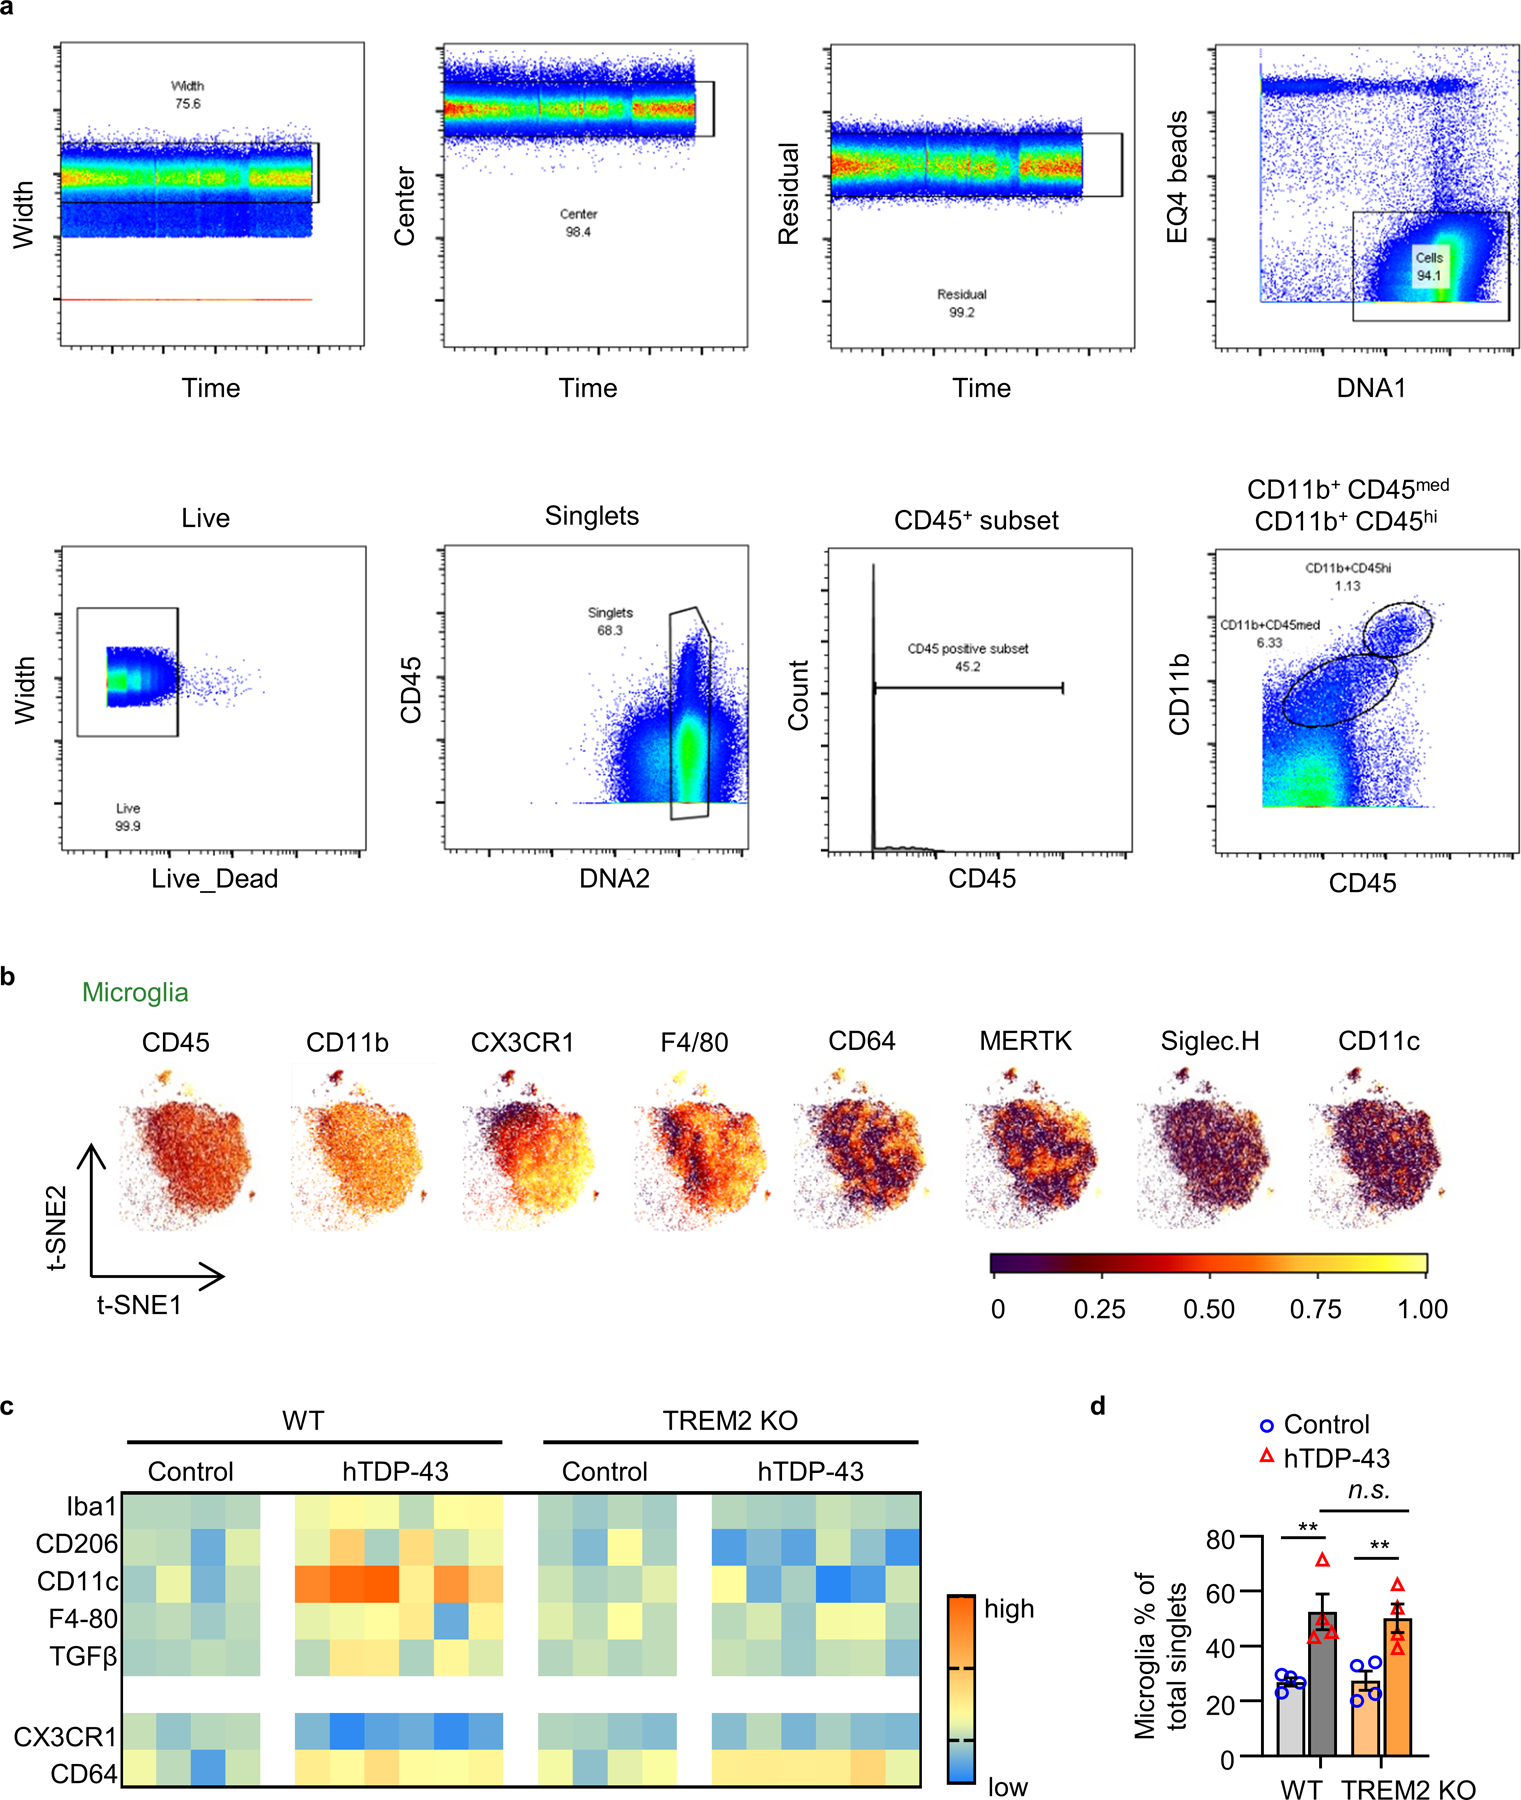
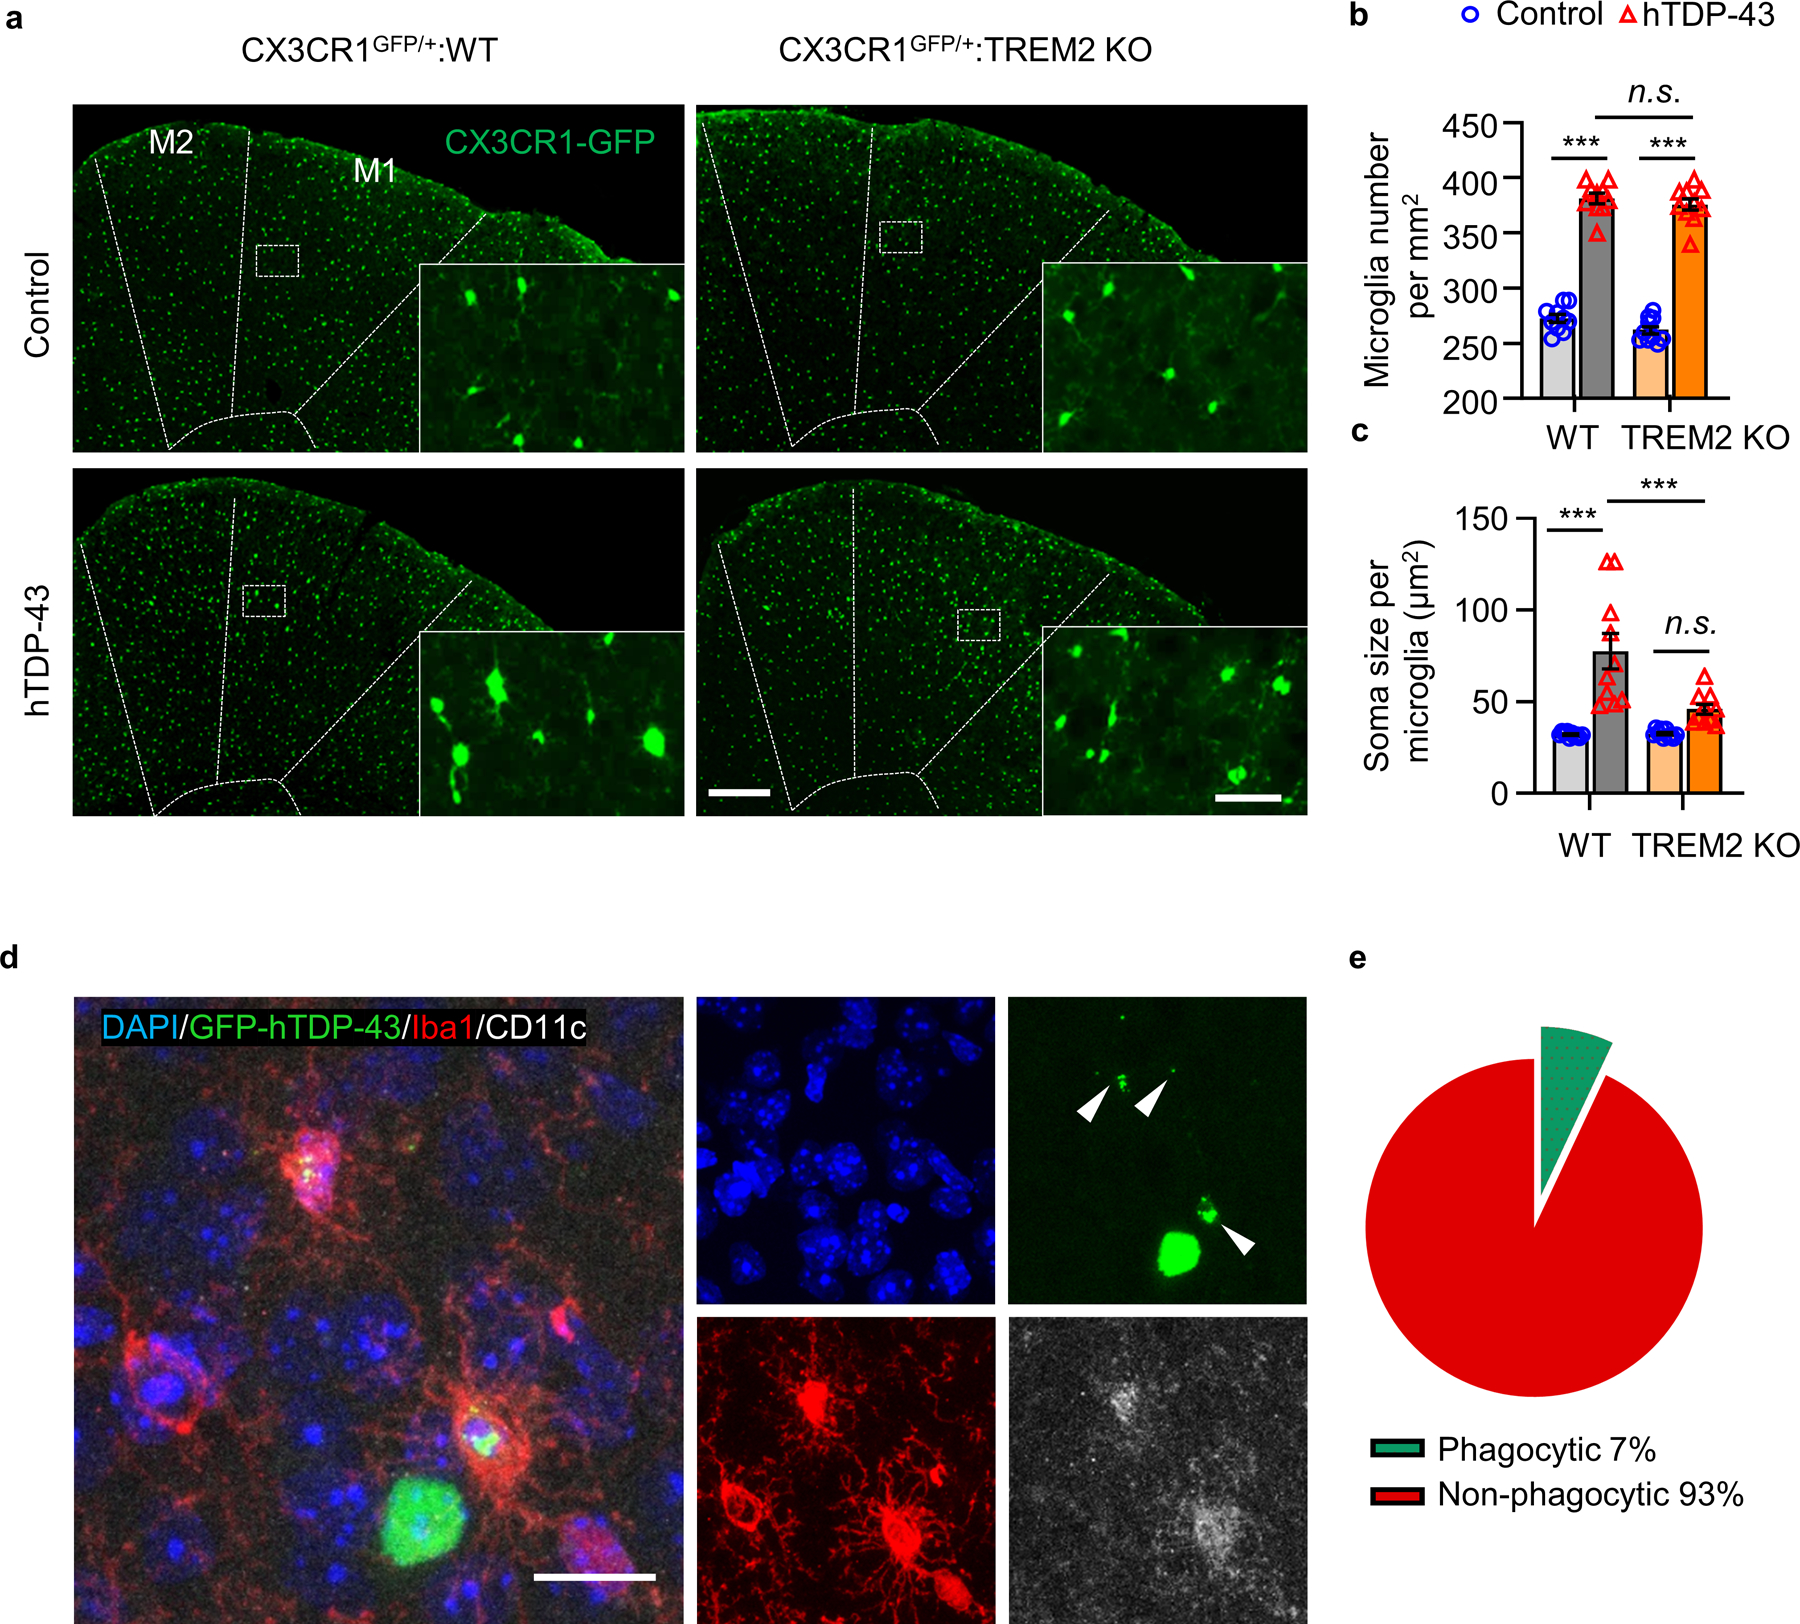
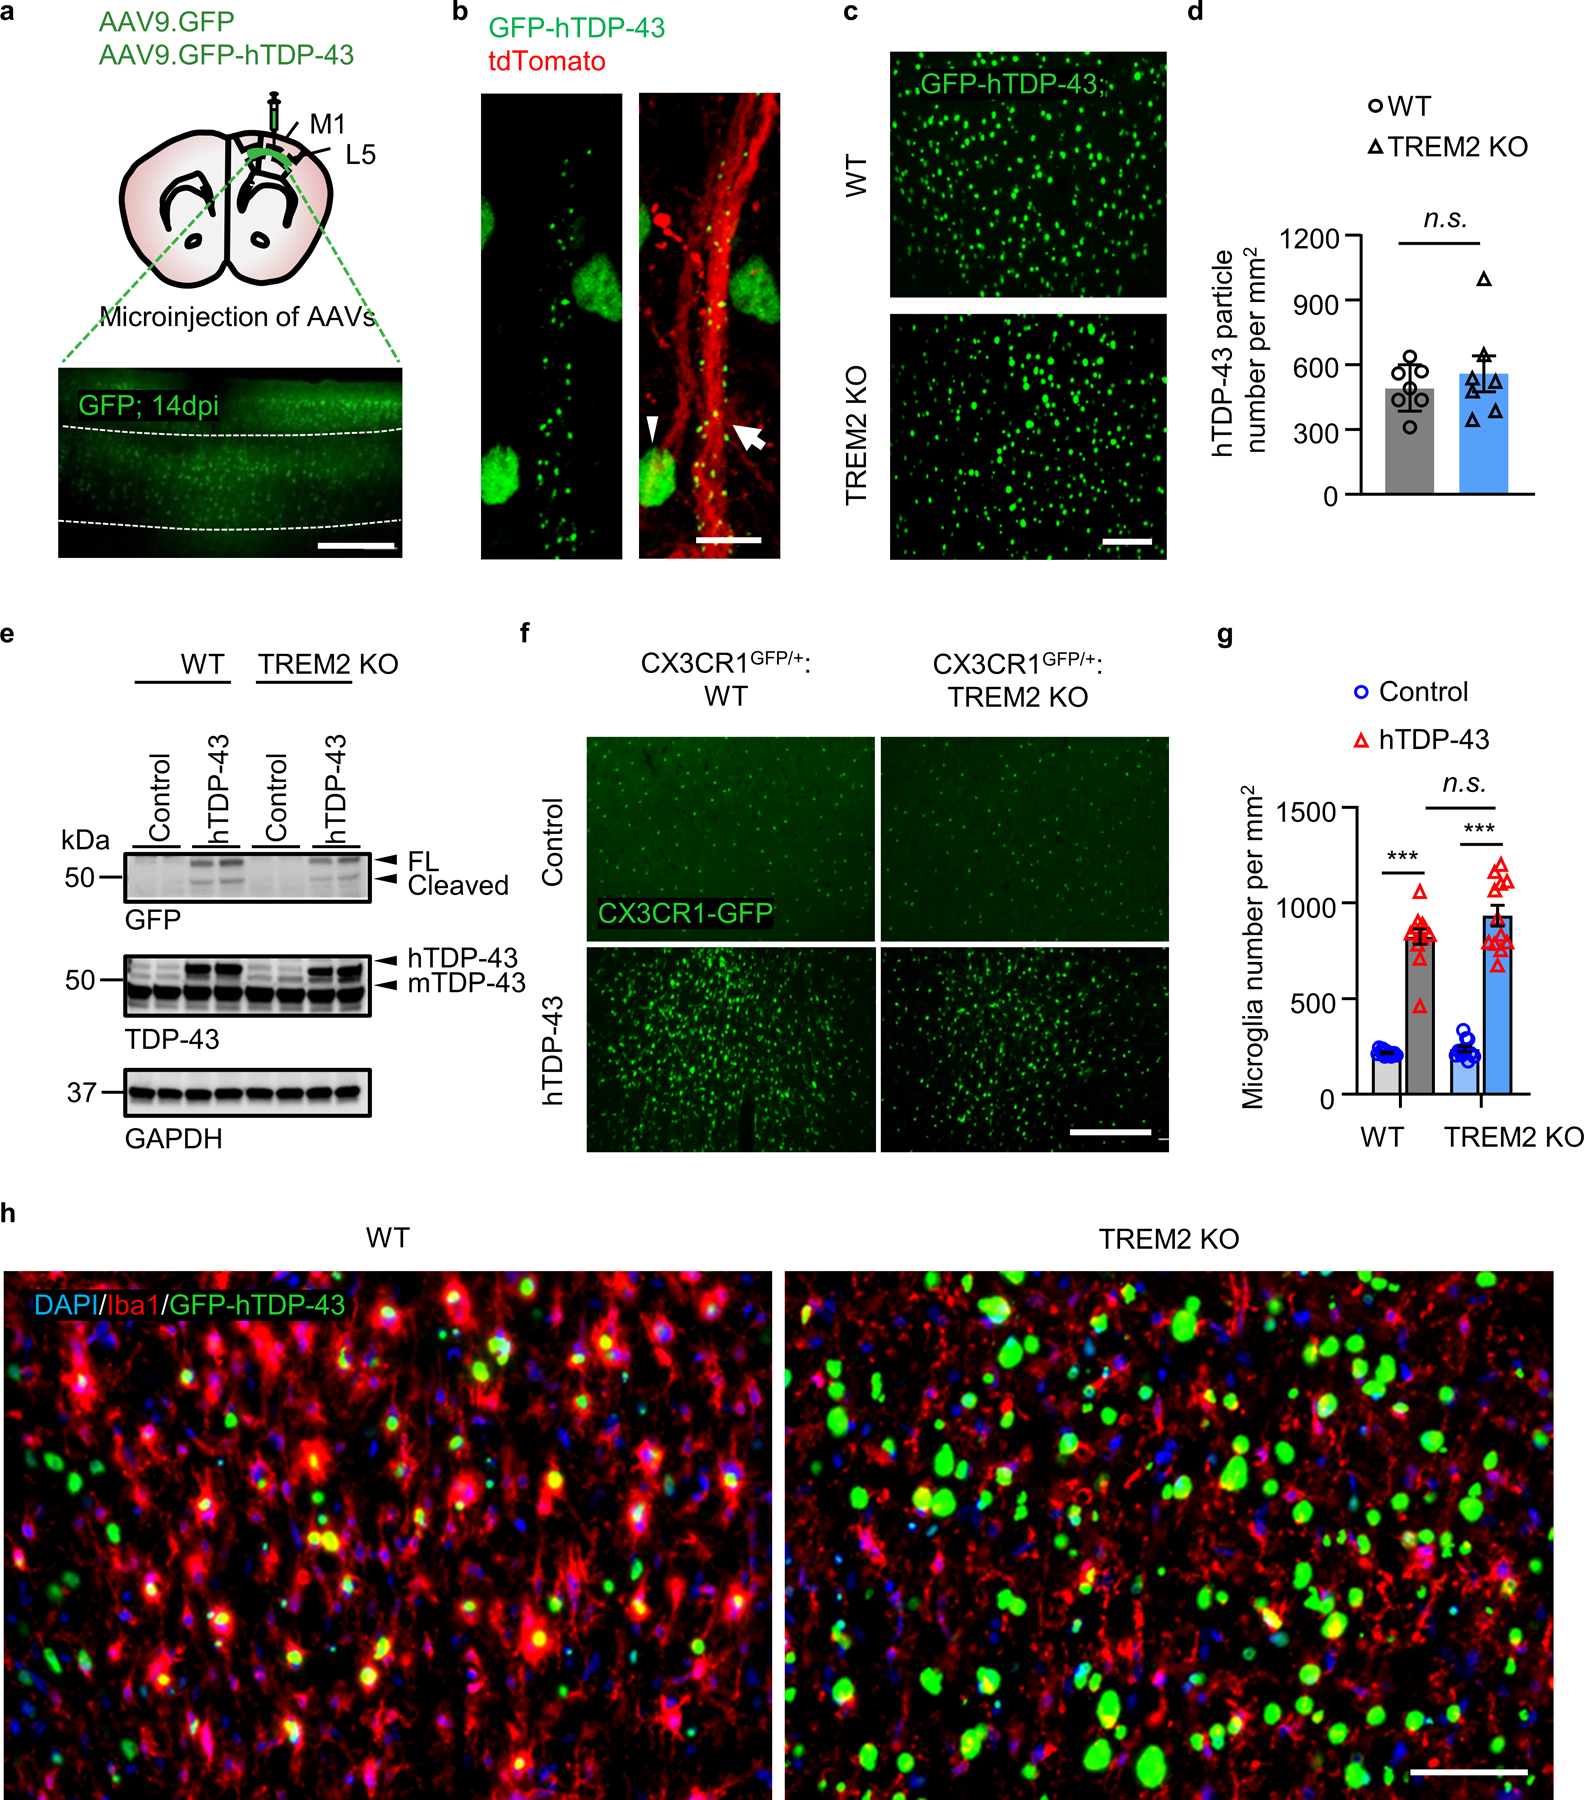
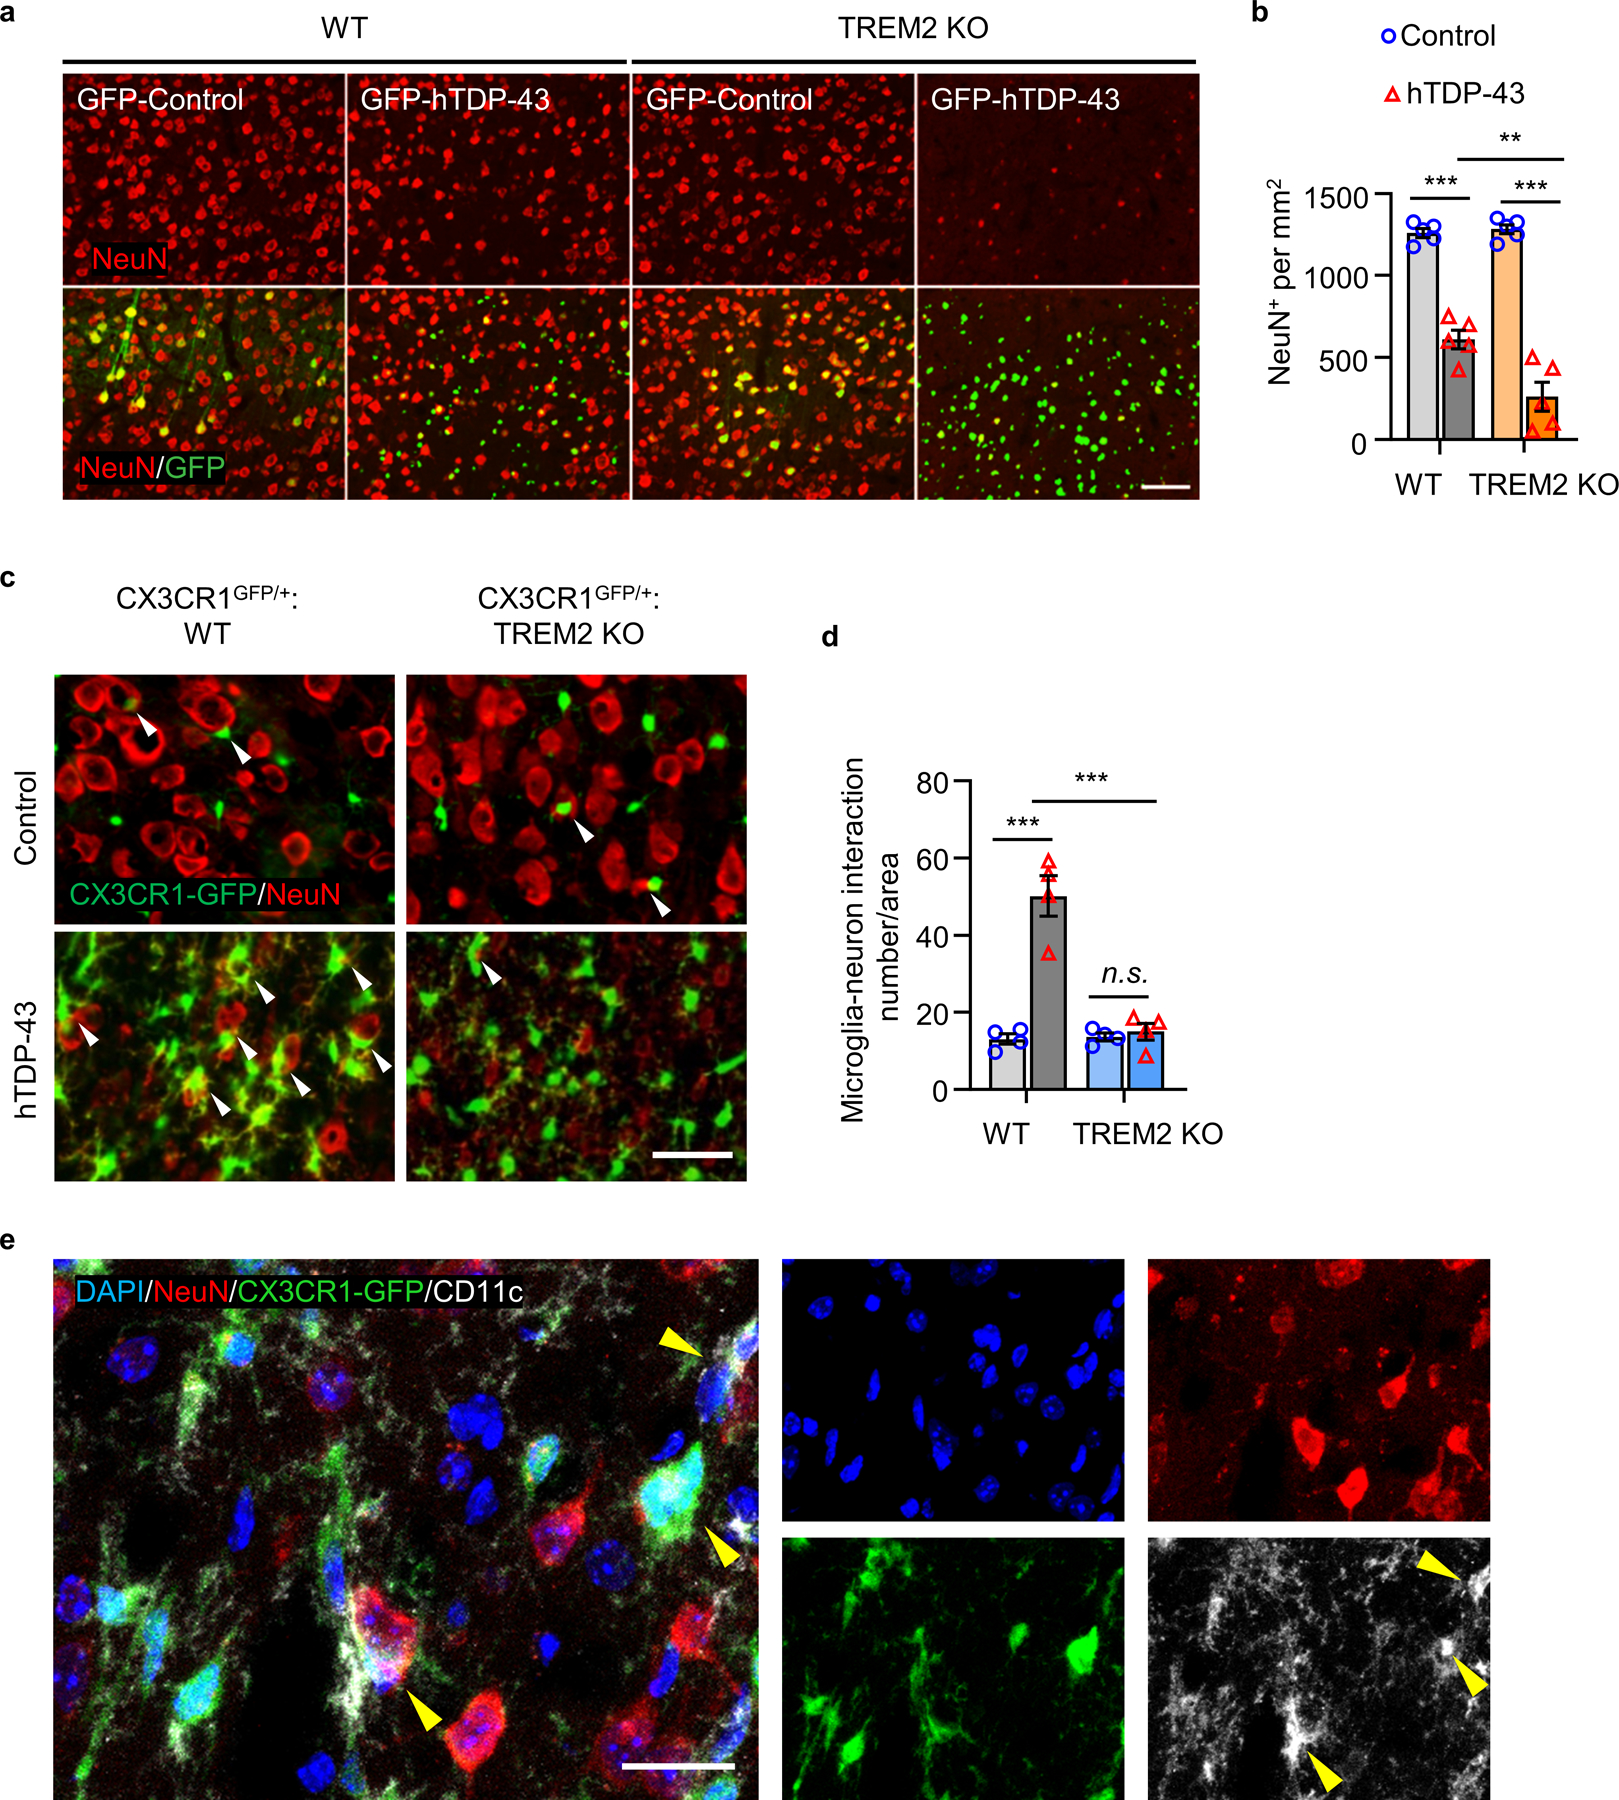
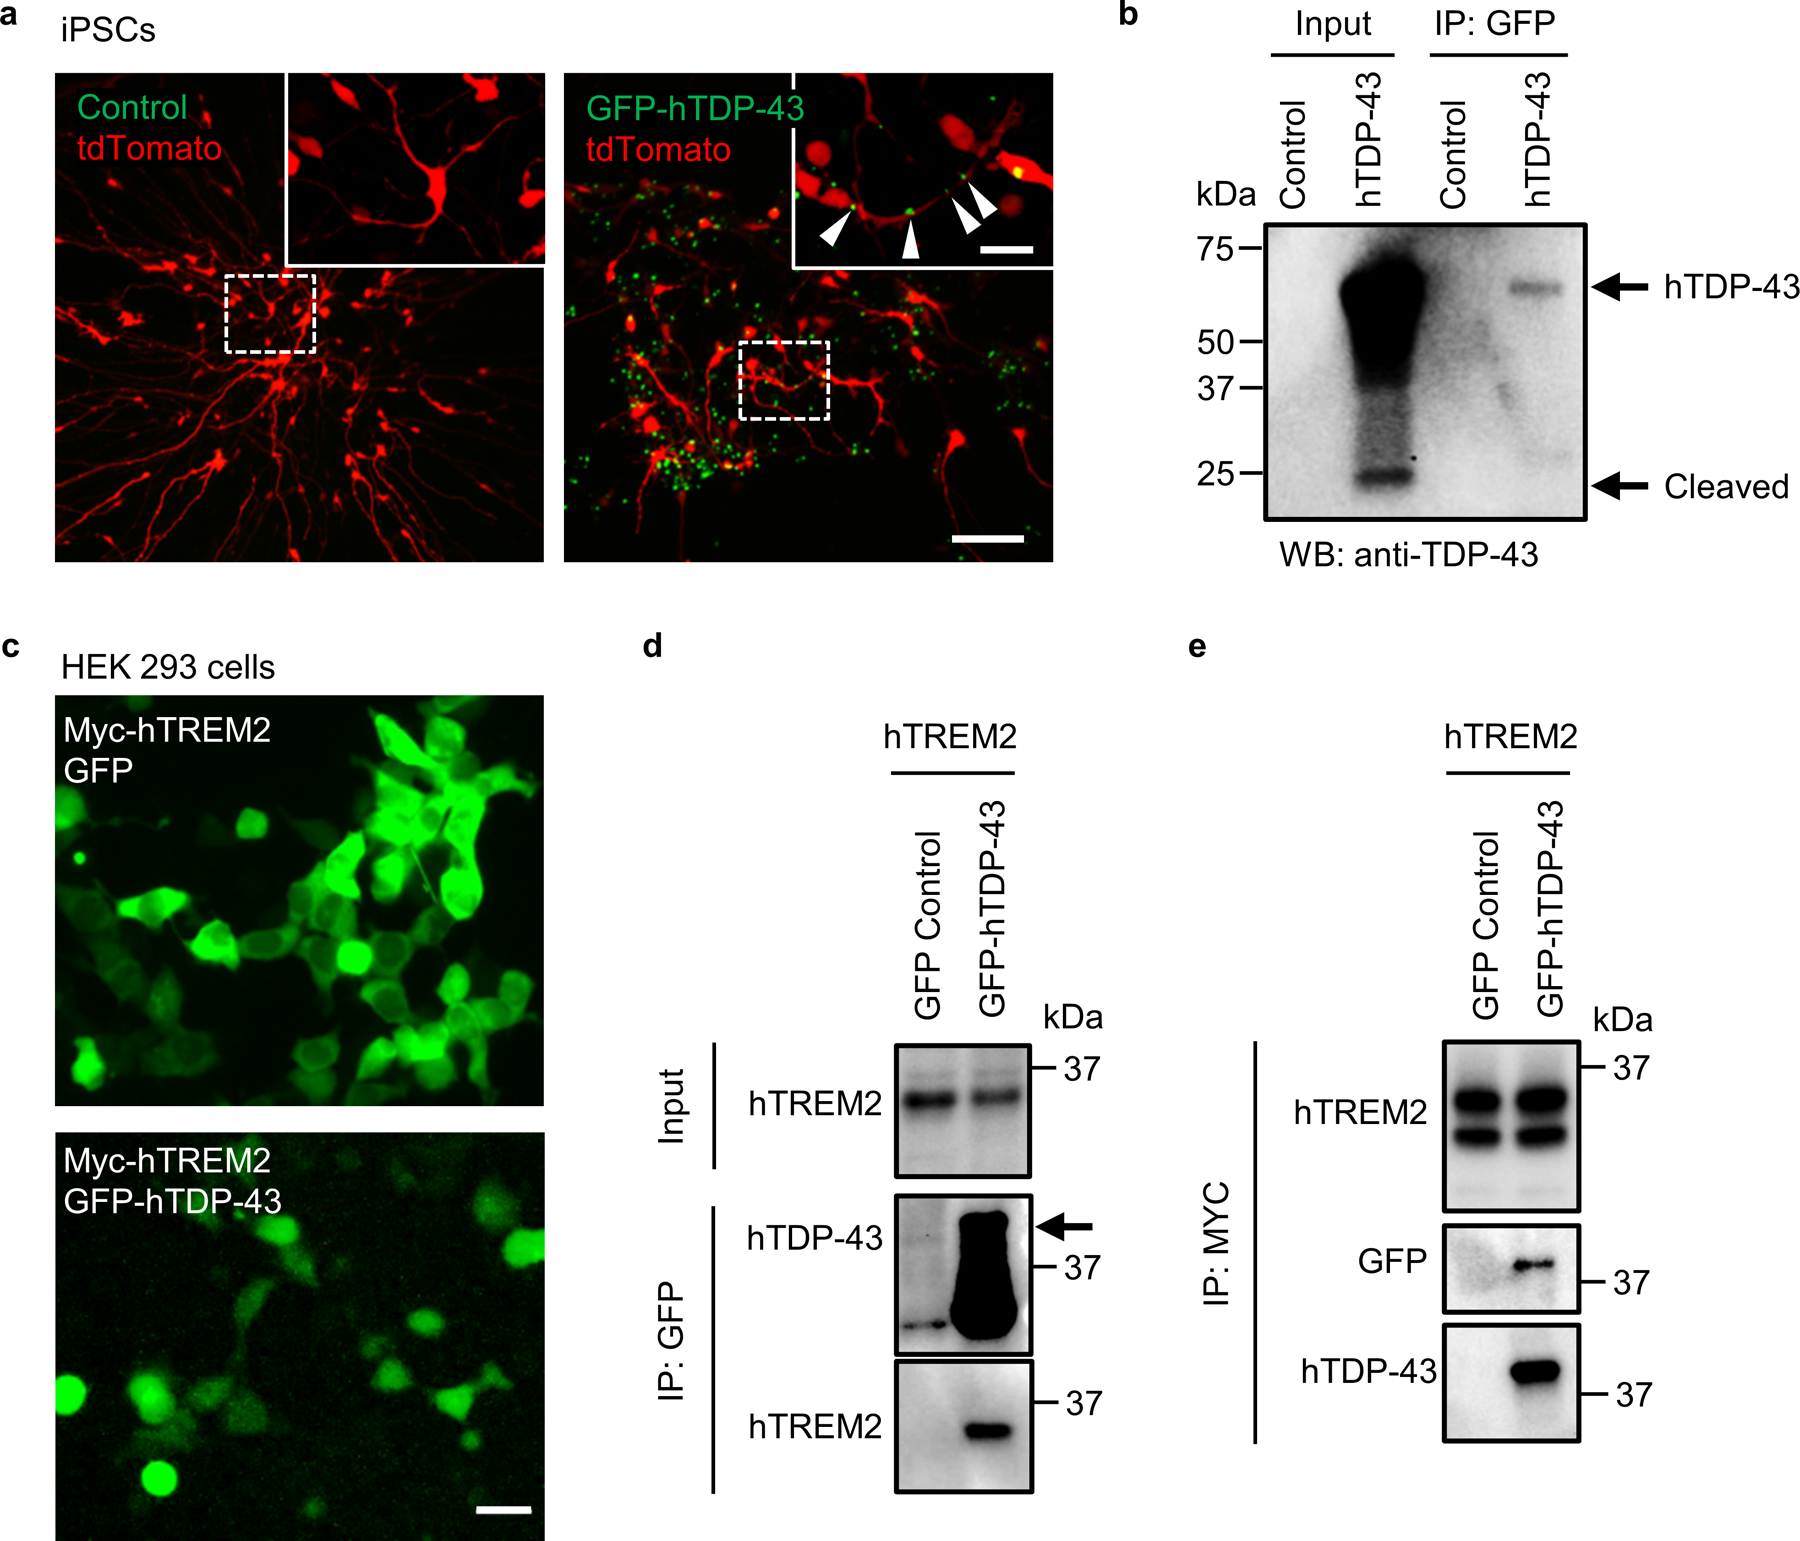
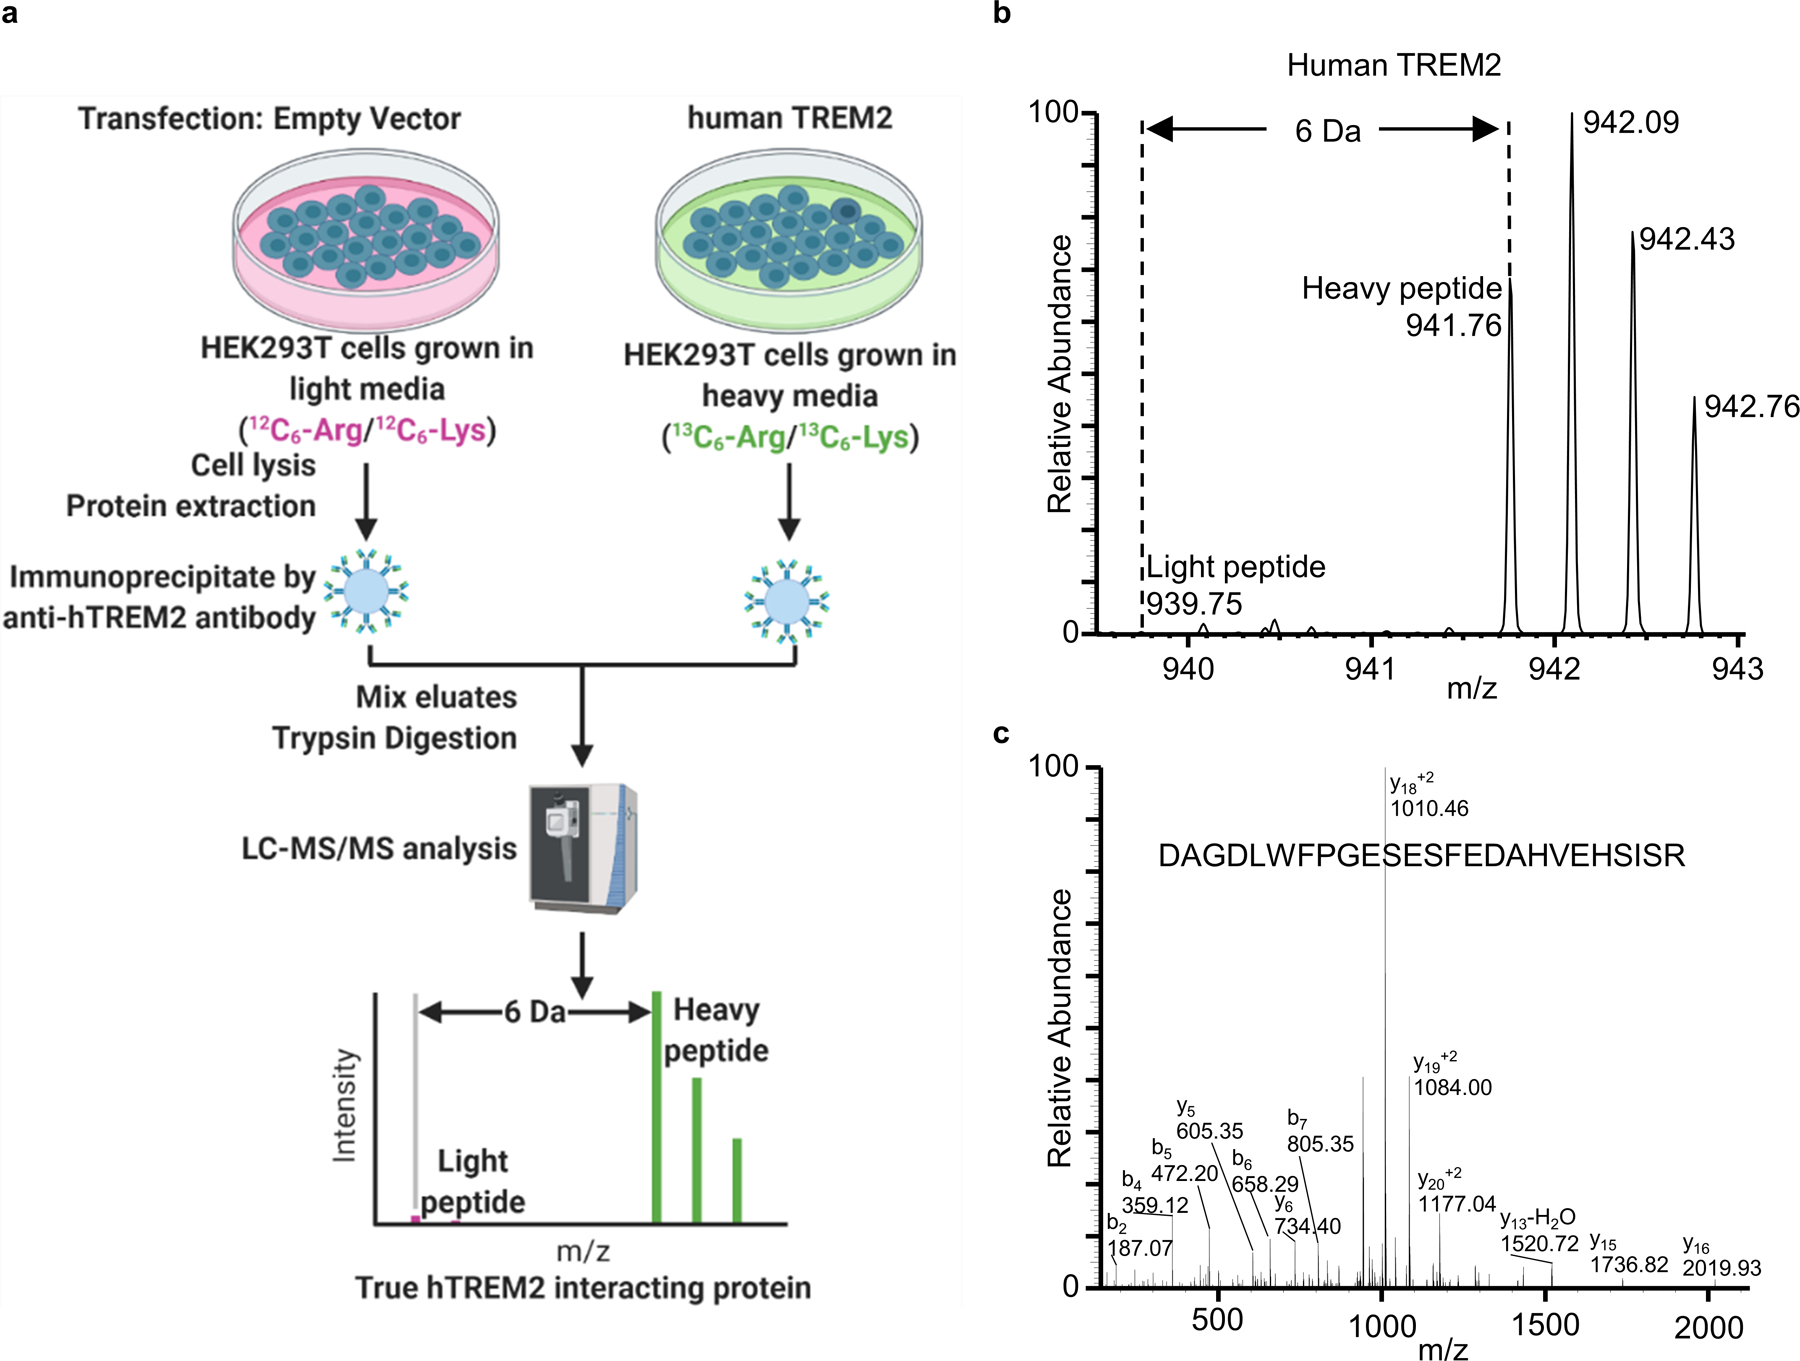
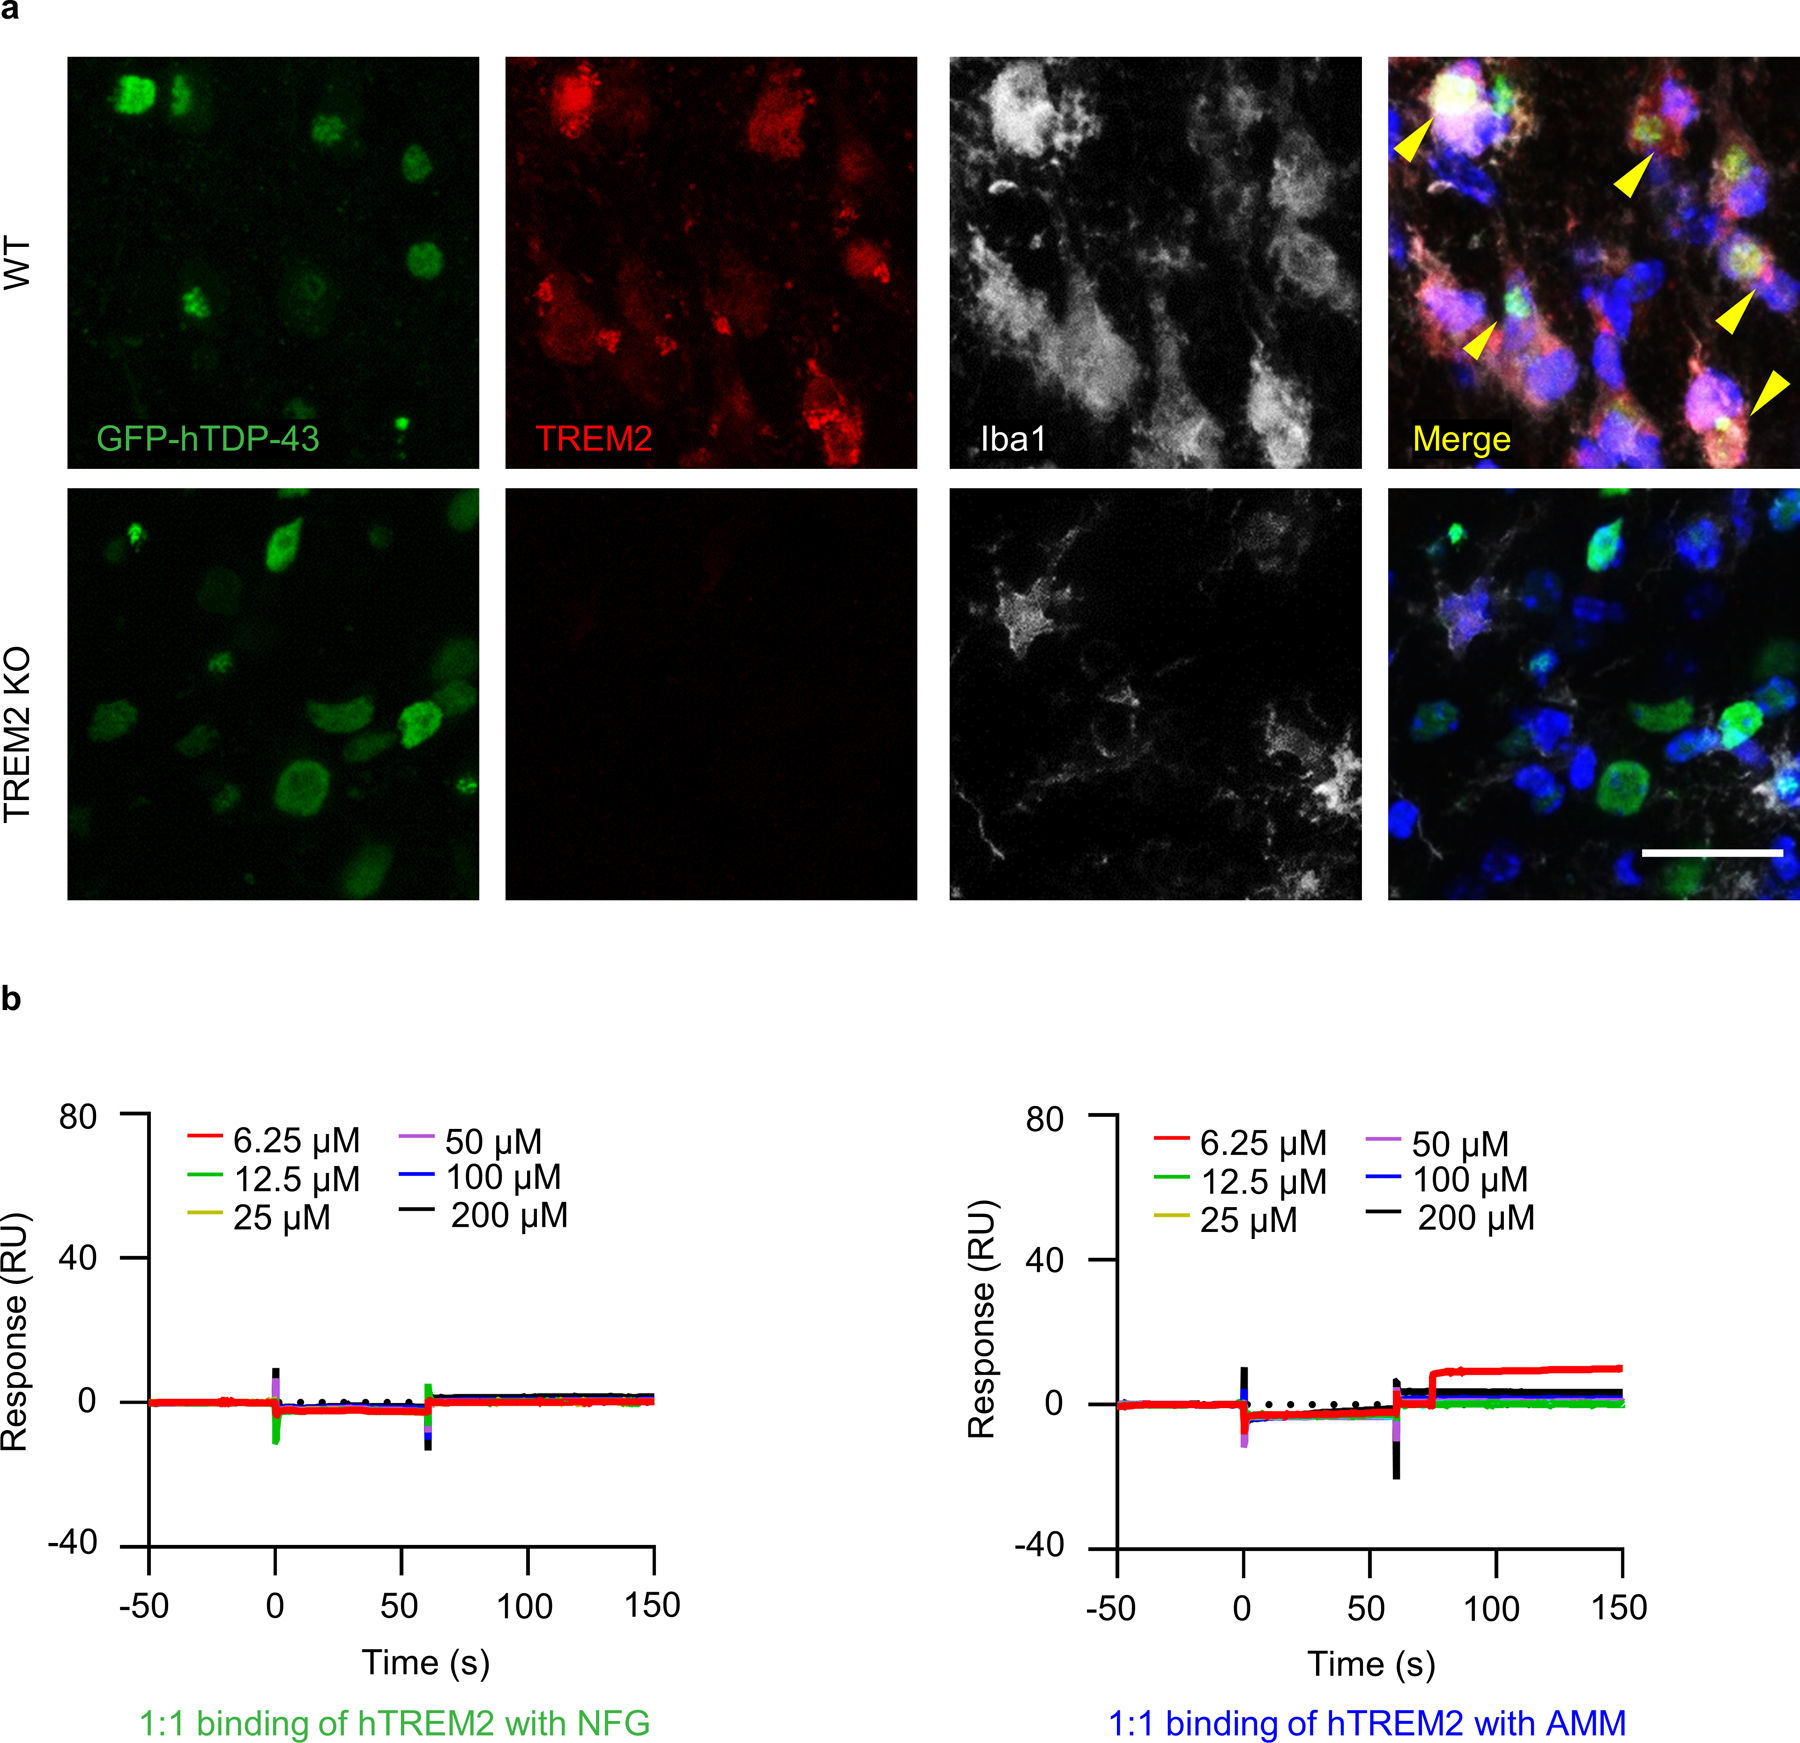
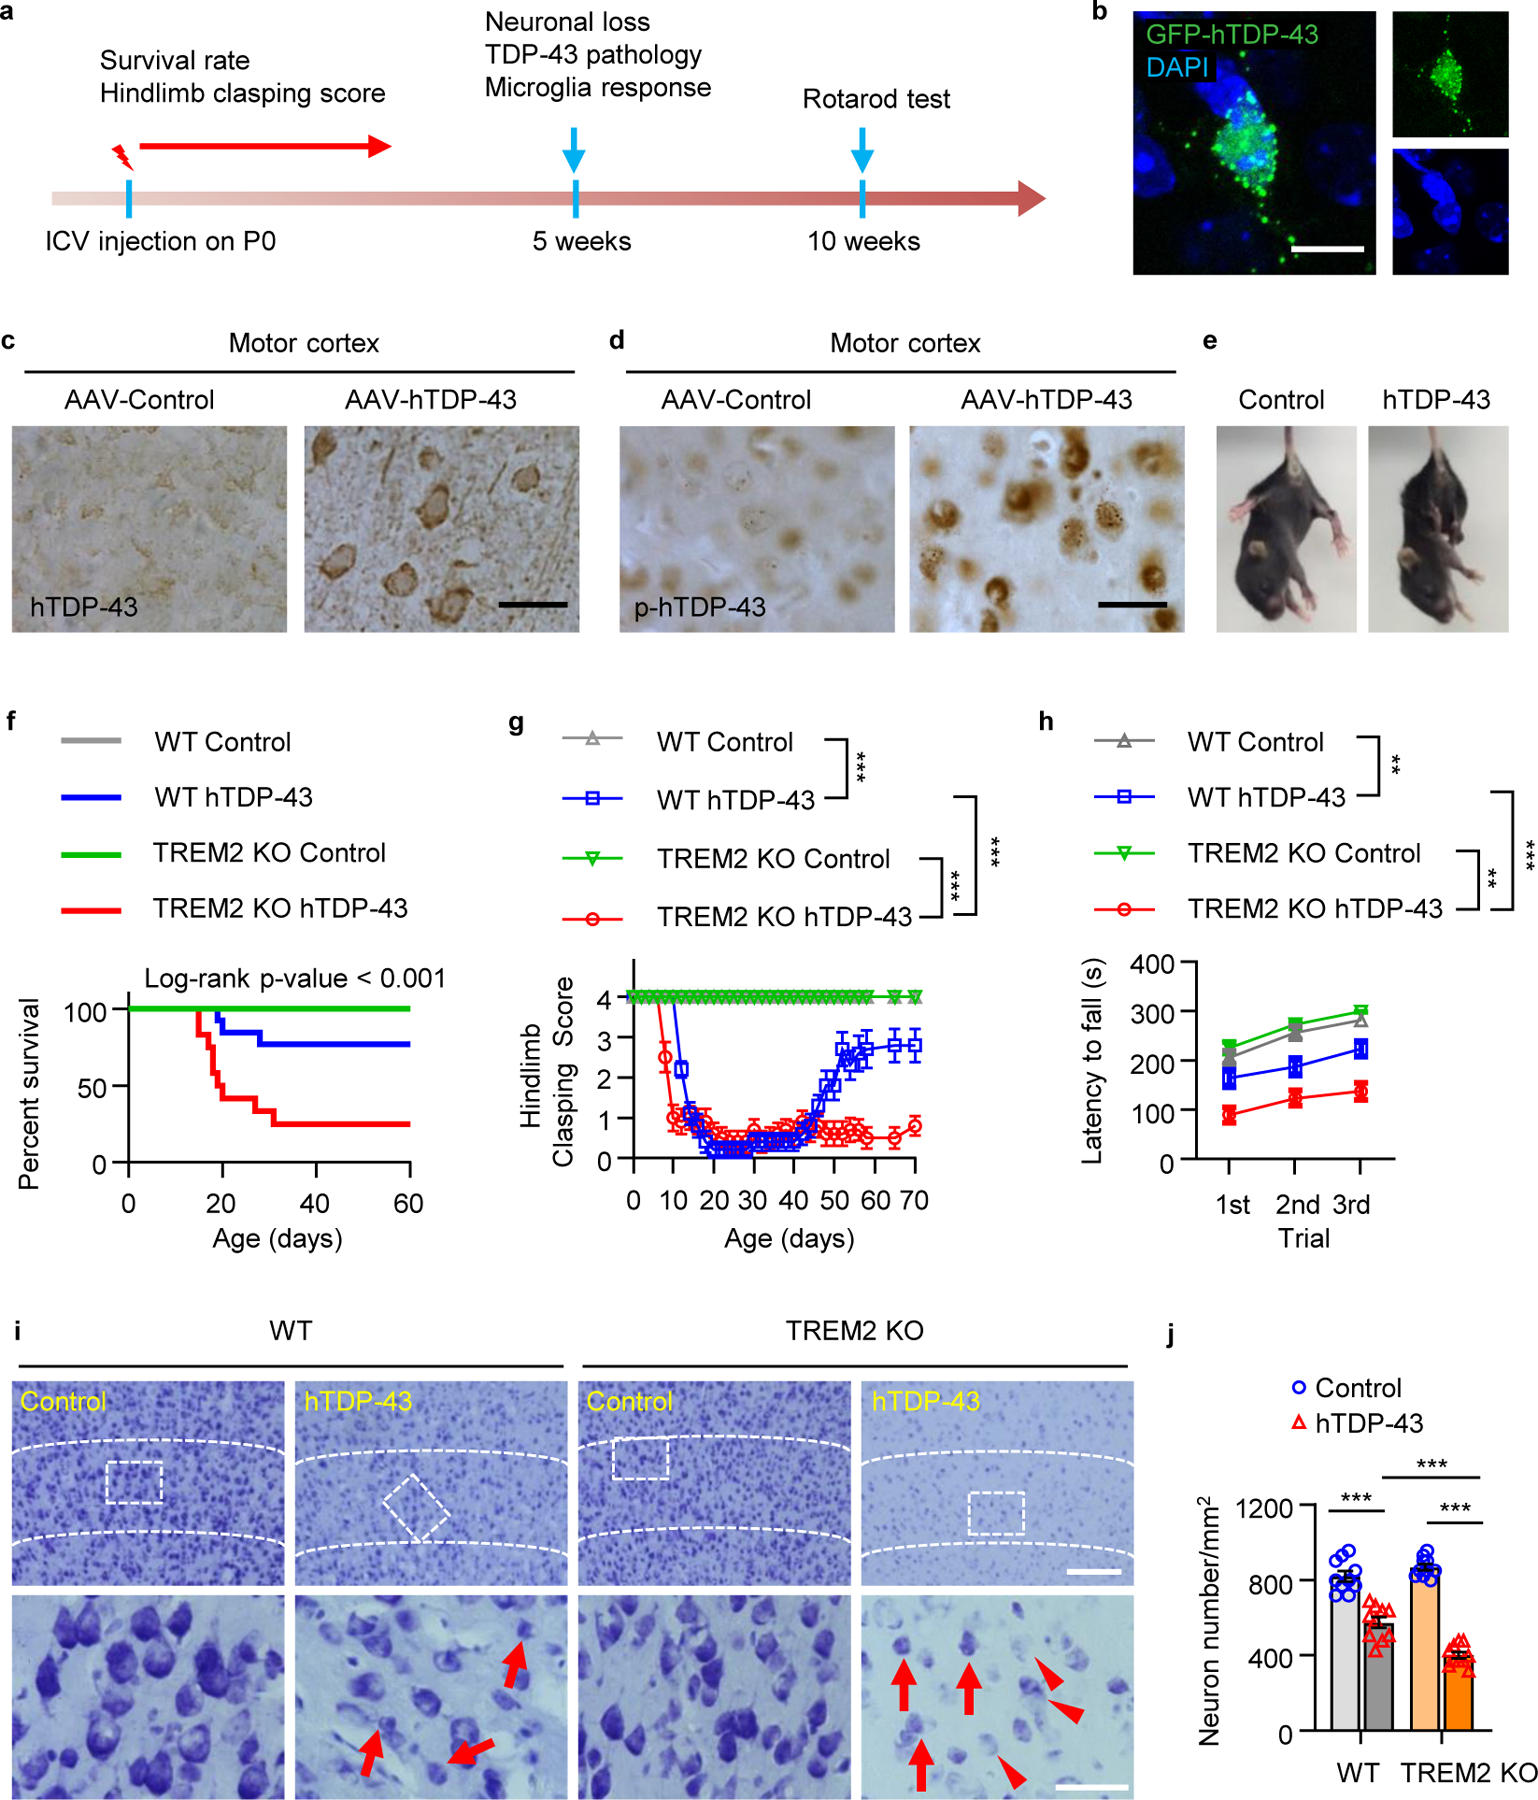
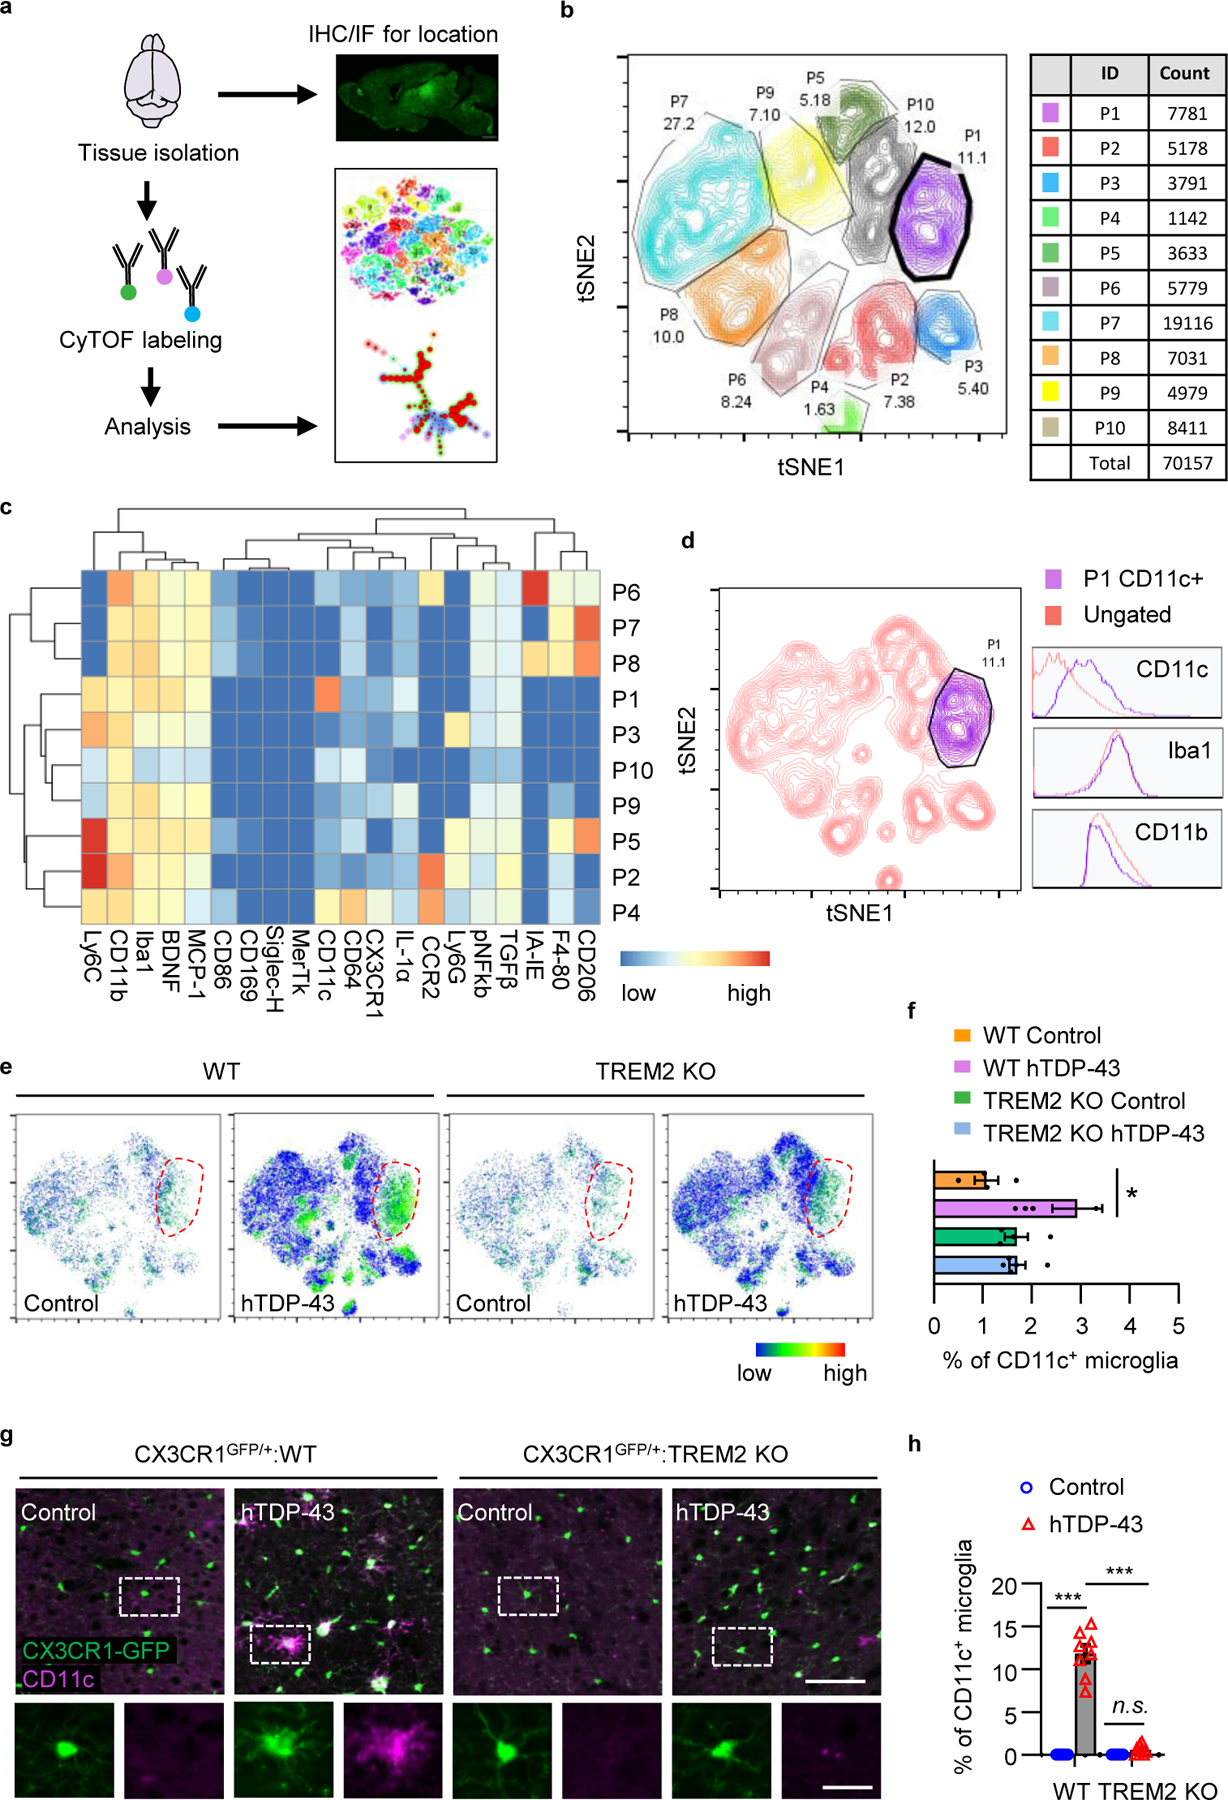
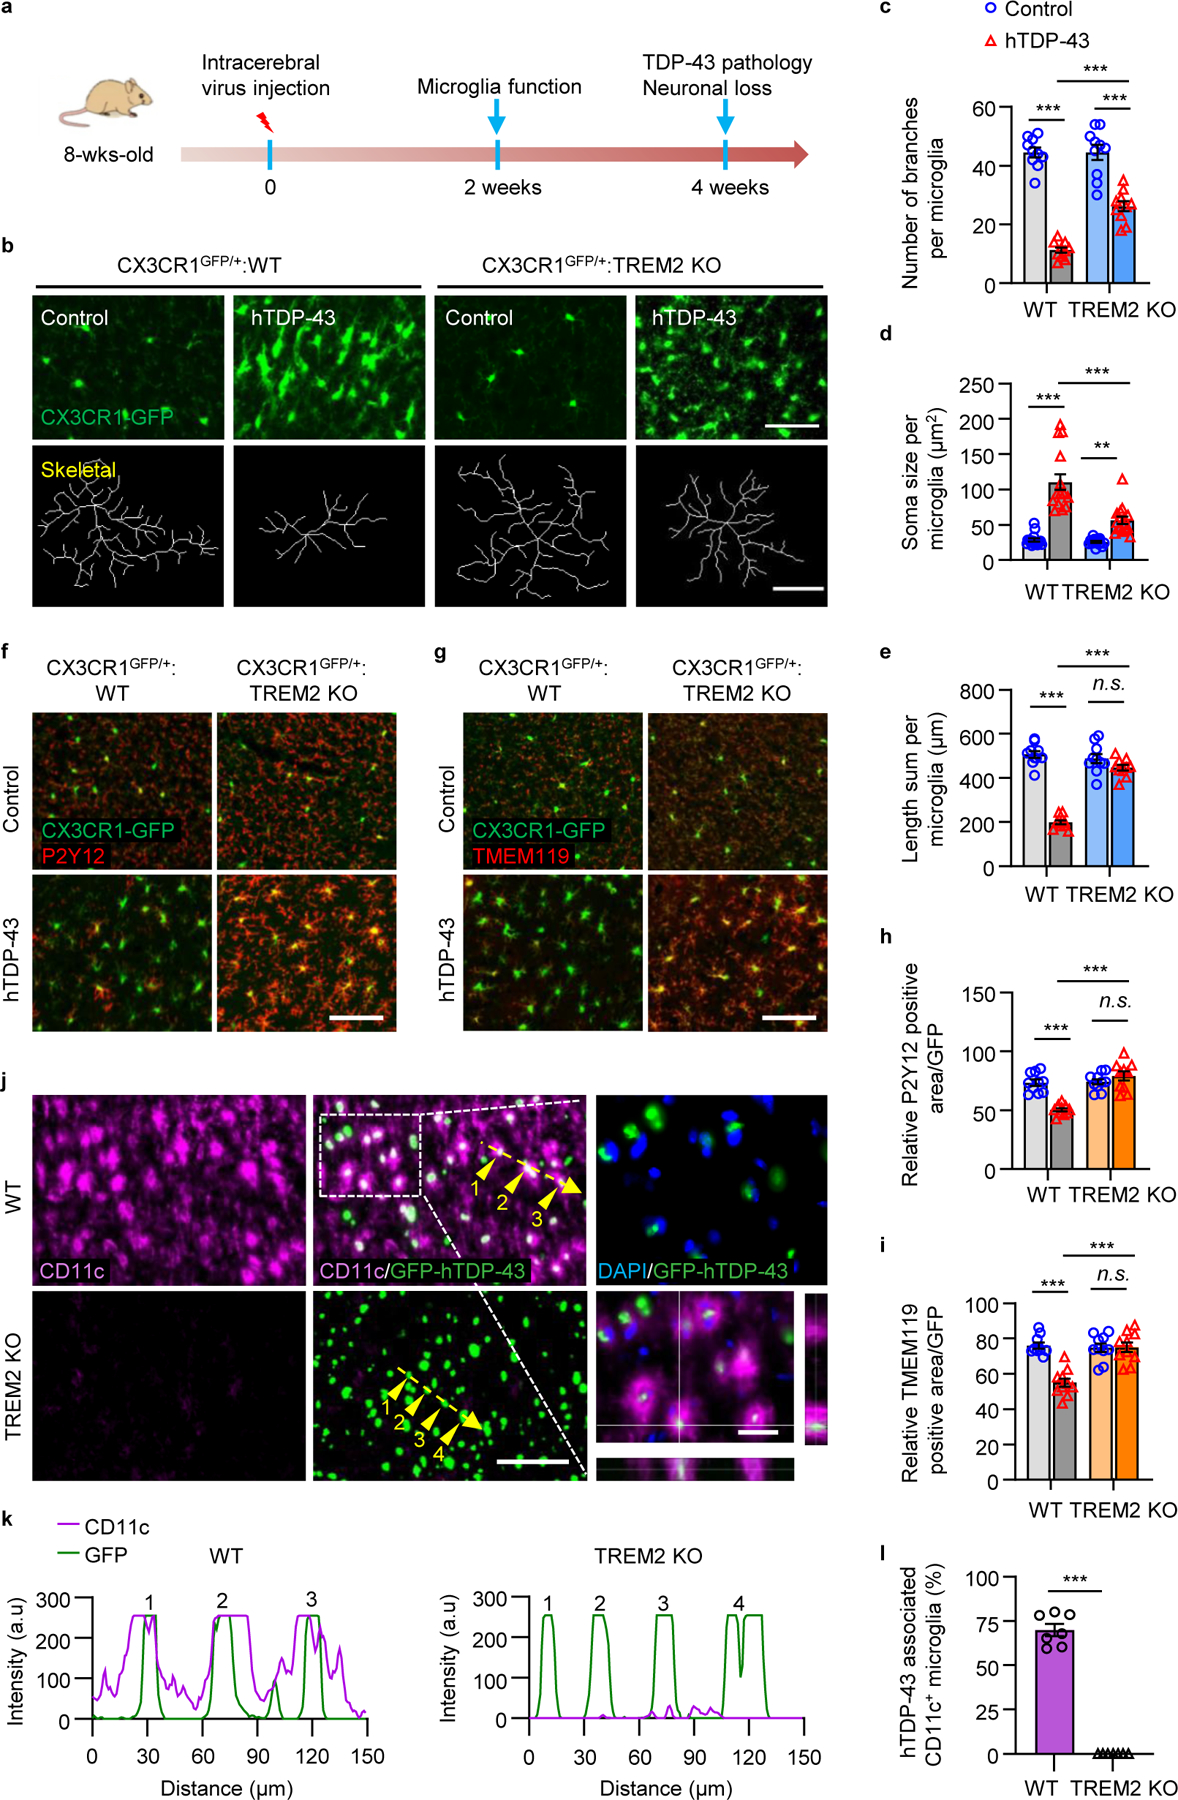
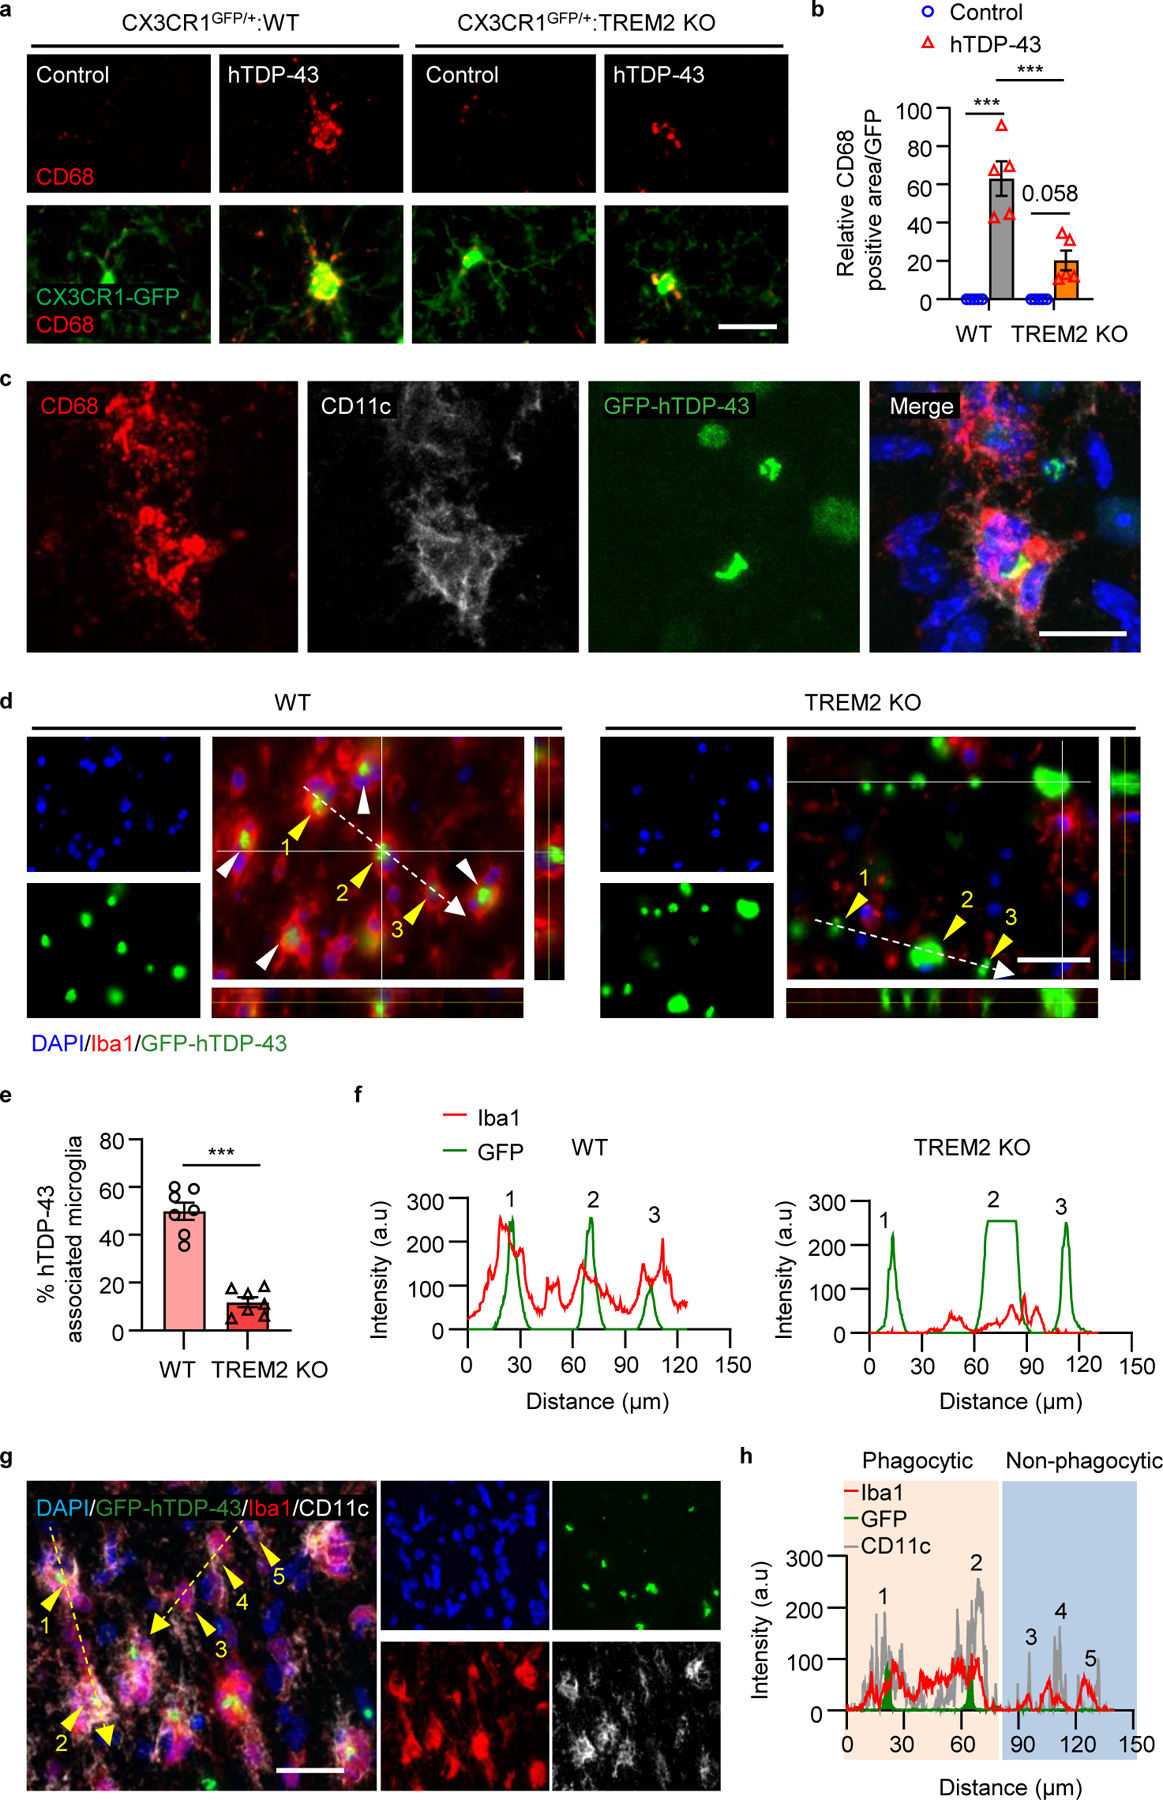
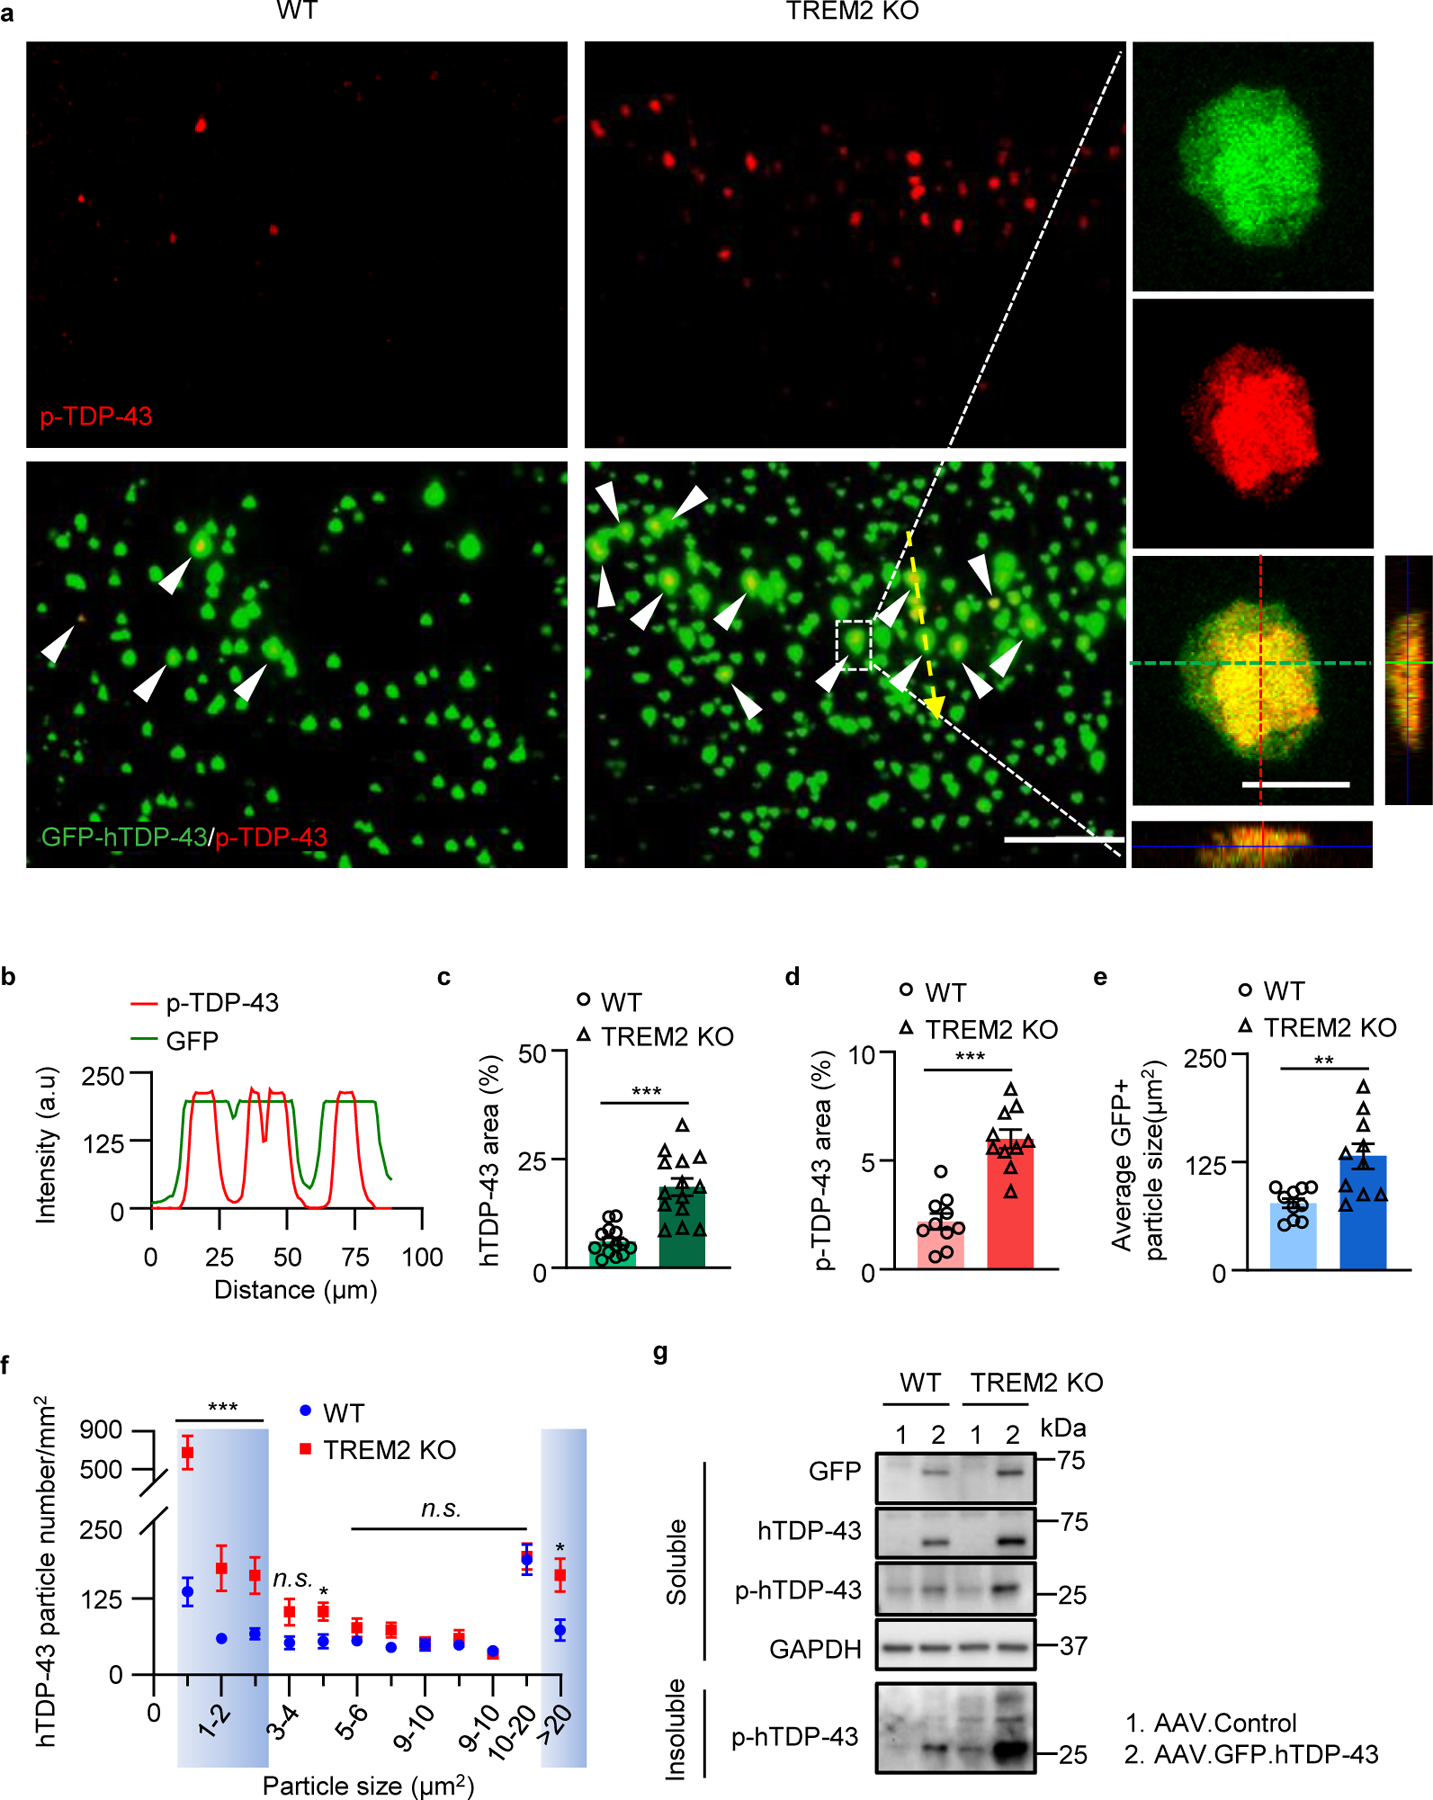
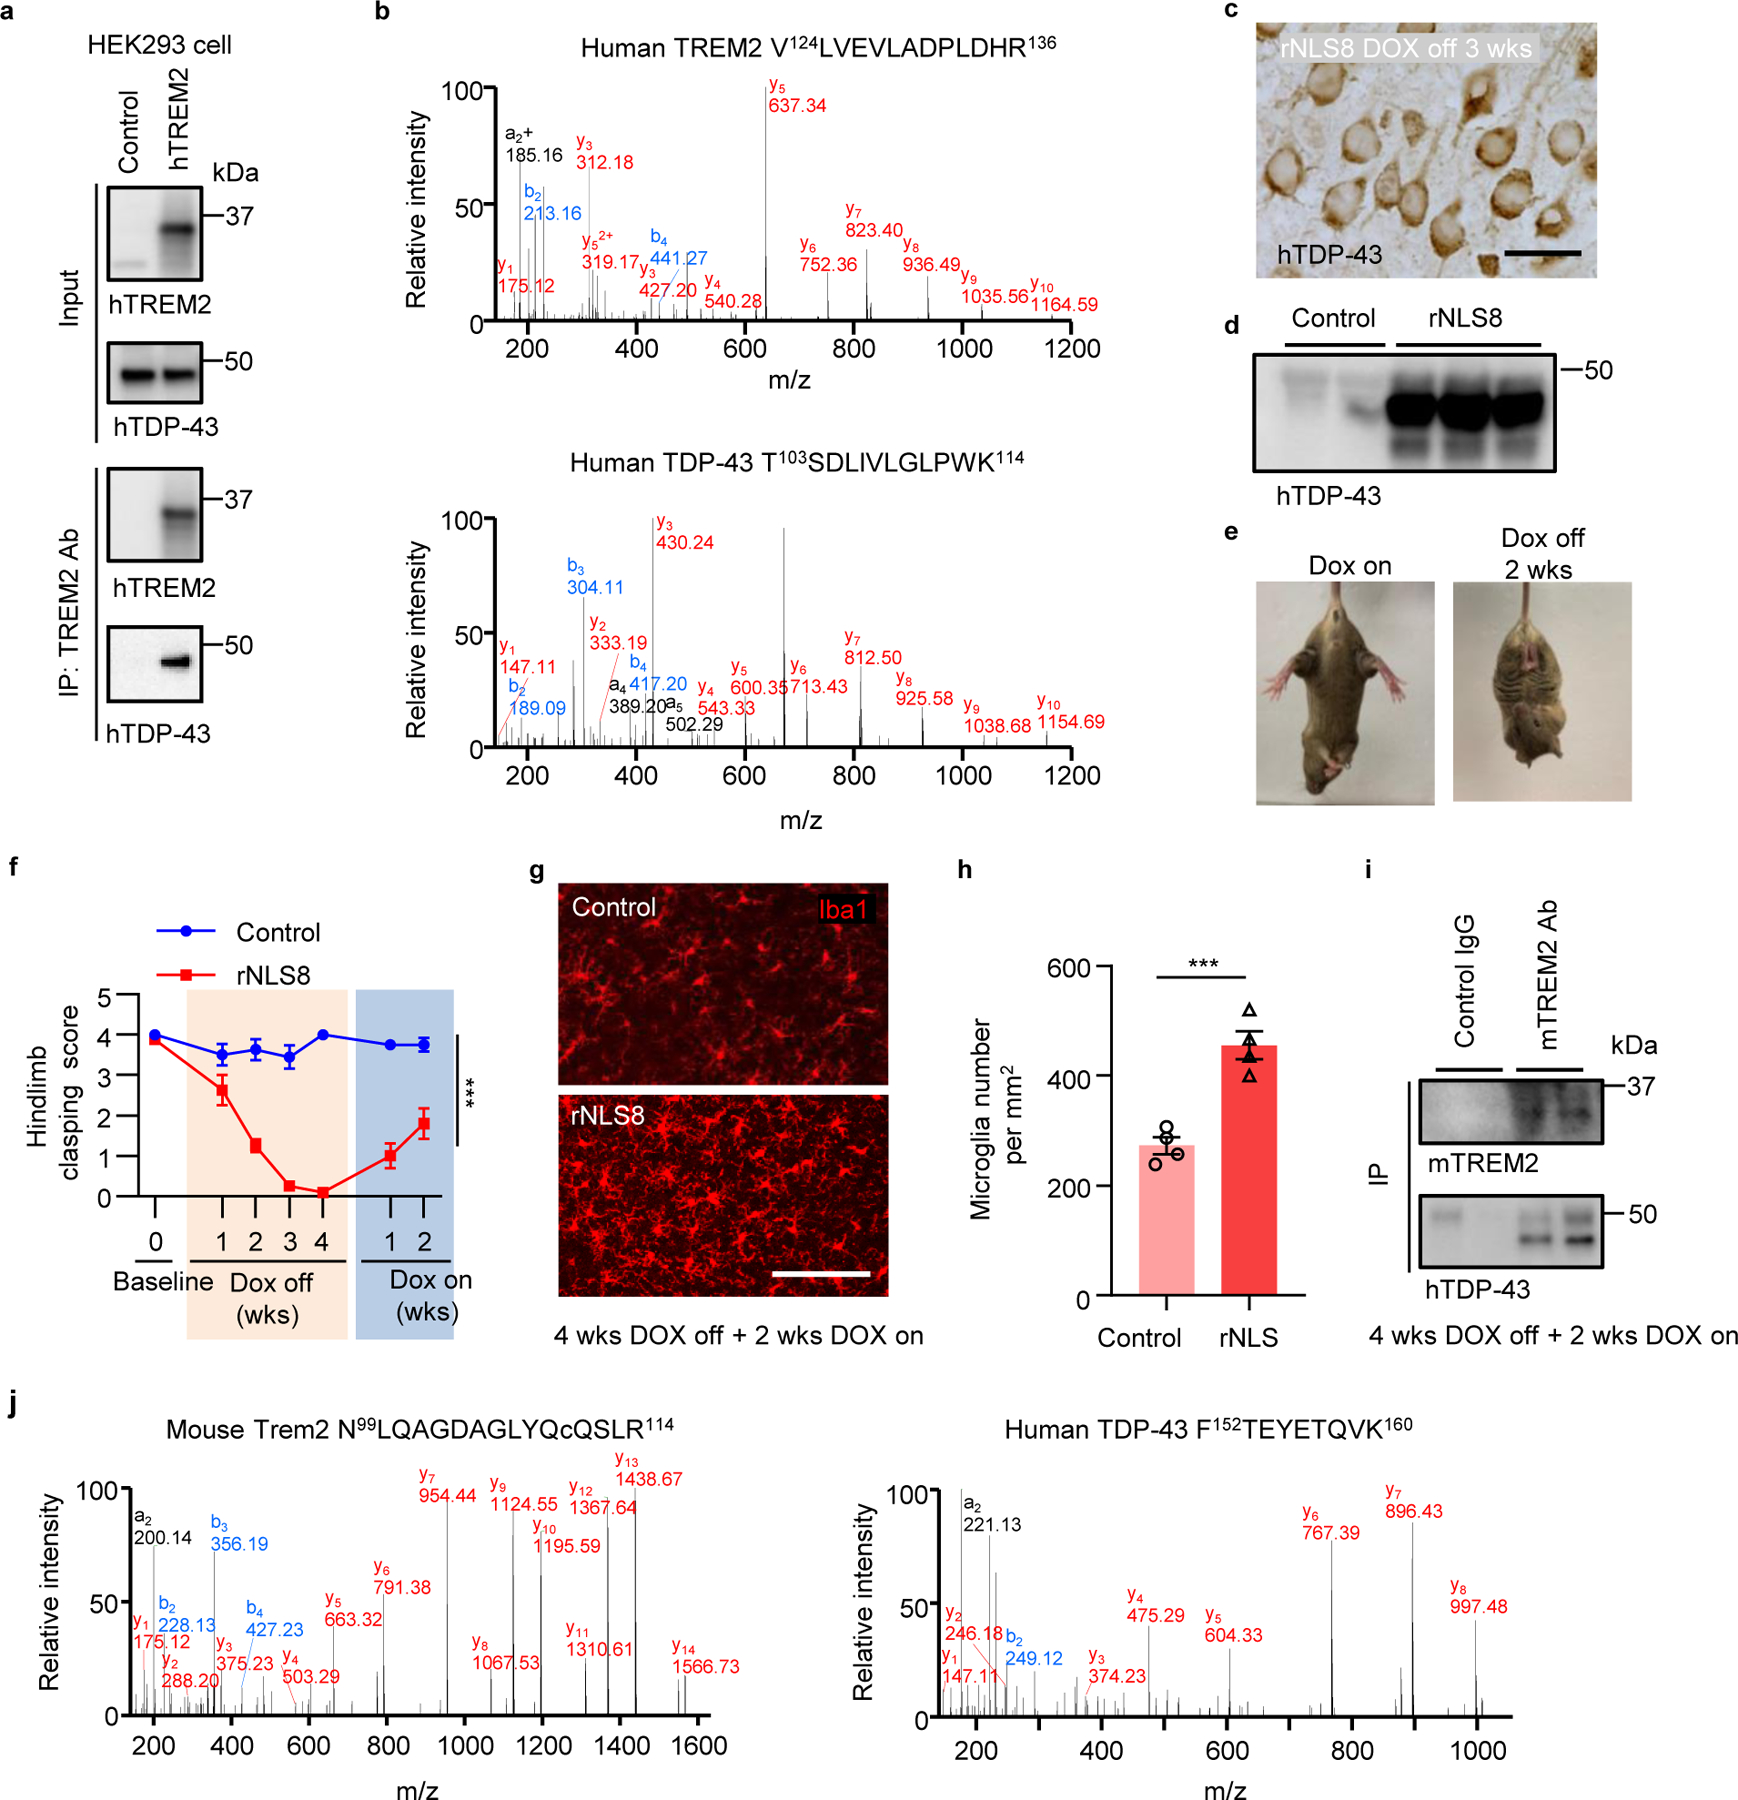
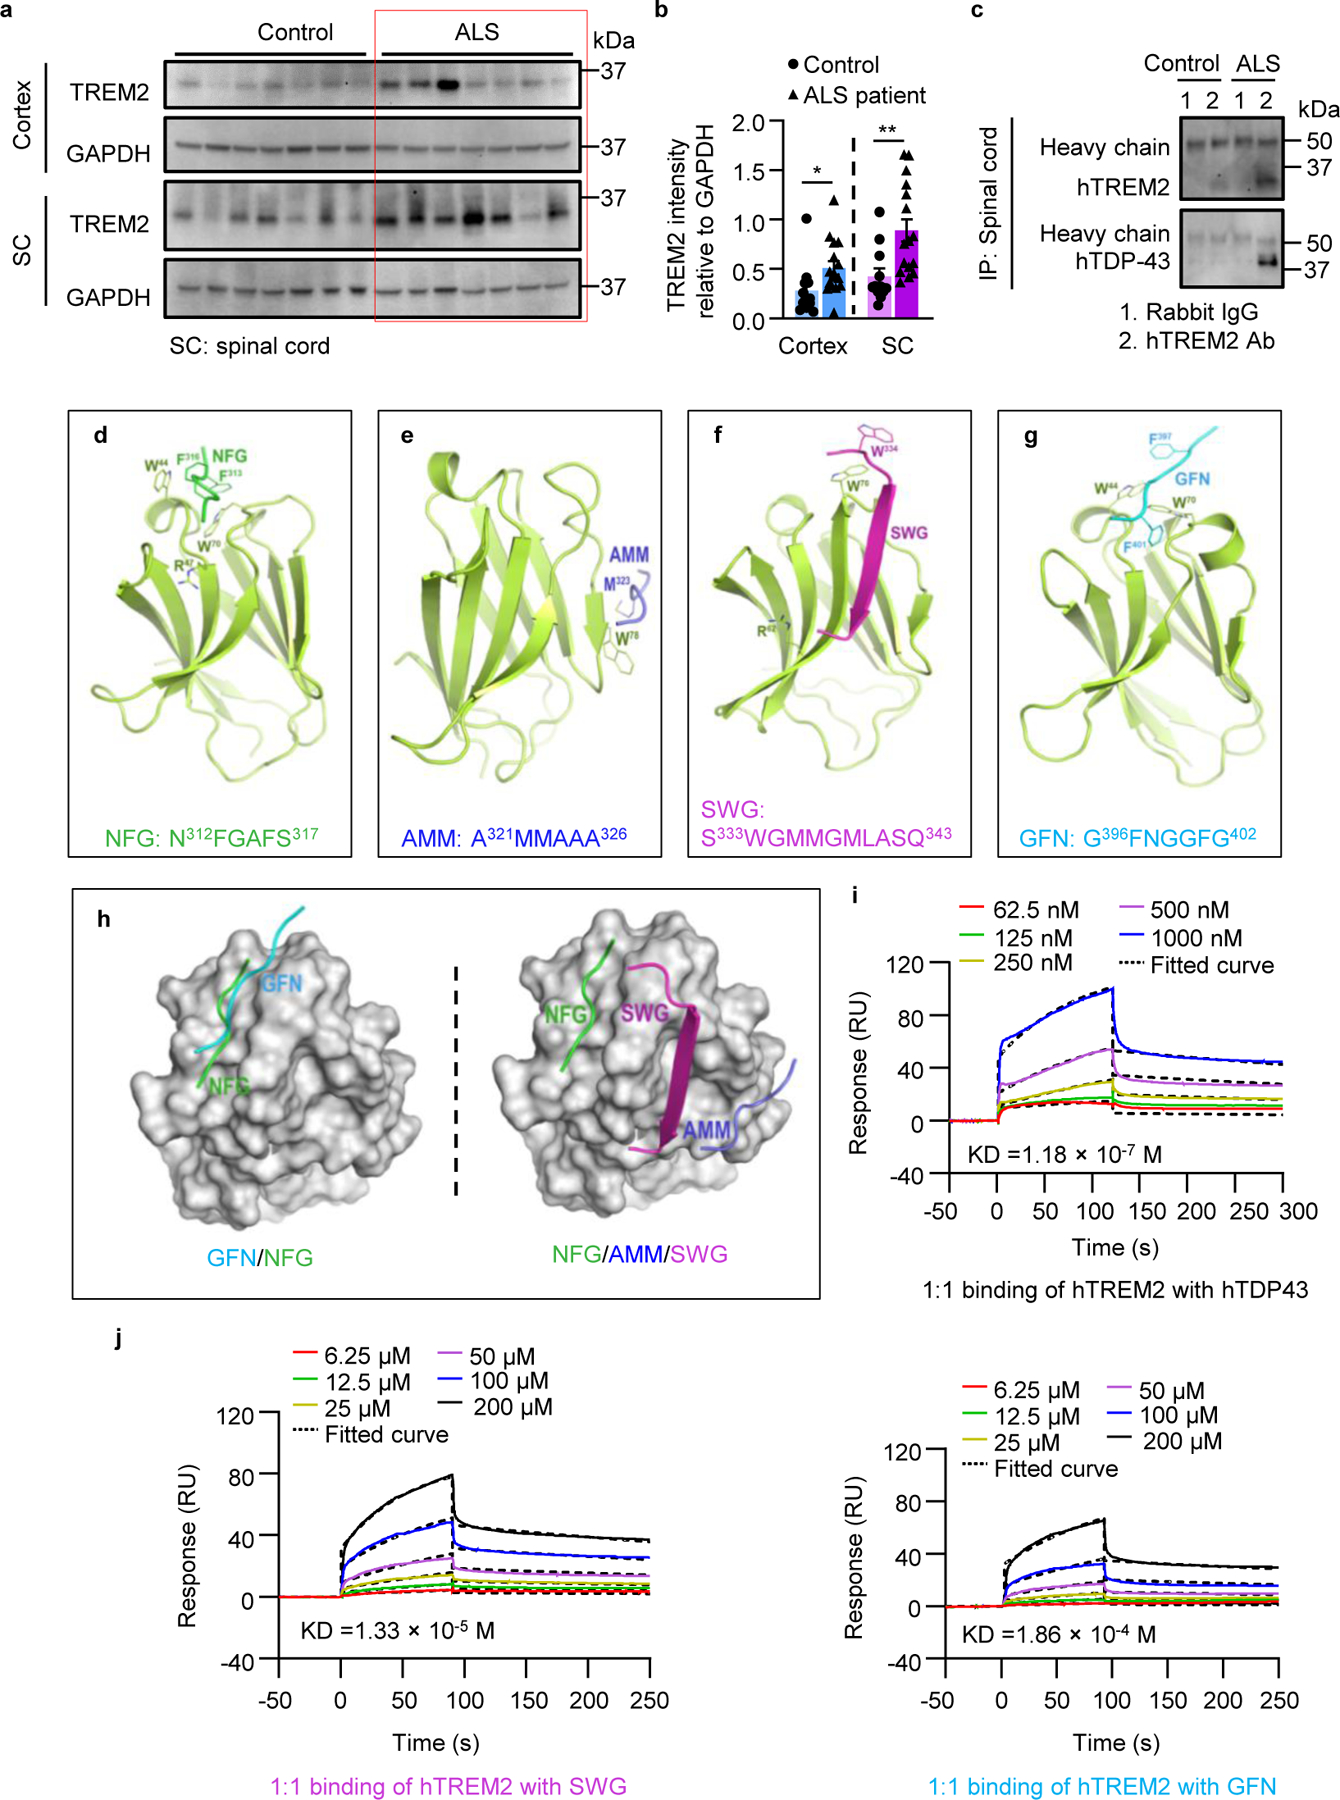
Triggering receptor expressed on myeloid cell 2 (TREM2) is linked to risk of neurodegenerative disease. However, the function of TREM2 in neurodegeneration is still not fully understood. Here, we investigated the role of microglial TREM2 in TAR DNA-binding protein 43 (TDP-43)-related neurodegeneration using virus-mediated and transgenic mouse models. We found that TREM2 deficiency impaired phagocytic clearance of pathological TDP-43 by microglia and enhanced neuronal damage and motor impairments. Mass cytometry analysis revealed that human TDP-43 (hTDP-43) induced a TREM2-dependent subpopulation of microglia with high CD11c expression and phagocytic ability. Using mass spectrometry (MS) and surface plasmon resonance (SPR) analysis, we further demonstrated an interaction between TDP-43 and TREM2 in vitro and in vivo as well as in human tissues from individuals with amyotrophic lateral sclerosis (ALS). We computationally identified regions within hTDP-43 that interact with TREM2. Our data highlight that TDP-43 is a possible ligand for microglial TREM2 and that this interaction mediates neuroprotection of microglia in TDP-43-related neurodegeneration.


Conflict of interest statement

Competing interests

The authors declare no competing interests.

Figures

Extended Data Fig. 1
Extended Data Fig. 1. Characterizations of GFP-hTDP-43 expression in a neonatal TDP-43 mouse model.
GFP-hTDP-43 expression was induced via intracerebroventricular injection of AAV9.CAG.hTDP-43.GFP in C57/BL6 (WT) neonatal mice. a, Representative image of brain GFP-hTDP-43 expression in WT mice at 21 days post-infection (dpi). Primary motor cortex (M1), supplementary motor area (M2) and lateral ventricle (LV) are separated by dashed line. Scale bar, 500 μm. Inset shows hTDP-43 expression at higher magnification as indicated by the area in dotted yellow box. Scale bar, 100 μm. b, Representative image of spinal cord (SC) GFP-hTDP-43 expression in WT mice at 21 dpi. Scale bar, 200 μm. c, Representative image (c) and quantification (d, n = 4) of GFP-hTDP-43 expression in the brain regions of cerebral cortex, hippocampus, thalamus and brainstem in WT mice at 21 dpi. Scale bar, 100 μm. e,f, Representative images (e) and quantification (f, n = 7) of co-immunostaining of GFP-hTDP-43 (green) with neuron marker NeuN (red), microglia marker Iba1 (red), astrocyte marker GFAP (red), and oligodendroglia marker CNPase (red) in the primary motor cortex of WT mice at 21 dpi. Scale bar, 100 μm. g, Representative images of p-hTDP-43 expression in the brain regions of hippocampus, thalamus, brainstem at 35 dpi. Scale bar, 20 μm. In d and f, data represented as mean ± SEM.
Extended Data Fig. 2
Extended Data Fig. 2. Characterizations of motor deficits and neuronal loss in a neonatal TDP-43 mouse model.
GFP-hTDP-43 expression was induced via intracerebroventricular injection of AAV9.CAG.hTDP-43.GFP in neonatal mice (AAV9.CAG.GFP as control). a, Body weights were measured separately for male and female of indicated groups at 35 dpi. b,c, Representative traces (b) and quantification (c) of locomotor activity in an open field test of indicated groups at 35 dpi. d,e, Representative immunostaining images (d) and quantification (e) of NeuN (red) with DAPI (blue) in the primary motor cortex of indicated groups at 35 dpi. M1 and M2 are separated by dashed line. Scale bar, 200 μm. Insets show NeuN staining in layer 5 of primary motor cortex at higher magnification as indicated by the area in dotted white box. Scale bar, 20 μm. In a, c, and e, Significance was calculated using Two-way ANOVA, Tukey’s post-hoc analysis. Data represented as mean ± SEM. n.s., not significant, *P < 0.05, **P < 0.01, *** P < 0.001. a, n = 13 per group, female: P < 0.0001, F 3,36 = 17.08; male: P < 0.0001, F 3,36 = 21.72; c, n = 25 per group, P = 0.0008, F 3,66 = 6.339; e, n = 10 per group, P < 0.0001, F 3,27 = 195.1.
Extended Data Fig. 3
Extended Data Fig. 3. TREM2 deficiency leads to increased accumulation of hTDP-43 protein.
hTDP-43 protein expression was induced via intracerebroventricular injection of AAV9.CAG.hTDP-43 in neonatal mouse (AAV9.CAG.Empty as control). a, Schematic representation of the velocity sedimentation protocol for separating soluble from Sarkosyl-insoluble aggregated proteins from an aqueous homogenate of brain tissue. b, Whole brain hTDP-43 and p-hTDP-43 (Ser409/410) immunoblots of the soluble fraction of WT and TREM2 KO mice at 70 dpi. p-hTDP-43 (Ser409/410) antibody detected a ~25 kD fragment in the soluble fractions. Notably, Ser409/410 is at the extreme C-terminal of TDP-43 protein, suggesting a higher level of phosphorylated C-terminal fragments in TREM2 KO mice. c, Whole brain p-hTDP-43 immunoblots of the Sarkosyl-insoluble fraction of WT and TREM2 KO mice at 70 dpi. Western blots were independently repeated twice with n = 4 for each group.
Extended Data Fig. 4
Extended Data Fig. 4. Phenotypic diversity of microglia in response to TDP-43 pathology by CyTOF.
a, A representative gating strategy illustrating brain myeloid cell being subgated to CD45medCD11b+ microglia. b, Microglia were plotted onto a t-SNE. Plots represent distinguishing cell surface markers for microglia of 6 to 8-week-old WT mice. Clustering analysis revealed a major microglia population characterized by CD45mid:CD11b+:CX3CR1hi:F4/80+:CD64+:MERTK+:Siglec-H+:CD11c. c, Heat map shows the change of expression levels of typical microglial markers in response to TDP-43 pathology in individual samples. Heat colors of expression levels have been scaled for each marker (blue, low expression; orange, high expression). d, Frequency analysis of microglia based on manual gating of indicated groups at 35 dpi. Significance was calculated using two-way ANOVA, Tukey’s post-hoc analysis. Data represented as mean ± SEM. n.s., not significant, *P < 0.05, **P < 0.01, *** P < 0.001. n = 4 per group, P = 0.0008, F 3,9 = 14.79.
Extended Data Fig. 5
Extended Data Fig. 5. TREM2 deficiency attenuates hTDP-43-induced microglial activation.
hTDP-43 protein expression was induced via intracerebroventricular injection of AAV9.CAG.hTDP-43 in neonatal mouse (AAV9.CAG.Empty as control). a-c, Representative images (a) and quantification of GFP-expressing microglia number (b) and soma size (c) in the primary motor cortex of indicated groups at 35 dpi. M1 and M2 are separated by dashed line. Scale bar, 200 μm. Insets show microglia at higher magnification as indicated by the area in white box. Scale bar, 50 μm. d, Representative images of co-localization of CD11c (white) with Iba1 (red) in microglia phagocytosing GFP-hTDP-43 (green) in the primary motor cortex of WT group at 35 dpi. White arrowheads indicate phagocytic puncta of GFP-hTDP-43. Scale bar, 20 μm. e, Pie chart representing the percentage of microglia phagocytosing GFP-hTDP-43 (green, phagocytic microglia) and those non-phagocytic microglia in d. In b and c, Significance was calculated using two-way ANOVA followed by Tukey’s post hoc test. Data represented as mean ± SEM. n.s., not significant, *P < 0.05, **P < 0.01, *** P < 0.001. b, n = 10 per group, P < 0.0001, F 3,27 = 283.9; c, n = 10 per group, P < 0.0001, F 3,27 = 19.59.
Extended Data Fig. 6
Extended Data Fig. 6. Characterizations of hTDP-43 expression mouse model via local virus injection in the primary motor cortex of adult mice.
GFP-hTDP-43 or hTDP-43 was expressed in the primary motor cortex of 2-month-old mice via stereotactic intracerebral injection of AAV9.CAG.hTDP-43.GFP or AAV9.CAG.hTDP (AAV9.CAG.GFP or AAV9.CAG.Empty as control). a, Schematic picture showing stereotactic virus injection site (upper). Representative image of GFP expression in the primary motor cortex of 2-month-old WT mice at 14 dpi (lower); Dashed lines indicate the borders of layer 4&5. Scale bar, 100 μm. b, Representative images of GFP-hTDP-43 expression in neuronal nuclei (white arrowhead) and diffusely in dendrites (white arrow) in motor cortex of WT mice at 14 dpi. AAV1.CAG.tdTomato virus was co-injected to visualize neurons. Scale bar, 5 μm. c,d, Representative images (c) and quantification (d) of GFP-hTDP-43 expression in the primary motor cortex of WT and TREM2 KO mice at 14 dpi. Scale bar, 100μm. e, GFP-hTDP-43 immunoblots of primary motor cortex of WT and TREM KO mice at 14 dpi. Western blots were independently repeated four times (n = 8 per group). GAPDH was used as loading control. f,g, Representative images (f) and quantification (g) of GFP-expressing microglia in the primary motor cortex of indicated groups at 14 dpi. Scale bar, 100μm. h, Representative images of microglia (Iba1, red) phagocytosing GFP-hTDP-43 (green) in the primary motor cortex of indicated groups at 28 dpi. Scale bar, 100 μm. Significance was calculated using either two-tailed unpaired Student’s t-test (d) or two-way ANOVA, Tukey’s post-hoc analysis (g). Data represented as mean ± SEM. n.s. =, not significant, *P < 0.05, **P < 0.01, *** P < 0.001. d, n = 7 per group, P = 0.4802, t = 0.7286, d.f. = 12; g, n = 12 per group, P < 0.0001, F 3,33 = 133.4.
Extended Data Fig. 7
Extended Data Fig. 7. TREM2 deficiency facilitates hTDP-43-induced neurodegeneration.
GFP-hTDP-43 or hTDP-43 was expressed in the primary motor cortex of 2-month-old mice via stereotactic intracerebral injection of AAV9.CAG.hTDP-43.GFP or AAV9.CAG.hTDP (AAV9.CAG.GFP or AAV9.CAG.Empty as control). a,b, Representative images (a) and quantification (b) of NeuN immunostaining (red) in the primary motor cortex of indicated groups at 28 dpi. Scale bar, 100 μm. c,d, Representative images (c) and quantification (d) of microglia (GFP) interaction with NeuN+ neurons (red) in the primary motor cortex of indicated groups at 28 dpi. Scale bar, 50 μm. e, Representative images of CD11c (white) expression in microglia (CX3CR1-GFP, green) interacting with NeuN+ neurons (red) in the primary motor cortex of WT groups at 28 dpi. Scale bar, 20 μm. In b and d, Significance was calculated using two-way ANOVA followed by Tukey’s post hoc test. Data represented as mean ± SEM. n.s., not significant, *P < 0.05, **P < 0.01, *** P < 0.001. b, n = 5 per group, P < 0.0001, F 3,12 = 60.56; d, n = 4 per group, P < 0.0001, F 3,9 = 34.58.
Extended Data Fig. 8
Extended Data Fig. 8. TDP-43 can be released from neurons and interact with TREM2 in vitro.
a, Representative images of human iPSC derived neurons infected with AAV9.CAG.hTDP-43.GFP virus or control virus at 21dpi. AAV1.CAG.tdTomato virus used to visualize neurons. Scale bar, 100 μm. Inserts show neuron morphology at high magnification as indicated by the area in dotted white box. White arrowheads indicate GFP-hTDP-43 translocation in neurites. Scale bar, 20 μm. b, Immunoblots of TDP-43 contained within collected culture media of iPSCs (left) or in pulled down fractions by bead-immobilized GFP antibody (right). c, Representative images of HEK 293T cells co-transfected with myc-tagged human TREM2 (myc-hTREM2) and GFP-hTDP-43 C terminal fragment (residues 216–414) or GFP control plasmids. Scale bar, 20 μm. d, myc-hTREM2 was co-immunoprecipitated with GFP-hTDP-43 in HEK 293T cells using bead-immobilized GFP antibody. Experiments were independently repeated three times. e, GFP-hTDP-43 was co-immunoprecipitated with myc-hTREM2 in HEK 293T cells using bead-immobilized myc antibody. Experiments were independently repeated three times.
Extended Data Fig. 9
Extended Data Fig. 9. Human TREM2 interacting proteins in HEK293T cells.
a, A schematic illustration of the SILAC methodology to identify human TREM2 interacting proteins in HEK293T cells (Created with BioRender.com). b and c, MS and MS/MS spectra of a peptide “D137AGDLWFPGESESFEDAHVEHSISR161” from human TREM2.
Extended Data Fig. 10
Extended Data Fig. 10. hTDP-43 interacts with TREM2 in vivo in mouse brain.
GFP-hTDP-43 was expressed in the primary motor cortex of 2-month-old mice via stereotactic intracerebral injection of AAV9.CAG.hTDP-43.GFP. a, Representative images of co-localization of TREM2 (red) with Iba1 (white) in microglia phagocytosing GFP-hTDP-43 (green) in the primary motor cortex of indicated groups at 14 dpi. Arrowheads indicate co-localization of TREM2 with phagocytic puncta of GFP-hTDP-43. Scale bar, 20 μm. b, SPR analysis of the binding between recombinant hTREM2 ECD (Met1-Ser174) with NFG and AMM at the indicated concentrations.
Fig 1.
Fig 1.. TREM2 deficiency aggravates hTDP-43-induced behavioral deficits and neurodegeneration.
GFP tagged hTDP-43 protein (GFP-hTDP-43) expression was induced via intracerebroventricular injection of AAV9.CAG.hTDP-43.GFP in neonatal mice (AAV9.CAG.GFP as control). a, Study design and timeline for the neonatal ICV injection model. b, Representative images of GFP-hTDP-43 expression in both nucleus and cytosol of neurons in the primary motor cortex of WT mice at 35 days post-infection (dpi). Scale bar, 10 μm. c-d, Representative images of hTDP-43 (c) and p-hTDP-43 (d) expression in the motor cortex at 35 dpi. Scale bar, 20 μm. e, Representative images of typical clasping phenotype in WT mice expressing hTDP-43 at 14 dpi. f, Kaplan-Meier survival curves show the percentage of mice alive at each postnatal day up to 60 dpi. g, Hindlimb clasping response scores collected over 70 days. h, Average latency to fall during rotarod analysis at 70 dpi. i, j, Representative images (i) and quantification (j) of Nissl staining in the primary motor cortex of indicated groups at 35 dpi; Dashed lines indicate the borders of layer 4&5. Scale bar, 100 μm. High magnification images as indicated by area in dotted white box showing neuronal morphology of the cortical layer V at the bottom. Scale bar, 50 μm. Red arrows indicate neuronal shrinkage and red arrowheads indicate a significant loss of Nissl staining. f. Survival curves were analyzed using a log-rank (Mantel-Cox) test. n = 20 per group, P < 0.0001, χ² = 9.227, d.f. = 3. In g, h, and j, Significance was calculated using two-way ANOVA followed by Tukey’s post hoc test. Data represented as mean ± SEM. n.s. = not significant, *P < 0.05, **P < 0.01, *** P < 0.001. g, n = 10 per group, P < 0.0001, F 3,1152 =2002; h, n = 10 per group, P < 0.0001, F 3,108 = 69.45; j, n = 10 per group, P < 0.0001, F 3,27 = 104.9.
Fig 2.
Fig 2.. TREM2 deficiency abolishes hTDP-43-induced CD11c+ microglia subpopulation.
hTDP-43 protein expression was induced via intracerebroventricular injection of AAV9.CAG.hTDP-43 in neonatal mice (AAV9.CAG.Empty as control). a, Schematic workflow for cytometry by time of flight mass spectrometry (CyTOF). b, t-SNE map displaying 70157 CD45medCD11b+ microglia from 20 mice brain of 4 indicated groups at 35 dpi. Colors correspond to FlowSOM-guided clustering of microglia subpopulations. c, Heat map shows the expression levels of markers used for the microglia subpopulation analysis. Heat colors of expression levels have been scaled for each marker (blue, low expression; red, high expression). d, Single-cell t-SNE map highlights CD11c+ microglia sub-population. The histogram panels show the expression of CD11c, Iba1 and CD11b. e, t-SNE map reveals a unique CD11c+ microglia sub-population indicated by dotted circle in WT mice expressing hTDP-43 at 35 dpi. The color code shows the expression level of CD11c (blue, low expression; red, high expression). f, Frequency analysis of CD11c+ microglia based on manual gating of indicated groups at 35 dpi. g, Representative images (g) and quantification (h) of CD11c (purple) expression by immunostaining in the primary motor cortex of indicated groups at 35 dpi. Scale bar, 100 μm. High magnification images as indicated by area in dotted white box showing at the bottom. Scale bar, 10 μm. In f and h, Significance was calculated using two-way ANOVA followed by Tukey’s post hoc test. Data represented as mean ± SEM. n.s., not significant, *P < 0.05, **P < 0.01, *** P < 0.001. f, n = 4 for control groups; n = 6 for WT group with hTDP-43; n = 5 for TREM2 KO group with hTDP-43, P = 0.0146, F 3,10 = 5.807; h, n = 8 per group, P < 0.0001, F 3,21 = 140.9.
Fig 3.
Fig 3.. TREM2 deficiency locks microglia into a homeostatic state in TDP-43-induced neurodegeneration.
In adult local injection model, hTDP-43 or GFP-hTDP-43 was expressed in the primary motor cortex of 2-month-old mice via stereotactic intracerebral injection of AAV9.CAG.hTDP-43 or AAV9.CAG.hTDP-43.GFP (AAV9.CAG.Empty or AAV9.CAG.GFP as control). a, Timeline for local injection model. b, Representative images (upper panels. Scale bar, 100 μm) and skeletal images (lower panels. Scale bar, 10 μm) of GFP-expressing microglia in the primary motor cortex of indicated groups at 14 dpi. c-e, Quantification of microglia number of branches (c), soma size (d), and process length (e) in b. f,g, Representative images of P2Y12 expression (f) and TMEM119 expression (g) in the primary motor cortex of indicated groups at 7 dpi. Scale bar, 100 μm. h, i, Quantification of relative P2Y12 (h) and TMEM119 (i) positive area. j, Representative images of CD11c (purple), hTDP-43 (green), and DAPI staining (blue) in the primary motor cortex of indicated groups at 28 dpi. Scale bar, 100 μm. High magnification images as indicated by area in dotted white box showing on the right. Scale bar, 10 μm. k, Analysis of co-localization of CD11c with GFP-hTDP-43 in the primary motor cortex of indicated groups at 28 dpi. Fluorescence intensity profiles of CD11c and GFP-hTDP-43 show the distribution of fluorescence across the yellow dotted arrows in j. l, Quantification of the CD11c+ microglia in i. Significances were calculated using either two-way ANOVA, Tukey’s post-hoc analysis (c-e, h and i) or two-tailed unpaired Student’s t-test (l). Data represented as mean ± SEM. n.s., not significant, *P < 0.05, **P < 0.01, *** P < 0.001. c, n = 10 per group, P < 0.0001, F 3,27 = 80.39; d, n = 15 per group, P < 0.0001, F 3,42 = 38.44; e, n = 10 per group, P < 0.0001, F 3,27 = 89.88; h, n = 10 per group, P < 0.0001, F 3,27 = 24.12; i, n = 10 per group, P = 0.0146, F 3,27 = 14.90; l, n = 7 per group, P < 0.0001, t = 20.47, d.f. = 12.
Fig 4.
Fig 4.. TREM2 deficiency impairs microglial phagocytosis of pathological hTDP-43 protein.
hTDP-43 or GFP-hTDP-43 was expressed in the primary motor cortex of 2-month-old mice via stereotactic intracerebral injection of AAV9.CAG.hTDP-43 or AAV9.CAG.hTDP-43.GFP (AAV9.CAG.Empty or AAV9.CAG.GFP as control). a,b, Representative images (a) and quantification (b) of CD68 expression (red) in microglia (CX3CR1-GFP, green) in the primary motor cortex of indicated groups at 14 dpi. Scale bar, 100 μm. c, Representative images of CD68 (red) and CD11c (white) expression in microglia phagocytosing GFP-hTDP-43 (green) in the primary motor cortex of WT mice at 14 dpi. Scale bar, 10 μm. d,e, Representative images (d) and quantification (e) of microglia (Iba1, red) phagocytosis of GFP-hTDP-43 (green) in the primary motor cortex of indicated groups at 28 dpi, as indicated by the arrowheads. Scale bar, 20 μm. f, Analysis of co-localization of Iba1 (red curves) and GFP-hTDP-43 (green curves). Fluorescence intensity profiles of Iba1 and GFP-hTDP-43 show the distribution of fluorescence across the white dotted arrows in d. g, Representative images of co-localization of CD11c (white) with Iba1 (red) in microglia phagocytosing GFP-hTDP-43 (green) in the primary motor cortex of WT mice at 28 dpi. Scale bar, 10 μm. h, Analysis of co-localization of Iba1 (red curves), CD11c (grey curves) and GFP-hTDP-43 (green curves). Fluorescence intensity profiles of Iba1, CD11c, and GFP-hTDP-43 show the distribution of fluorescence across the yellow dotted arrows in g. Significances were calculated using either two-way ANOVA, Tukey’s post-hoc analysis (b) or two-tailed unpaired Student’s t-test (e). Data are represented as mean ± SEM. n.s., not significant, *P < 0.05, **P < 0.01, *** P < 0.001. b, n = 5 per group, P < 0.0001, F 3,12 = 36.21; e, n = 7 per group, P < 0.0001, t = 9.227, d.f. = 12.
Fig 5.
Fig 5.. TREM2 deficiency leads to increased accumulation of pathological hTDP-43 protein.
GFP-hTDP-43 was expressed in the primary motor cortex of 2-month-old mice via stereotactic intracerebral injection of AAV9.CAG.hTDP-43.GFP (AAV9.CAG.GFP as control). a, Representative images of co-localization of p-TDP-43 with GFP-hTDP-43 in the primary motor cortex of indicated groups at 28 dpi, as indicated by white arrowheads. Scale bar, 100 μm. High magnification images as indicated by area in dotted white box showing on the right. Scale bar, 10 μm. b, Analysis of co-localization of p-TDP-43 and GFP-hTDP-43. Fluorescence intensity profiles of p-TDP-43 and GFP-hTDP-43 show the distribution of fluorescence across the yellow dotted arrow in a. c-e, Quantification of hTDP-43 area (c), p-TDP-43 area (d) and GFP+ particle size (e) in a. f, Analysis of hTDP-43 particle size distribution in a. Particles with size below 4 μm2 or over 20 μm2 are highlighted by blue. g, GFP-hTDP-43 and p-hTDP-43 (Ser409/410) immunoblots of the soluble fractions and p-hTDP-43 immunoblots of the Sarkosyl-insoluble fraction from primary motor cortex of indicated groups at 28 dpi. Western blots were independently repeated four times (n = 4 per group). GAPDH was used as loading control. In c, d, e, and f, Significance was calculated using two-tailed unpaired Student’s t-test. Data represented as mean ± SEM. n.s., not significant, *P < 0.05, **P < 0.01, *** P < 0.001. c, n = 14 per group, P < 0.0001, t = 5.782, d.f. = 26; d, n = 10 per group, P < 0.0001, t = 6.662, d.f. = 18; e, n = 10 per group, P = 0.0027, t = 3.478, d.f. = 18; f, n = 9 per group, 0–1 μm2 : P = 0.0004, t = 4.419, d.f. = 16; 1–2 μm2 : P = 0.0073, t = 3.073, d.f. = 16; 2–3 μm2 : P = 0.0075, t = 3.056, d.f. = 16; 4–5 μm2 : P = 0.0185, t = 2.623, d.f. = 16; >20 μm2 : P = 0.0119, t = 2.837, d.f. = 16.
Fig 6.
Fig 6.. hTDP-43 interacts with TREM2 in vitro and in vivo in mouse brain.
a, hTDP-43 was co-immunoprecipitated with myc-hTREM2 in HEK 293T cells overexpressing hTREM2. Experiments were independently repeated three times. b, Annotated MS/MS spectra of V124LVEVLADPLDHR136 from hTREM2 and T103SDLIVLGLPWK114 from hTDP-43 identified in anti-hTREM2 immunoprecipitates from HEK 293T cells. c, Representative images of hTDP-43 expression in cytosol in the primary motor cortex of rNLS8 mice at 3 weeks off DOX diet. Scale bar, 20 μm. d, hTDP-43 immunoblots of primary motor cortex of rNLS8 mice at 3 weeks off DOX diet. e, rNLS8 mice showed clasping phenotype at 2 weeks off DOX diet. f, Hindlimb clasping response scores over 4 weeks off DOX diet followed by 2 weeks DOX on. g,h, Representative images (g) and quantification (h) of microglia (Iba1, red) in the primary motor cortex of indicated groups at 4 weeks off DOX diet followed by 2 weeks DOX on. Scale bar, 100 μm. i, Endogenous mTREM2 was co-immunoprecipitated with hTDP-43 in the motor cortex of rNLS8 mice at 4 weeks off DOX diet followed by 2 weeks DOX on. Experiments were independently repeated three times. j, Annotated MS/MS spectra of N99LQAGDAGLYQcQSLR114 (c is carbaminomethylated cysteine) from mTREM2 and F152TEYETQVK160 from hTDP-43 in anti-mTREM2 immunoprecipitates from rNLS8 mouse cortex tissue at 4 weeks off DOX diet followed by 2 weeks DOX on. Significance was calculated using either two-way ANOVA, Tukey’s post-hoc analysis (f) or two-tailed unpaired Student’s t-test (h). Data represented as mean ± SEM. n.s., not significant, *P < 0.05, **P < 0.01, *** P < 0.001. f, n = 12 per group, P < 0.0001, F 6,110 = 19.97; h, n = 4 per group, P = 0.0008, t = 6.149, d.f. = 6.
Fig 7.
Fig 7.. hTDP-43 interacts with TREM2 in human tissues and in silico.
a, TREM2 immunoblots of frozen autopsied cortex and spinal cord specimens of ALS patients and age matched controls. b, Quantification of TREM2 level relative to GAPDH (n =12 for control, n = 16 for ALS patients). c, Endogenous TDP-43 of frozen autopsied spinal cord specimens from ALS patients was co-immunoprecipitated with TREM2. Experiments were independently repeated three times. d-g, Cartoon models of the human TREM2 extracellular ligand-binding domain in complex with four low-complexity domain (LCD) fragments of TDP-43, including NGF, AMM, SWG and GFN (NFG: N312FGAFS317; AMM: A321MMAAA326; SWG: S333WGMMGMLASQ343; GFN: G396FNGGFG402). h, Surface models of the TREM2 complex showing overlapping binding sites of GFN and NFG and distinct binding sites of NFG, AMM, and SWG. i, Surface plasmon resonance (SPR) analysis of the binding between recombinant hTREM2 ECD (Met1-Ser174) with full length hTDP-43. hTREM2 ECD was immobilized on a CM5 BIAcore chip and interacted with full length hTDP-43 at the indicated concentrations. j, SPR analysis of the binding between recombinant hTREM2 ECD (Met1-Ser174) with SWG and GFN at the indicated concentrations. SPR was independently repeated three times for full length hTDP-43. In b, Significance was calculated using two-tailed unpaired Student’s t-test. Data represented as mean ± SEM. n.s., not significant, *P < 0.05, **P < 0.01, *** P < 0.001. Cortex: P = 0.0316, t = 2.271, d.f. =26; SC: P = 0.0045, t = 3.112, d.f. = 26.

References

    1. Hickman S, Izzy S, Sen P, Morsett L & El Khoury J Microglia in neurodegeneration. Nat Neurosci 21, 1359–1369 (2018). - PMC - PubMed
    1. Ulland TK & Colonna M TREM2 - a key player in microglial biology and Alzheimer disease. Nat Rev Neurol 14, 667–675 (2018). - PubMed
    1. Guerreiro R, et al. TREM2 variants in Alzheimer’s disease. N Engl J Med 368, 117–127 (2013). - PMC - PubMed
    1. Jonsson T, et al. Variant of TREM2 associated with the risk of Alzheimer’s disease. N Engl J Med 368, 107–116 (2013). - PMC - PubMed
    1. Wang Y, et al. TREM2 lipid sensing sustains the microglial response in an Alzheimer’s disease model. Cell 160, 1061–1071 (2015). - PMC - PubMed

Publication types

MeSH terms