. 2022 Jan;19(1):65-70.
doi: 10.1038/s41592-021-01341-x. Epub 2021 Dec 16.

Engineered HaloTag variants for fluorescence lifetime multiplexing

Affiliations

Engineered HaloTag variants for fluorescence lifetime multiplexing

Michelle S Frei et al. Nat Methods. 2022 Jan.

Abstract

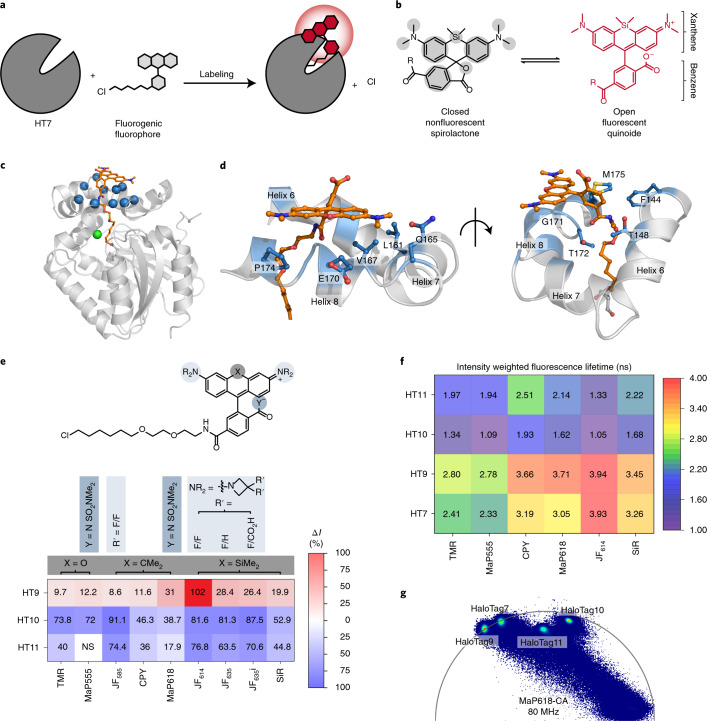
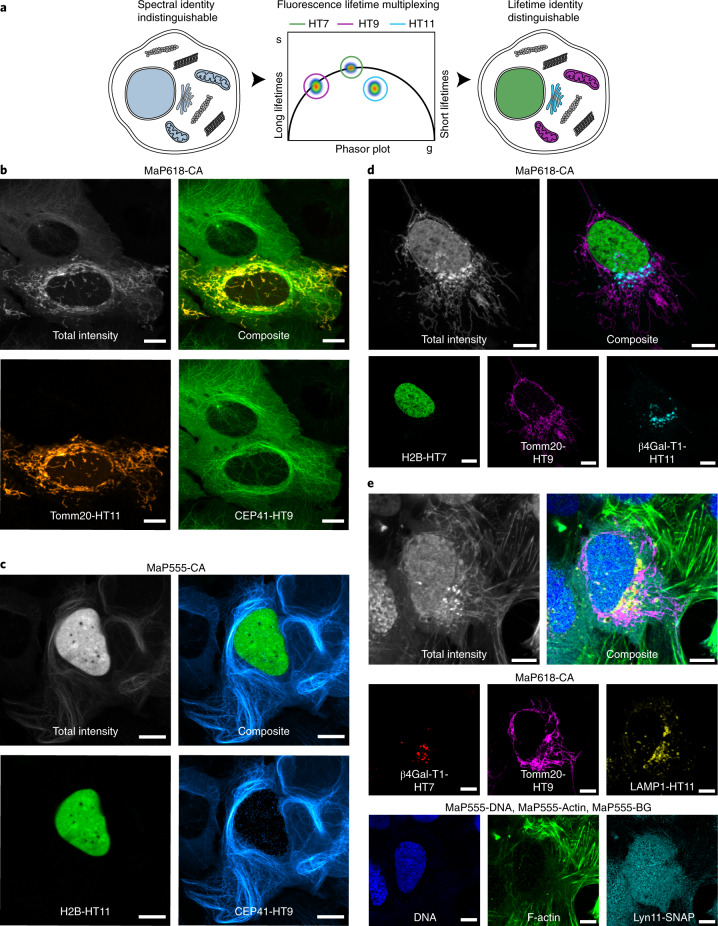
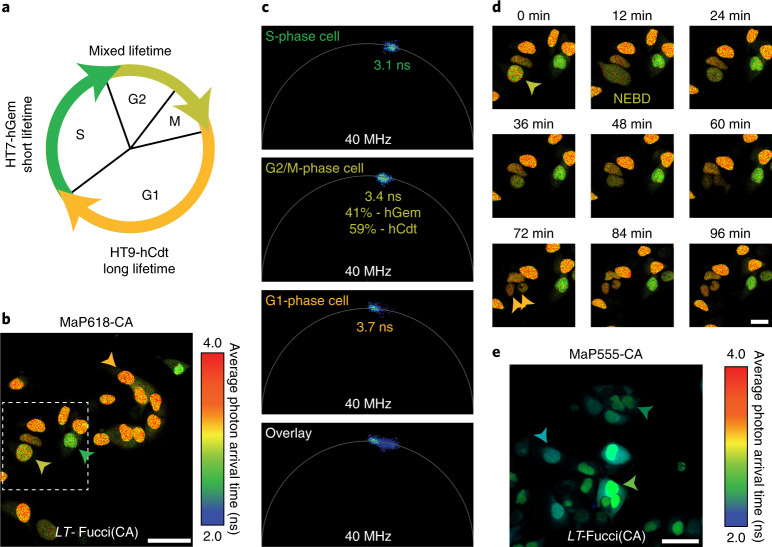
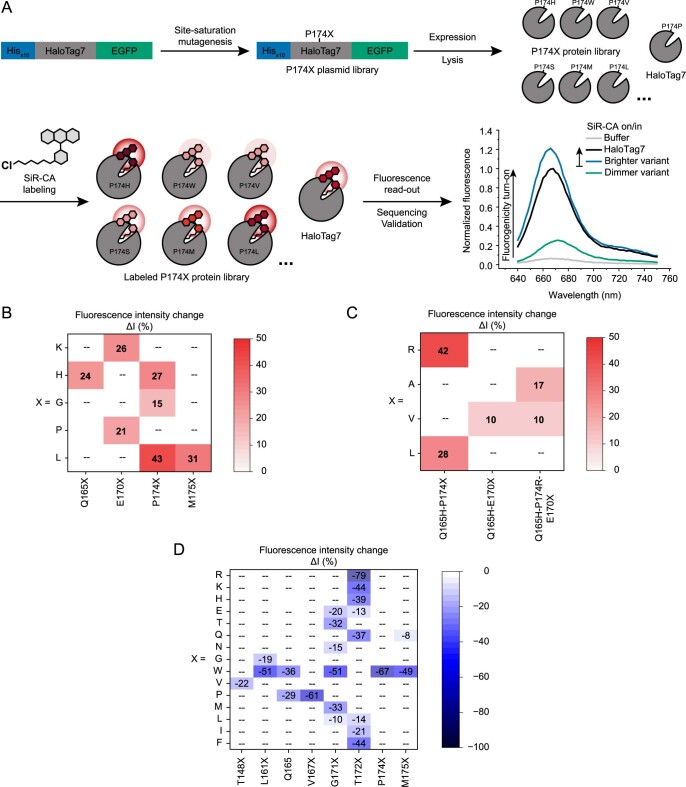
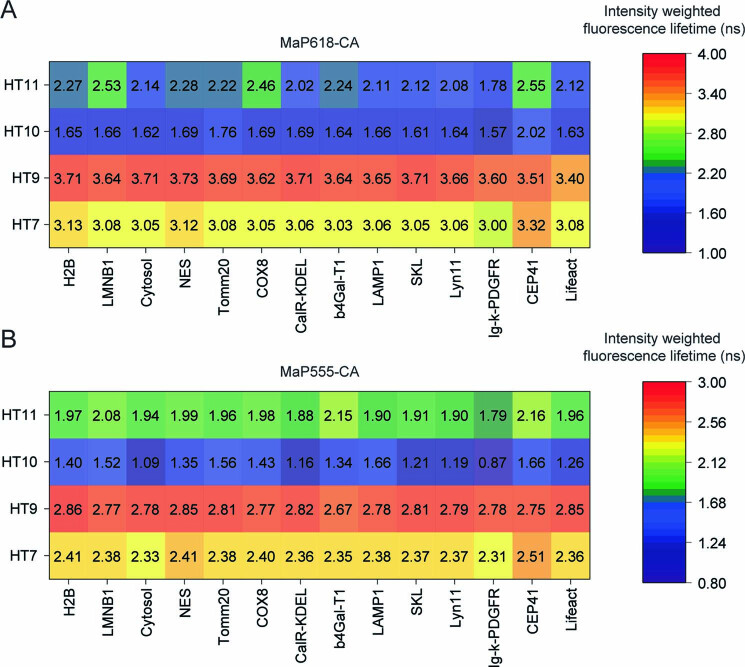
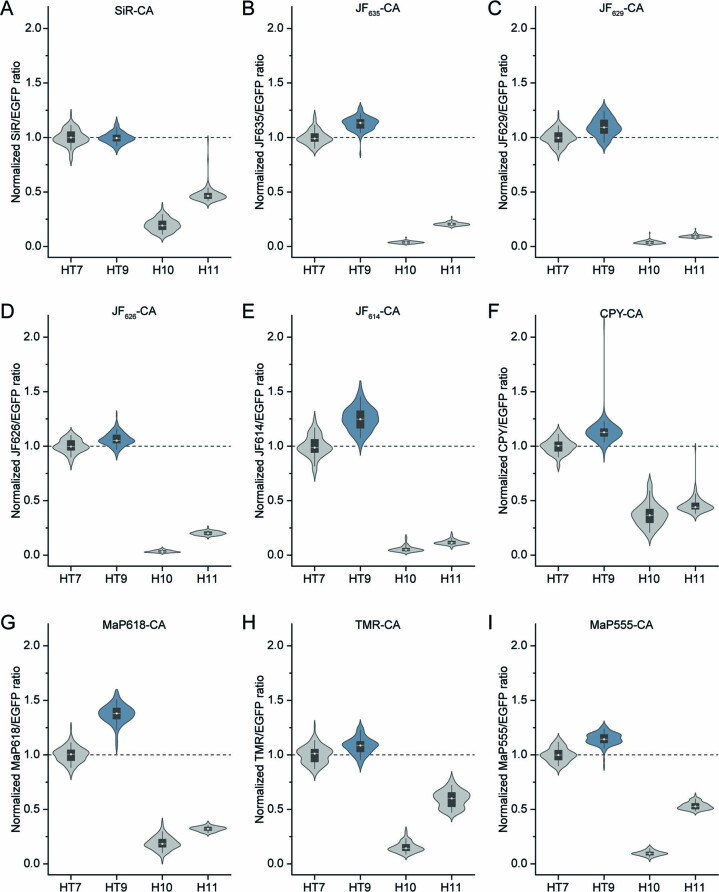
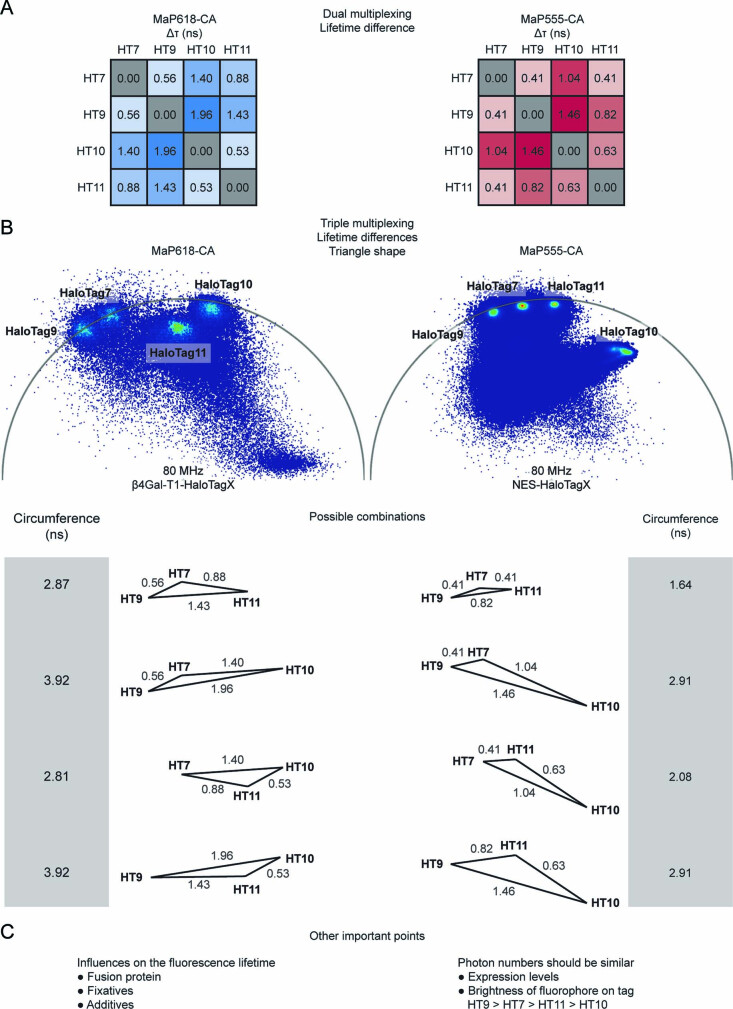
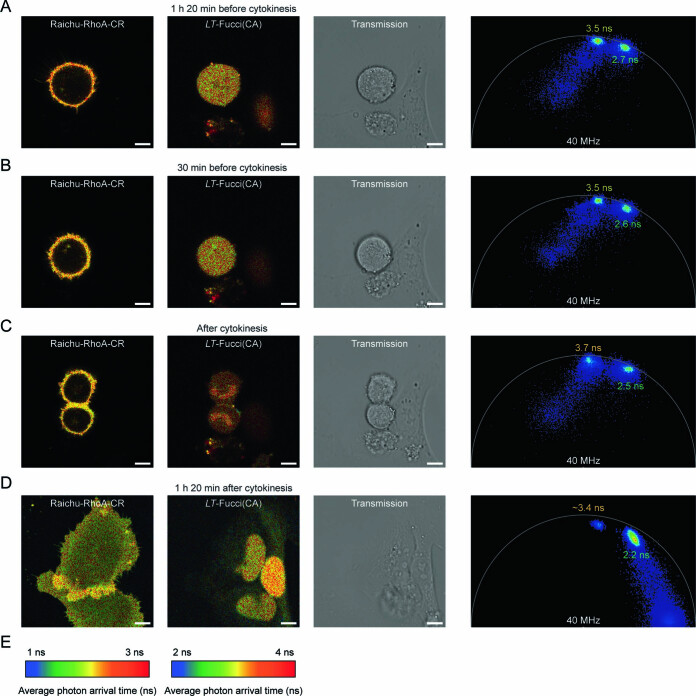
Self-labeling protein tags such as HaloTag are powerful tools that can label fusion proteins with synthetic fluorophores for use in fluorescence microscopy. Here we introduce HaloTag variants with either increased or decreased brightness and fluorescence lifetime compared with HaloTag7 when labeled with rhodamines. Combining these HaloTag variants enabled live-cell fluorescence lifetime multiplexing of three cellular targets in one spectral channel using a single fluorophore and the generation of a fluorescence lifetime-based biosensor. Additionally, the brightest HaloTag variant showed up to 40% higher brightness in live-cell imaging applications.


Conflict of interest statement

K.J. is inventor on patents filed by MPG and EPFL on fluorophores and labeling technologies. M.J.R. is an employee of Leica Microsystems. The remaining authors declare no competing interests.

Figures

Fig. 1
Fig. 1. Characterization of HaloTag variants.
a, Scheme of HaloTag7 labeling with a fluorogenic fluorophore. b, Environmentally sensitive open–closed equilibrium of SiR, a fluorogenic rhodamine. The equilibrium position can be tuned through environmental changes or through chemical modifications indicated by the gray areas. R, chloroalkane (CA). c, Crystal structure of HaloTag7-TMR (PDB ID: 6Y7A, 1.4 Å). The protein is represented as a gray cartoon and TMR as orange sticks. The Cα of the ten amino acids chosen for site-saturation mutagenesis are highlighted as blue spheres. The chlorine atom is shown as a green sphere. d, TMR binding site (helices 6–8) on the HaloTag7-TMR crystal structure. Same structural representation as in c, but with the ten amino acid side chains represented by blue sticks. e, Relative in vitro fluorescence intensity (ΔI) changes of labeled HaloTag variants compared with those of HaloTag7. Unless otherwise stated, R = Me and Y− = O in the generalized chemical structure (Supplementary Table 4; ΔI: mean, for N see Supplementary Table 5). f, Fluorescence lifetimes (τ) of different rhodamines on the four HaloTags (mean, for N see Supplementary Table 8). g, Overlaid phasor plots of the four HaloTags expressed in the cytosol of U-2 OS cells labeled with MaP618-CA.
Fig. 2
Fig. 2. Application of HaloTag variants in fluorescence lifetime multiplexing.
a, Schematic view of fluorescence lifetime multiplexing using only one rhodamine for three targets (nucleus, mitochondria and Golgi apparatus). bd, Fluorescence lifetime multiplexing of U-2 OS cells expressing CEP41 as a HaloTag9 fusion and the outer mitochondrial membrane protein Tomm20 as a HaloTag11 fusion (b); CEP41 as a HaloTag9 and histone H2B as a HaloTag11 fusion (c); or H2B as a HaloTag7 fusion, Tomm20 as a HaloTag9 fusion, and the membrane-bound glycoprotein of the Golgi apparatus beta-1,4-galactosyltransferase (β4Gal-T1) as a HaloTag11 fusion (d). The different HaloTag variants were labeled with MaP618-CA (b,d) or MaP555-CA (c; 1 μM, 3 h). Representative composite, total intensity and individual images with the separated structures are given. Scale bars, 10 μm. e, Six-species image acquired by combining fluorescence lifetime multiplexing in both the MaP618 and MaP555 channel. U-2 OS cells expressing β4Gal-T1-HaloTag7, Tomm20-HaloTag9 and the lysosome-associated membrane glycoprotein 1 (LAMP1) as a HaloTag11 fusion, and the tyrosine protein kinase Lyn11 as a SNAP-tag fusion were labeled with MaP618-CA (1 μM, 2 h), MaP555-BG (2 μM, 2 h), MaP555-DNA (0.5 μM, 30 min) and MaP555-Actin (0.5 μM, 30 min). The composite, the total intensity and the six individual images with the separated structures are given. Representative images of two experiments are shown. Scale bars, 10 μm.
Fig. 3
Fig. 3. Lifetime-based Fucci biosensor using HaloTag variants.
a, Schematic overview of the LT-Fucci(CA) biosensor. During the G1 phase, mainly HaloTag9-hCdt is present and the nuclei will therefore present long average photon arrival times (3.7 ns, orange). During S phase, HaloTag7-hGem is predominant, resulting in shorter average photon arrival times (3.1 ns, green) and during G2 and M phase a mixture of both will be present (~3.4 ns, light green). b, Representative FastFLIM image of U-2 OS cells stably expressing the LT-Fucci(CA) biosensor labeled with MaP618-CA (1 μM). Cells in three different cell stages can be found (orange arrowhead: G1, green arrowhead: S, light-green arrowhead: G2 and M). Scale bar, 50 μm. c, Fluorescence lifetime analysis of three nuclei from the image of LT-Fucci(CA) (b). The average fluorescence lifetime of the nuclei indicated was evaluated using phasor analysis and the respective clusters are given in the phasor plots. In addition, the overlay of all three phasor plots was used to evaluate the percentages of hGem and hCdt present in the G2/M-phase cell. As the fluorescence of a G2/M-phase cell shows contributions from the two individual components HaloTag7-hGem and HaloTag9-hCdt, the law of linear addition in phasor space can be applied. d, Enlargement of the dotted box in b showing the division of a cell over time. The dividing cell (light-green arrowhead), the two daughter cells (orange arrowhead) and the moment of nuclear envelope breakdown (NEBD) are indicated (Supplementary Video 1). Scale bars, 25 μm. e, LT-Fucci(CA) labeled with MaP555-CA (200 nM) generating a different color variant of the biosensor. The fluorescence lifetimes found for the different cell populations by phasor analysis were 2.9 ns (G1), 2.7 ns (G2/M) and 2.5 ns (S). Due to the lower fluorogenicity of MaP555-CA compared with MaP618-CA, there was also a larger contribution of background fluorescence. Scale bars, 50 μm.
Extended Data Fig. 1
Extended Data Fig. 1. HaloTag7 engineering strategy and results.
a Schematic representation of the in vitro engineering of HaloTag7. Site-saturation mutagenesis was performed onto the plasmid containing Hisx10-HaloTag7-EGFP using degenerate primers and Gibson cloning. The plasmid library (for example P174X) was transformed in E. coli for protein production and extraction. The cell lysate (protein concentration estimated via EGFP signal: 50-150 nm) was labeled with a limiting amount of SiR-CA (5 nm) and screened for increases in fluorescence intensity compared to HaloTag7. Brighter or dimmer hits (increased/decreased fluorescence intensity of SiR on variants in comparison to SiR on HaloTag7) were sequenced and validated in a separate fluorescence assay using purified protein. For visibility EGFP is not shown in the expressed and labeled protein libraries. b and d Outcome of the first round of screening. Brighter variants in (b) and dimmer variants in (d). Validated hits are given with their fluorescence intensity change (ΔIvar-EGFP = (IvarIHalo) · IHalo−1, mean, N = 3 samples). c Outcome of the second and third round of screening. Validated hits are given with their fluorescence intensity change (ΔIvar-EGFP, mean, N = 3 samples, Supplementary Table 1-2).
Extended Data Fig. 2
Extended Data Fig. 2. Summary of intensity weighted fluorescence lifetimes of HaloTag variants on different subcellular targets.
a HaloTag variants or HaloTag7 labeled with MaP618-CA. b HaloTag variants or HaloTag7 labeled with MaP555-CA. Overall fluorescent lifetimes were relatively stable over different subcellular targets and most stable for HaloTag7 and HaloTag9 fusions. HaloTag10 and HaloTag11 fusions showed more fluctuations. CEP41 of HaloTag7, HaloTag10, and HaloTag11 show larger changes in fluorescence lifetime for MaP618-CA and MaP555-CA compared to other fusion proteins.
Extended Data Fig. 3
Extended Data Fig. 3. Brightness comparison of HaloTag variants in mammalian cells by confocal microscopy.
a-i Violin plots of normalized fluorescence intensities from living U-2 OS cells stably expressing HaloTag7, HaloTag9, HaloTag10, or HaloTag11 in the cytosol. Cells were labeled with different fluorophores (1 μm, 3 h) and imaged by confocal microscopy. SiR-CA (a), JF635-CA (b), JF629-CA (c), JF626-CA (d), JF614-CA (e), CPY-CA (f), MaP618-CA (g), TMR-CA (h), and MaP555-CA (i). Distribution = light gray/blue, box = 25%–75% percentile, whiskers = 5%–95% percentile, white line = median, circle = mean, dashed line = mean of HaloTag7, N = 120, 121, 120, 121 (SiR); 120, 121, 120, 120 (JF635-CA); 129, 123, 114, 117 (JF629-CA); 121, 120, 120, 120 (JF626-CA); 120, 124, 120, 120 (JF614-CA); all 120 (CPY-CA); 120, 120, 120, 121 (MaP618-CA); 120, 120, 120, 121 (TMR-CA); 121, 120, 120, 120 (MaP555-CA) cells (left to right) from three independent preparations (Supplementary Table 16). Source data
Extended Data Fig. 4
Extended Data Fig. 4. Guidelines for performing fluorescence lifetime multiplexing using HaloTag variants.
a Overview over the differences in fluorescence lifetime between pairs of HaloTags using either MaP618-CA or MaP555-CA. For multiplexing of two species we generally recommend to use HaloTag9 and HaloTag11 (second/ third largest difference in fluorescence lifetime for MaP618-CA and MaP555-CA, respectively). b Representative phasor plots showing the clusters of HaloTag7, HaloTag9, HaloTag10, and HaloTag11 labeled with MaP618-CA or MaP555-CA. The triangles formed by three tags, their circumference, as well as the lifetime difference of the individual sides (ns) are given. In addition to the lifetime difference between the individual species, the shape of the triangle becomes important. Acute triangles (all angles α, β, γ < 90°) facilitate separation compared to obtuse triangles (one angle α > 90°), whose extreme is not a triangle but a straight line (α = 180°) and does not allow for separation of three species. For MaP618-CA the two combinations with the largest circumference correspond to obtuse triangles with α close to 180° (α » 90°) whereas the two combinations with the smaller circumference, even though still obtuse triangles, show α’s closer to 90° (α > 90°). A reasonable starting point would thus be to use HaloTag7, HaloTag9, and HaloTag11. For MaP555-CA the combination of HaloTag9, HaloTag10 and HaloTag11 shows both a large circumference and an α close to 90°. However, other factors are also of importance (see c). Separation of four components using the phasor approach solely based on lifetime information only becomes possible using transformation into higher harmonics. c The outcome of a multiplexing experiment depends on other factors that influence fluorescence lifetime and fluorophore brightness. Fluorescence lifetime can also be influenced by environmental factors such as the fusion protein, subcellular compartment, or fixatives. We showed that the fluorescence lifetime of all presented HaloTag variants as well as HaloTag7 is relatively robust to change in fusion protein, subcellular localization and also PFA fixation (Extended Data Fig. 2, Supplementary Fig. 11-12 and 29-30). However, it is recommended to prepare single species control samples. A second factor that influences multiplexing experiment is the relative photon number collected for each species. If one species is providing less photons (for example due to brightness or expression level) compared to the other(s), the relative intensity obtained after separation will be more erroneous. It is therefore recommended that the highest expressing species should carry HaloTag10 (least bright) and the lowest expressing species should carry HaloTag9 (the brightest; brightness: HaloTag9 > HaloTag7 > HaloTag11 > HaloTag10, Extended Data Fig. 3).
Extended Data Fig. 5
Extended Data Fig. 5. Multiplexed FLIM of the LT-Fucci(CA) and Raichu-RhoA-CR biosensors.
a-e The activity of the GTPase RhoA as well as the cell cycle stage were followed over time for dividing cells. FLIM images are given for both Raichu-RhoA-CR and LT-Fucci(CA) labeled with MaP618-CA (1 μm) along with a transmission light image and the phasor plot 1 h 20 min before cytokinesis (a), 30 min before cytokinesis (b), shortly after cytokinesis (c), and 1 h 20 min after cytokinesis (d). The FLIM images are color-coded according to the scales in (e). The two biosensors could be easily multiplexed measuring fluorescence lifetime in the GFP channel (Clover-Raichu-RhoA-CR) and the CPY channel (LT-Fucci(CA)-MaP618). As expected mitotic cells initially showed low RhoA activity indicated by long donor fluorescence lifetimes (2.7 ns). However, closer to cytokinesis RhoA activity started to increase (2.6 ns) until a donor fluorescence lifetime of 2.5 ns was reached directly after cytokinesis. After division the cells reached even higher RhoA activity (2.2 ns)69. Scale bar, 10 μm.

References

    1. Gregor, I & Patting, M. Pattern-based linear unmixing for efficient and reliable analysis of multicomponent TCSPC data. In Advanced Photon Counting (eds Kapusta, P. et al.). 51–70. Springer International, 2013.
    1. Digman MA, Caiolfa VR, Zamai M, Gratton E. The phasor approach to fluorescence lifetime imaging analysis. Biophys. J. 2008;94:L14–L16. - PMC - PubMed
    1. Vallmitjana A, et al. Resolution of 4 components in the same pixel in FLIM images using the phasor approach. Methods Appl. Fluoresc. 2020;8:035001. - PubMed
    1. Niehörster T, et al. Multi-target spectrally resolved fluorescence lifetime imaging microscopy. Nat. Methods. 2016;13:257–262. - PubMed
    1. Scipioni L, Rossetta A, Tedeschi G, Gratton E. Phasor S-FLIM: a new paradigm for fast and robust spectral fluorescence lifetime imaging. Nat. Methods. 2021;18:542–550. - PMC - PubMed

Publication types

MeSH terms