. 2021 Dec 8:14:427-440.
doi: 10.2147/IJNRD.S331484. eCollection 2021.

Profiling Biomarkers in HIV Glomerular Disease - Potential for the Non-Invasive Diagnosis of HIVAN?

Affiliations

Profiling Biomarkers in HIV Glomerular Disease - Potential for the Non-Invasive Diagnosis of HIVAN?

Saraladevi Naicker et al. Int J Nephrol Renovasc Dis. .

Abstract

Background: There is a wide spectrum of kidney pathology in human immunodeficiency virus (HIV) infection, affecting all structures of the kidney. The histology of HIV chronic kidney disease (CKD) is diverse, ranging from HIV-associated nephropathy (HIVAN) to focal glomerulosclerosis (FSGS), HIV-immune complex disease (HIV-ICD), other glomerulopathies and tubulo-interstitial nephritis. Definitive diagnosis is by kidney biopsy, an invasive procedure. However, serum and urinary biomarkers may be useful in predicting the histological diagnosis of HIVAN.

Purpose: We wished to determine the utility of serum and urinary biomarkers in predicting the histological diagnosis of HIVAN.

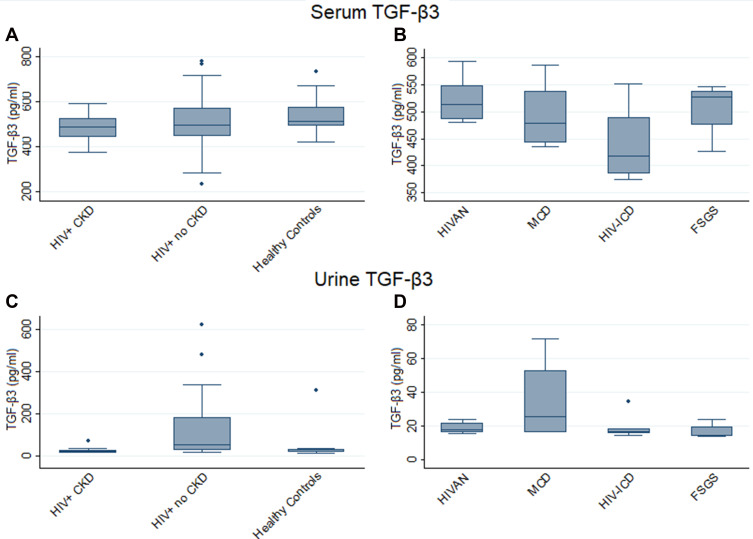
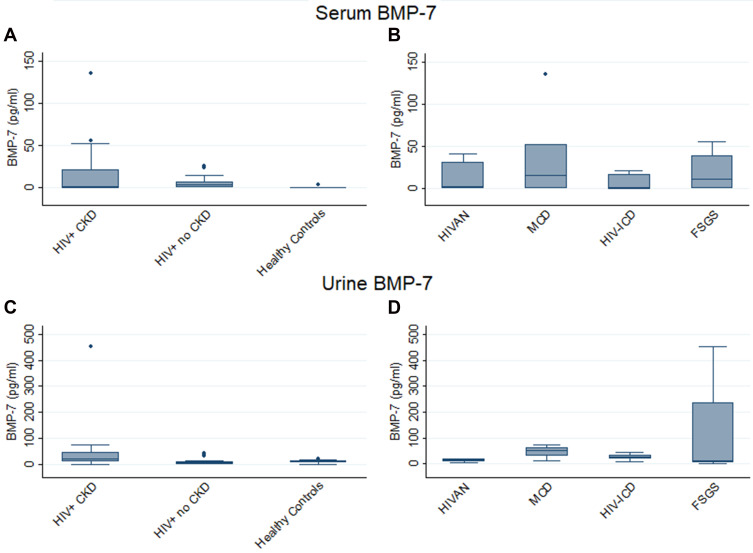
Patients and methods: We measured neutrophil gelatinase-associated lipocalin (NGAL), cystatin C, transforming growth factor (TGF)-β isoforms and bone morphogenetic protein (BMP)-7 in the serum and urine in patients with different histological forms of HIV glomerular disease.

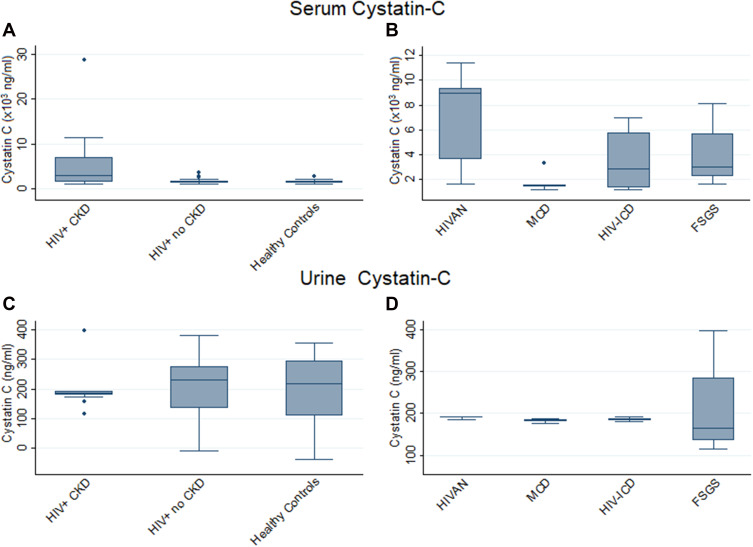
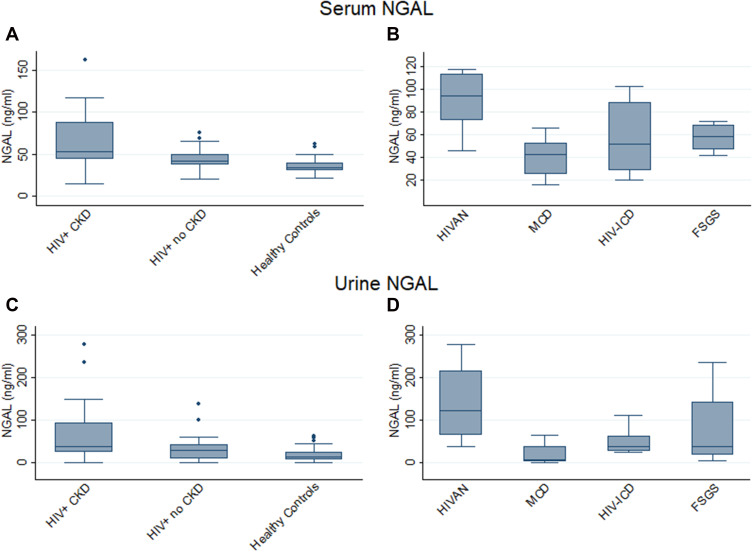
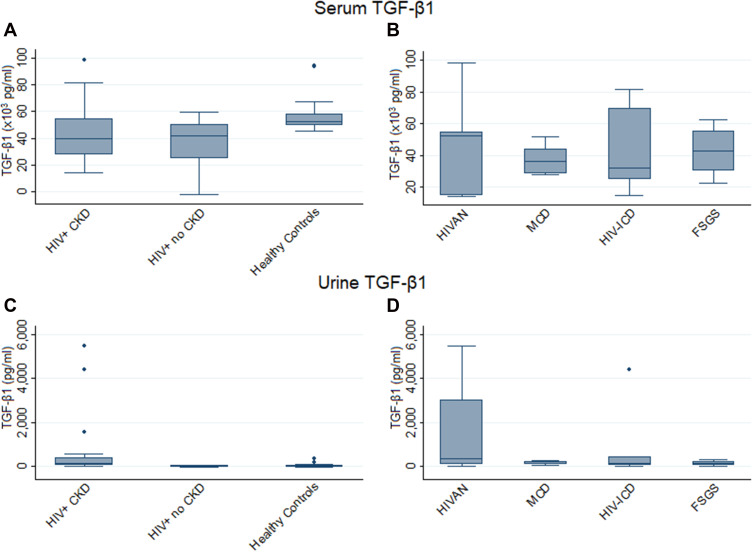
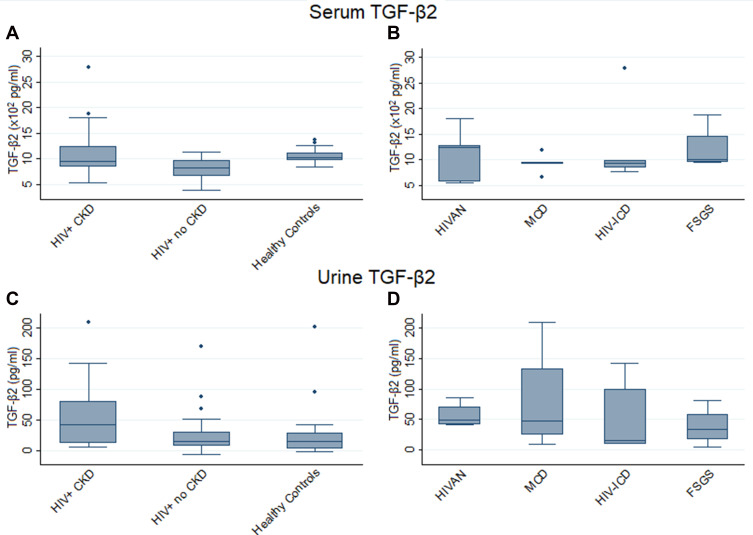
Results: In HIVAN, we demonstrated increased levels of serum cystatin C and increased levels of serum and urinary NGAL. Urinary TGF-β1 and TGF-β2 levels were elevated in HIV-positive patients with CKD but were not significantly different in the different HIV histologies, while urinary BMP-7 levels were elevated in minimal change disease.

Conclusion: This study confirmed the presence of increased serum and urinary biomarkers of tubular injury in patients with HIVAN, and increased urinary biomarkers of fibrosis in HIV CKD, and may indicate their value as a non-invasive diagnostic tool for the diagnosis of HIVAN.

Keywords: HIV chronic kidney disease; NGAL; bone morphogenetic protein (BMP)-7; cystatin C; neutrophil gelatinase-associated lipocalin; transforming growth factor (TGF)-β isoforms.


Conflict of interest statement

Professor Saraladevi Naicker report grants from Medical Research Council of South Africa (MRC), during the conduct of the study. The authors report no other conflicts of interest in this work.

Figures

Figure 1
Figure 1
Serum and urine Cystatin C levels in HIV+ CKD patients and Controls (A and C) and HIV+ CKD histological types (B and D). Horizontal lines within each box indicate median values with the boxes extending from the 25th to the 75th percentile. Whiskers denote values within 1.5 x IQR, and dots indicate outlier values outside this range. p-values for each graph calculated comparing all participants (A and C) or all HIV-positive CKD patients (B and D) using the Kruskal–Wallis test with post-hoc analysis performed pairwise using Dunn’s Multiple Comparison Test. Significant associations: (A) HIV+ CKD vs HIV+ no-CKD p=0.001; HIV+ CKD vs healthy controls p<0.001. (B) HIVAN vs MCD p=0.001; HIVAN vs HIV-ICD p=0.038; MCD vs FSGS p=0.053. (C) HIV+ CKD vs healthy controls p=0.043. (D) HIVAN vs MCD p=0.045; HIVAN vs FSGS p=0.012.
Figure 2
Figure 2
Serum and urine NGAL levels in HIV+ CKD patients and Controls (A and C) and HIV+ CKD histological types (B and D). Horizontal lines within each box indicate median values with the boxes extending from the 25th to the 75th percentile. Whiskers denote values within 1.5 x IQR, and dots indicate outlier values outside this range. p-values for each graph calculated comparing all participants (A and C) or all HIV-positive CKD patients (B and D) using the Kruskal–Wallis test with post-hoc analysis performed pairwise using Dunn’s Multiple Comparison Test. Significant associations: (A) HIV+ CKD vs HIV+ no-CKD p=0.031; HIV+ CKD vs healthy controls p<0.001; HIV+ no-CKD vs healthy controls p=0.016. (B) HIVAN vs MCD p=0.004; HIVAN vs HIV-ICD p=0.035. (C) HIV+ CKD vs healthy controls p=0.002; HIV+ no-CKD vs healthy controls p=0.026. (D) HIVAN vs MCD p=0.006.
Figure 3
Figure 3
Serum and urine TGF-β1 levels in HIV+ CKD patients and Controls (A and C) and HIV+ CKD histological types (B and D). Horizontal lines within each box indicate median values with the boxes extending from the 25th to the 75th percentile. Whiskers denote values within 1.5 x IQR, and dots indicate outlier values outside this range. p-values for each graph calculated comparing all participants (A and C) or all HIV-positive CKD patients (B and D) using the Kruskal–Wallis test with post-hoc analysis performed pairwise using Dunn’s Multiple Comparison Test. Significant associations: (A) HIV+ CKD vs healthy controls p=0.002; HIV+ no-CKD vs healthy controls p<0.001. (B) No significant associations. (C) HIV+ CKD vs HIV+ no-CKD p<0.001; HIV+ CKD vs healthy controls p<0.001. (D) No significant associations.
Figure 4
Figure 4
Serum and urine TGF-β2 levels in HIV+ CKD patients and Controls (A and C) and HIV+ CKD histological types (B and D). Horizontal lines within each box indicate median values with the boxes extending from the 25th to the 75th percentile. Whiskers denote values within 1.5 x IQR, and dots indicate outlier values outside this range. p-values for each graph calculated comparing all participants (A and C) or all HIV-positive CKD patients (B and D) using the Kruskal–Wallis test with post-hoc analysis performed pairwise using Dunn’s Multiple Comparison Test. Significant associations: (A) HIV+ CKD vs HIV+ no-CKD p=0.008; HIV+ CKD vs healthy controls p=0.053; HIV+ no-CKD vs healthy controls p<0.001. (B) No significant associations. (C) HIV+ CKD vs HIV+ no-CKD p=0.008; HIV+ CKD vs healthy controls p=0.002. (D) No significant associations.
Figure 5
Figure 5
Serum and urine TGF-β3 levels in HIV+ CKD patients and Controls (A and C) and HIV+ CKD histological types (B and D). Horizontal lines within each box indicate median values with the boxes extending from the 25th to the 75th percentile. Whiskers denote values within 1.5 x IQR, and dots indicate outlier values outside this range. p-values for each graph calculated comparing all participants (A and C) or all HIV-positive CKD patients (B and D) using the Kruskal–Wallis test with post-hoc analysis performed pairwise using Dunn’s Multiple Comparison Test. Significant associations: (A) HIV+ CKD vs healthy controls p=0.029. (B) HIVAN vs HIV-ICD p=0.012; HIV-ICD vs FSGS p=0.044. (C) HIV+ CKD vs HIV+ no-CKD p<0.001; HIV+ no-CKD vs healthy controls p=0.001. (D) MCD vs FSGS p=0.016.
Figure 6
Figure 6
Serum and urine BMP-7 levels in HIV+ CKD patients and Controls (A and C) and HIV+ CKD histological types (B and D). Horizontal lines within each box indicate median values with the boxes extending from the 25th to the 75th percentile. Whiskers denote values within 1.5 x IQR, and dots indicate outlier values outside this range. p-values for each graph calculated comparing all participants (A and C) or all HIV-positive CKD patients (B and D) using the Kruskal–Wallis test with post-hoc analysis performed pairwise using Dunn’s Multiple Comparison Test. Significant associations: (A) HIV+ CKD vs healthy controls p<0.001; HIV+ no-CKD vs healthy controls p=0.001. (B) No significant associations. (C) HIV+ CKD vs HIV+ no-CKD p<0.001; HIV+ CKD vs healthy controls p=0.004; HIV+ no-CKD vs healthy controls p=0.042. (D) HIVAN vs MCD p=0.030; MCD vs FSGS p=0.048.

References

    1. Rao TK, Fillippone EJ, Nicastri AD, et al. Associated Focal and Segmental Glomerulosclerosis in the Acquired Immunodeficiency Syndrome. New Engl J Med. 1984;310(11):669–673. PMID: 6700641. doi:10.1056/NEJM198403153101101 - DOI - PubMed
    1. Carbone L, D’Agati V, Cheng JT, Appel GB. Course and prognosis of human immunodeficiency virus-associated nephropathy. Am J Med. 1989;87(4):389–395. PMID: 2801729. doi:10.1016/s0002-9343(89)80819-8 - DOI - PubMed
    1. Swanepoel CR, Atta MG, D’Agati VD, et al. Kidney disease in the setting of HIV infection: conclusions from a Kidney Disease: improving Global Outcomes (KDIGO) Controversies Conference. Kidney Int. 2018;93(3):545–559. PMID: 29398134. doi:10.1016/j.kint.2017.11.007 - DOI - PMC - PubMed
    1. Han TM, Naicker S, Ramdial PK, Assounga AG. A cross-sectional study of HIV-seropositive patients with varying degrees of proteinuria in South Africa. Kidney Int. 2006;69(12):2243–2250. PMID: 16672914. doi:10.1038/sj.ki.5000339 - DOI - PubMed
    1. Fabian J, Naicker S, Venter WDF, et al. Urinary screening abnormalities in antiretroviral-naïve HIV-infected outpatients and implications for management- a single centre study in South Africa. Ethn Dis. 2009;S1:80–85. - PubMed