. 2021 Dec 10:14:9555-9565.
doi: 10.2147/IJGM.S338500. eCollection 2021.

Identification of the Potential Prognosis Biomarkers in Hepatocellular Carcinoma: An Analysis Based on WGCNA and PPI

Affiliations

Identification of the Potential Prognosis Biomarkers in Hepatocellular Carcinoma: An Analysis Based on WGCNA and PPI

Junting Huang et al. Int J Gen Med. .

Abstract

Aim: This study was done to determine biomarkers for the prognostic prediction of hepatocellular carcinoma (HCC).

Materials and methods: In the Gene Expression Omnibus, the gene expression profiles of HCC were downloaded. Biomarkers were identified by weighted gene co-expression network analysis and protein-protein interaction network analysis.

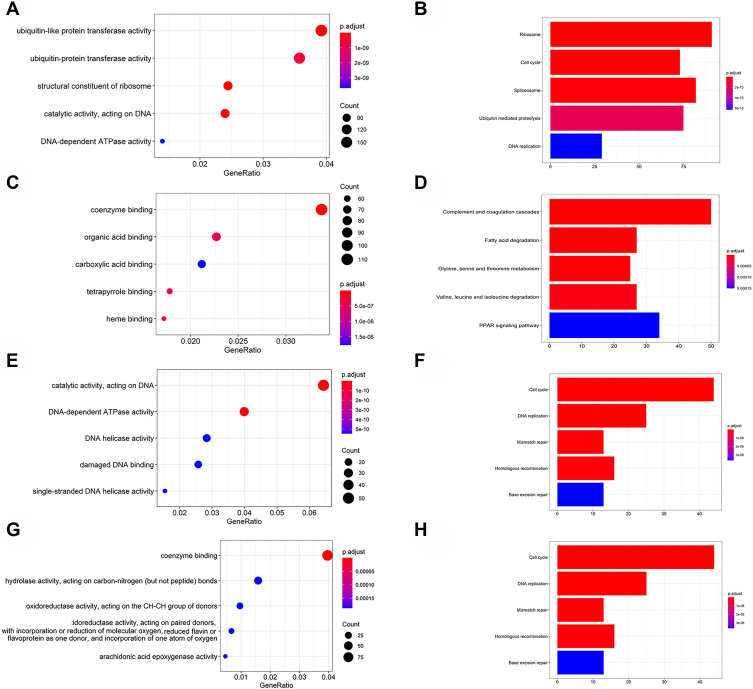
Results: There were 24 modules, which were characterized by the high correlation with HCC. Meanwhile, through enrichment analysis, differentially expressed genes were largely participated in the ubiquitination and autophagy processes. Moreover, PRC1, TOP2A and CKAP2L may be the hub genes involved in HCC tumorigenesis, and their biomarker roles were further demonstrated via Gene Expression Profiling Interactive Analysis (GEPIA) and Oncomine databases. In addition, the levels of PRC1, TOP2A and CKAP2L were obviously up-regulated in the sera of HCC patients.

Conclusion: PRC1, TOP2A and CKAP2L may serve as biomarkers for the prognostic prediction of HCC patients.

Keywords: PPI; WGCNA; biomarker; hepatocellular carcinoma; prognosis.


Conflict of interest statement

The authors declare that they have no competing interests.

Figures

Figure 1
Figure 1
Study design. Flowchart of data collection, preprocessing, analysis and validation.
Figure 2
Figure 2
Use Weighted Gene Co-expression Network Analysis (WGCNA) to determine the soft threshold power (β). (A) Clustering’s expression data was from the differentially expressed genes between HCC (n = 115) and adjacent normal (n = 52) tissues. (B) Scale-free topology model fitting index (R2, y-axis). (C) Average connectivity of diverse soft-thresholding powers, where the red Arabic numerals indicate the soft thresholds. We determine β = 4, so as to balance the maximizing R2 and maintaining a high average number of connections.
Figure 3
Figure 3
Identify modules related to HCC tumorigenesis. (A) Dendrogram of differentially expressed genes clustered based on a dissimilarity measure (1-TOM). (B) Adjacent heatmap of characteristic genes of different modules. (C) Heatmap of the correlation between the characteristic genes of the module and the clinical characteristics of HCC.
Figure 4
Figure 4
GO and KEGG enrichment analysis of genes in the total module. (A and B) Enrichment results of all up-regulated genes via GO and KEGG analysis. (C and D) Enrichment results of all down-regulated genes via GO and KEGG analysis. GO and KEGG analysis of the 24 identified modules showed that the yellow modules (E and F) and black modules (G and H) were highly correlated with the cell cycle. The enrichment score is represented by the size of the bubble or the length of the column, and the enrichment meaning is represented by the color.
Figure 5
Figure 5
Common hub genes in co-expression network and PPI network. (A) Venn diagram showed the hub genes in the co-expression network and the PPI network, in which three common network genes were further analyzed and verified. (B) Three selected genes were involved in the same cluster in the PPI network using Markov Clustering (MCL) algorithm (inflation parameter=5).
Figure 6
Figure 6
Hub gene verification in GEPIA. (AC) Gene expression levels of the hub genes between tumors and normal tissues. (A) PRC1, (B) TOP2A, (C) CKAP2L. (DF) Survival analysis of the hub genes in HCC. (D) PRC1, (E) TOP2A, (F) CKAP2L. The red line indicates high gene expression, and the blue line represents low gene expression. *P < 0.05.
Figure 7
Figure 7
The hub genes in Oncomine and THPA database. (AC) Expression level of the hub genes in tumor tissue and paired normal tissue based on Oncomine database. (A) PRC1, (B) TOP2A, (C) CKAP2L. (DF) Expression of three hub genes in HCC samples and normal tissues in THPA. (D) PRC1, (E) TOP2A, (F) CKAP2L.
Figure 8
Figure 8
Validation of qRT-PCR. (A) Serum PRC1 level, (B) Serum TOP2A level, (C) Serum CKAP2L level. ***P < 0.001.

References

    1. Siegel R, Miller K, Jemal AJ. Cancer statistics, 2016. CA Cancer J Clin. 2020;70(1):7–30. doi:10.3322/caac.21590 - DOI - PubMed
    1. Bray F, Ferlay J, Soerjomataram I, Siegel R, Torre L, Jemal AJ. Global cancer statistics 2018: GLOBOCAN estimates of incidence and mortality worldwide for 36 cancers in 185 countries. CA Cancer J Clin. 2018;68(6):394–424. doi:10.3322/caac.21492 - DOI - PubMed
    1. Wang W, Wei CJG. Advances in the early diagnosis of hepatocellular carcinoma. Genes Dis. 2020;7(3):308–319. doi:10.1016/j.gendis.2020.01.014 - DOI - PMC - PubMed
    1. Yang N, Ekanem N, Sakyi C, Ray SJ. Hepatocellular carcinoma and microRNA: new perspectives on therapeutics and diagnostics. Adv Drug Deliv Rev. 2015;81:62–74. doi:10.1016/j.addr.2014.10.029 - DOI - PubMed
    1. Bai K, He S, Shu L, et al. Identification of cancer stem cell characteristics in liver hepatocellular carcinoma by WGCNA analysis of transcriptome stemness index. Cancer Med. 2020;9(12):4290–4298. doi:10.1002/cam4.3047 - DOI - PMC - PubMed