. 2021 Nov 30:12:740298.
doi: 10.3389/fneur.2021.740298. eCollection 2021.

Characterizing the Neuroimaging and Histopathological Correlates of Cerebral Small Vessel Disease in Spontaneously Hypertensive Stroke-Prone Rats

Affiliations

Characterizing the Neuroimaging and Histopathological Correlates of Cerebral Small Vessel Disease in Spontaneously Hypertensive Stroke-Prone Rats

Yousef Hannawi et al. Front Neurol. .

Abstract

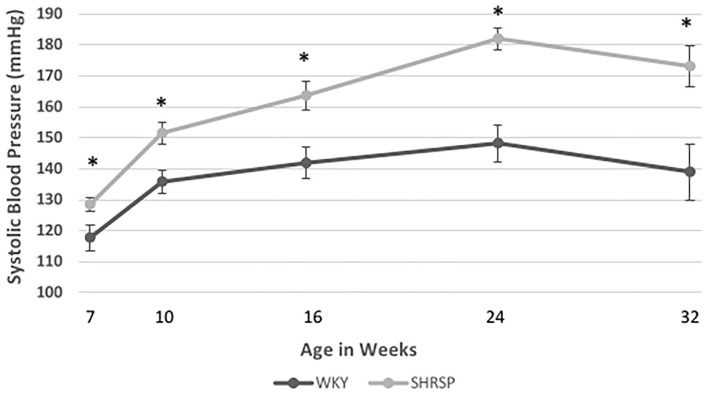
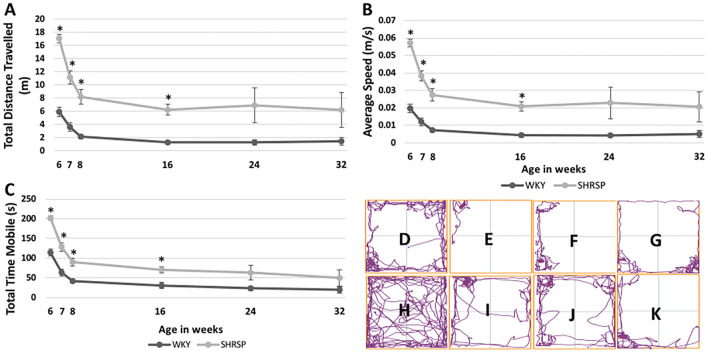
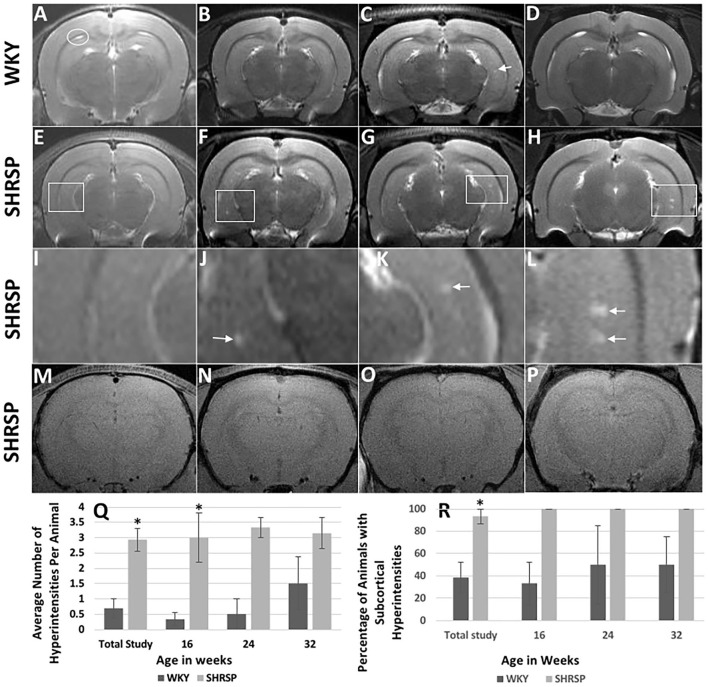
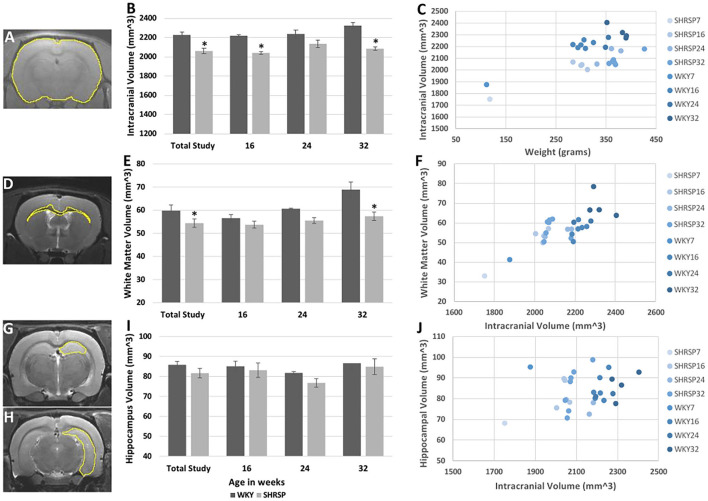
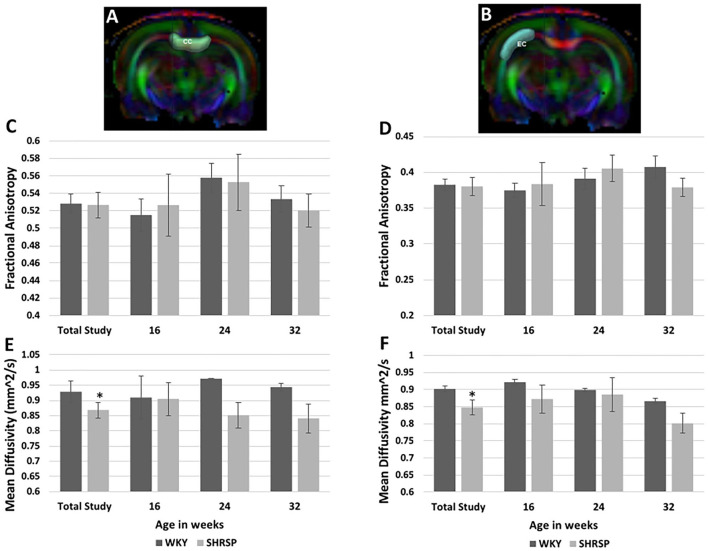
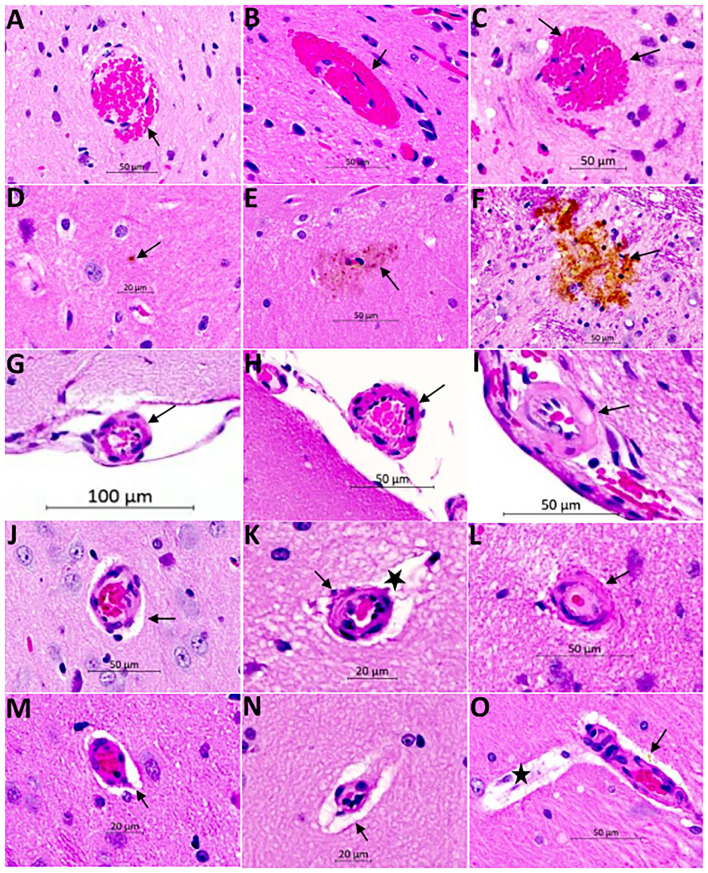
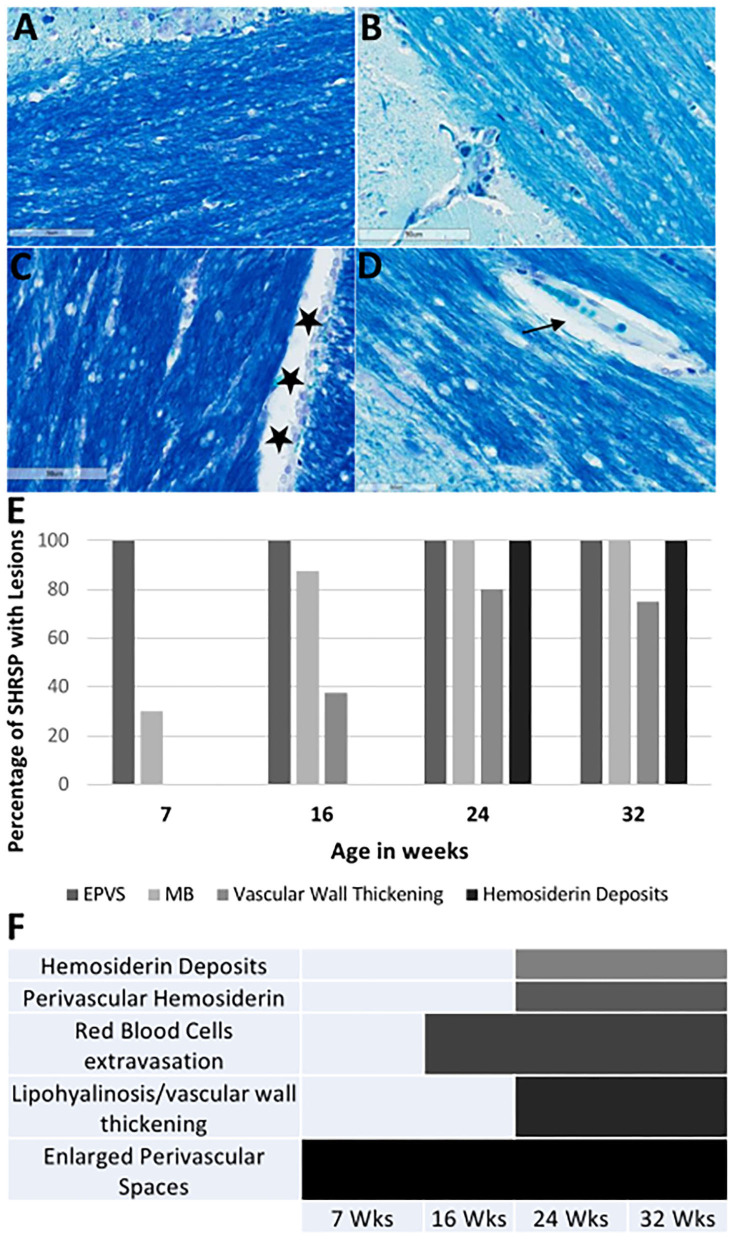
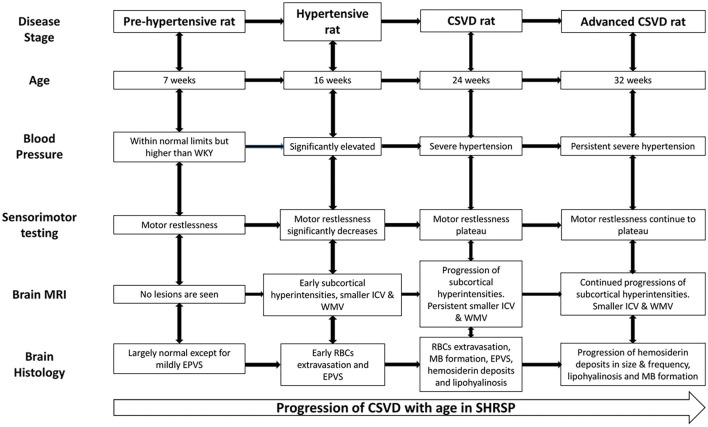
Introduction: Spontaneously hypertensive stroke-prone rats (SHRSP) are used to model clinically relevant aspects of human cerebral small vessel disease (CSVD). To decipher and understand the underlying disease dynamics, assessment of the temporal progression of CSVD histopathological and neuroimaging correlates is essential. Materials and Methods: Eighty age-matched male SHRSP and control Wistar Kyoto rats (WKY) were randomly divided into four groups that were aged until 7, 16, 24 and 32 weeks. Sensorimotor testing was performed weekly. Brain MRI was acquired at each study time point followed by histological analyses of the brain. Results: Compared to WKY controls, the SHRSP showed significantly higher prevalence of small subcortical hyperintensities on T2w imaging that progressed in size and frequency with aging. Volumetric analysis revealed smaller intracranial and white matter volumes on brain MRI in SHRSP compared to age-matched WKY. Diffusion tensor imaging (DTI) showed significantly higher mean diffusivity in the corpus callosum and external capsule in WKY compared to SHRSP. The SHRSP displayed signs of motor restlessness compared to WKY represented by hyperactivity in sensorimotor testing at the beginning of the experiment which decreased with age. Distinct pathological hallmarks of CSVD, such as enlarged perivascular spaces, microbleeds/red blood cell extravasation, hemosiderin deposits, and lipohyalinosis/vascular wall thickening progressively accumulated with age in SHRSP. Conclusions: Four stages of CSVD severity in SHRSP are described at the study time points. In addition, we find that quantitative analyses of brain MRI enable identification of in vivo markers of CSVD that can serve as endpoints for interventional testing in therapeutic studies.

Keywords: Wistar Kyoto Rat; cerebral small vessel disease; magnetic resonance imaging; sensorimotor testing; spontaneously hypertensive stroke prone rat.


Conflict of interest statement

The authors declare that the research was conducted in the absence of any commercial or financial relationships that could be construed as a potential conflict of interest.

Figures

Figure 1
Figure 1
Temporal changes of systolic blood pressure (SBP) in WKY and SHRSP mm Hg (millimeter of mercury) at 7 (21 WKY, 17 SHRSP), 10 (26 WKY, 23 SHRSP), 16 (15 WKY, 15 SHRSP), 24 (8 WKY, 5 SHRSP), and 32 (7 WKY, 5 SHRSP) weeks of age. Throughout the experiment, SHRSP had statistically significant higher SBP compared to WKY. At the beginning of the experiment, SHRSPs were still not hypertensive. Subsequently, SHRSP developed hypertension which was sustained throughout their lifespan. Data are presented as means and standard errors. WKY, Wistar Kyoto Rats; SHRSP, Spontaneously Hypertensive Stroke-Prone Rats (* represents statistical significant difference of P < 0.05).
Figure 2
Figure 2
Temporal changes of sensorimotor testing in WKY and SHRSP presented at 6, 7, 8, 16, 24, and 32 weeks of age. Compared to WKY, SHRSP were found to have motor restlessness as represented by a longer total distance traveled during the testing period (A), higher average speed (B) and longer total mobile time (C). The differences between SHRSP and WKY, were statistically significant at 6, 7, 8, and 16 weeks of age while they became not statistically different afterwards. Head tracing of one WKY at [6 (D), 16 (E), 24 (F), and 32 (G) weeks of age] and one SHRSP at the same time points [6 (H), 16 (I), 24 (J), and 32 (K)] weeks of age is shown which visually demonstrates larger decrease in activity during the experiment in SHRSP compared to WKY. WKY, Wistar Kyoto Rats; SHRSP, Spontaneously Hypertensive Stroke-Prone Rats; m: meter; s, second, m/s, meter per second; *, statistically significant difference of P < 0.05.
Figure 3
Figure 3
Brain MRI findings in WKY and SHRSP including T2w imaging (A–L) and susceptibility weighted imaging (SWI) (M–P) at the study time points. Compared to WKY, brain MRI T2w imaging of SHRSP showed progression of subcortical hyperintensities with age in terms of number and size. (Q) and (R) show the increase in lesion numbers per animal and percentage of animals which had visible lesions. At 7 weeks of age, brain MRI did not show T2w imaging subcortical hyperintensities in WKY (A) and SHRSP (E). Early T2w imaging hyperintensities were seen in the hippocampus of SHRSP at 16 weeks (F) while they were largely absent in WKY (B). Faint subcortical hyperintensities were visible in some WKY at 24 [arrow in (C)] and 32 weeks of age while all SHRSP showed larger and more frequent subcortical hyperintensities at 24 (G) and 32 (H) weeks of age. White squares in (E–H) highlight areas of the hippocampi where subcortical hyperintensities were seen in SHRSP. (I–L) show four-time magnification of the areas within the white squares in (E–H). Figure (I) demonstrates normal magnified view of the hippocampus at 7 weeks of age. Arrow in J demonstrates small subcortical hyperintensity at 16 weeks of age while arrows in (K) and (L) demonstrate larger subcortical hyperintensities at 24 and 32 weeks of age reaching a maximum of 0.39 mm in diameter at 32 weeks of age (L). Both WKY and SHRSP showed dilatation of the cerebral spinal fluid folds between the hippocampus and corpus callosum [circle in (A)]. Microbleeds were not visible on SWI sequences in SHRSP throughout the experiment at 7 (M), 16 (N), 24 (O) and 32 (P), weeks of age. WKY, Wistar Kyoto Rats; SHRSP, Spontaneously Hypertensive Stroke-Prone Rats; * statistically significant difference of P < 0.05. Data represent the mean and standard error of the mean.
Figure 4
Figure 4
Volumetric analyses of the intracranial (A–C), white matter (D–F), and hippocampal (G–J) volumes in WKY and SHRSP show smaller volumes in SHRSP compared to WKY. Manual segmentation of one slice is shown on T1 sequence for the intracranial content (A), T2w imaging for the white matter (D), and hippocampus (G,H). The intracranial volume was statistically and significantly smaller in SHRSP compared to WKY in the total study and at the study time points (B). White matter volume was statistically and significantly smaller in SHRSP in both the total cohort and at 32 weeks (E). Finally, while the hippocampal volume was smaller in SHRSP, the difference was not statistically significant (I). Scatter plot presentation of the data is presented in (C), (F), and (J) in which SHRSP and WKY at each time point is presented with a distinct color. Figure (C) shows the difference between SHRSP and WKY using intracranial volume (vertical axis) and weight (horizontal axis). A lesser difference is seen using white matter volume (vertical axis) with intracranial volume on the horizontal axis (F). Finally, animals do not appear to be different according to the hippocampal volume (vertical axis) (J). WKY, Wistar Kyoto Rats; SHRSP, Spontaneously Hypertensive Stroke-Prone Rats; * Statistically significant difference of P < 0.05. Data in (B), (E), and (I) represent the mean and standard error of the mean.
Figure 5
Figure 5
Diffusion Tensor Imaging (DTI) analyses of the corpus callosum and external capsule in SHRSP and WKY show higher mean diffusivity (MD) values in WKY compared to SHRSP in both structures (E,F). This difference was only statistically significant in the total study animals. The fractional anisotropy (FA) was not statistically different between WKY and SHRSP in both structures (C,D). Segmentation of corpus callosum is shown on one slice of the color map in (A) (CC) and the external capsule segmentation is shown at the same level in (B) (EC). CC, corpus callosum; EC, external capsule; mm2/s: square millimeter per second; * statistically significant difference of P < 0.05. Data represent the mean and standard error of the mean.
Figure 6
Figure 6
Hematoxylin and Eosin (H&E) staining of the brain of SHRSP demonstrates CSVD lesions including extravasation of red blood cells and microbleed formation (A–C), hemosiderin deposition (D–F), thickening and hyalinization of vessel wall (G–L), and enlargement of the perivascular spaces (M–O). Sections were obtained from the mid sagittal brain area at the level of the dorsal and ventral hippocampus and images were captured at (20X) magnification. Early red blood cells extravasation is encountered consistently at 16 weeks of age [arrow in (A)] which increases in size with age at 24 weeks [arrow in (B)] and 32 weeks [arrows in (C)]. Hemosiderin disposition is seen later in life at 24 weeks [arrows in (D) and (E)] and it increases in size at 32 weeks of age [arrow in (F)]. The small and medium size vessels in the subarachnoid space undergo structural changes showing wall thickening in SHRSP. These vessels appear normal at 7 weeks of age [arrow in (G)] while they develop mild thickening at 16 weeks of age [arrow in (H)] and lipohyalinosis at 24 weeks of age [arrow in (I)]. The penetrating small vessels undergo similar changes as well with age (J–L). They largely appear normal at 7 weeks of age (J), while mild thickening is seen at 16 weeks of age [arrow in (K)] and lipohyalinosis is seen at 24 weeks of age [arrow in (L)]. Enlargement of the perivascular spaces can be seen as early as 7 weeks [arrows in (J,M)] and they increase in size at 16 weeks [star in (K) and arrow in (N)] and 24 weeks [star in (O)]. Capillaries are often congested (M). Perivascular hemosiderin is another histopathological finding starting at 24 weeks [arrow in (O)].
Figure 7
Figure 7
Luxol fast blue (LFB) staining of the corpus callosum and the external capsule in WKY and SHRSP (A–D) at 40X magnification. Staining is negative for areas of demyelination. Normal view of the white matter is shown in WKY (A) and SHRSP (B) at 7 weeks of age. Stars in (C) shows an example of cerebral spinal fluid space dilation in a 32-week old WKY. We identified decrease in myelin in SHRSP surrounding the capillaries due to the expansion of the perivascular space [arrow in (D)]. The percentage of SHRSP at study time points with each of CSVD lesions are shown in (E). (F) Demonstrates the progression of these lesions across age. These results demonstrate that EPVS. are early findings while hemosiderin deposition occur later in life. SHRSP, spontaneously hypertensive stroke-prone rats; EPVS, enlarged perivascular spaces; MB, microbleed; Wks, weeks.
Figure 8
Figure 8
Cerebral small vessel disease (CSVD) stages in SHRSP across age. The pre-hypertensive rat does not show consistent evidence of CSVD except for mildly dilated perivascular spaces but they are restless during the sensorimotor testing. Subsequently, SHRSP develop significant hypertension and they show decrease in restlessness associated with the development of radiographic and histological features of CSVD. The figure details the CSVD correlates at each study time point from the hypertensive rat stage at 16 weeks until the advanced CSVD stage at 32 weeks of age. CSVD, cerebral small vessel disease; EPVS, enlarged perivascular spaces; ICV, intracranial volume; MB, microbleed; RBCs, red blood cell; SHRSP, spontaneously hypertensive stroke-prone rats; WKY, Wistar Kyoto rat; WMV, white matter volume.

References

    1. Pantoni L. Cerebral small vessel disease: from pathogenesis and clinical characteristics to therapeutic challenges. Lancet Neurol. (2010) 9:689–701. 10.1016/S1474-4422(10)70104-6 - DOI - PubMed
    1. Shi Y, Wardlaw JM. Update on cerebral small vessel disease: a dynamic whole-brain disease. Stroke Vasc Neurol. (2016) 1:83–92. 10.1136/svn-2016-000035 - DOI - PMC - PubMed
    1. Wardlaw JM, Smith EE, Biessels GJ, Cordonnier C, Fazekas F, Frayne R, et al. . Neuroimaging standards for research into small vessel disease and its contribution to ageing and neurodegeneration. Lancet Neurol. (2013) 12:822–38. 10.1016/S1474-4422(13)70124-8 - DOI - PMC - PubMed
    1. Bailey EL, Smith C, Sudlow CL, Wardlaw JM. Is the spontaneously hypertensive stroke prone rat a pertinent model of sub cortical ischemic stroke? A systematic review. Int J Stroke. (2011) 6:434–44. 10.1111/j.1747-4949.2011.00659.x - DOI - PubMed
    1. Hainsworth AH, Brittain JF, Khatun H. Pre-clinical models of human cerebral small vessel disease: utility for clinical application. J Neurol Sci. (2012) 322:237–40. 10.1016/j.jns.2012.05.046 - DOI - PubMed

LinkOut - more resources