. 2021 Nov 30:12:675352.
doi: 10.3389/fmicb.2021.675352. eCollection 2021.

Soybean Roots and Soil From High- and Low-Yielding Field Sites Have Different Microbiome Composition

Affiliations

Soybean Roots and Soil From High- and Low-Yielding Field Sites Have Different Microbiome Composition

Ananda Y Bandara et al. Front Microbiol. .

Abstract

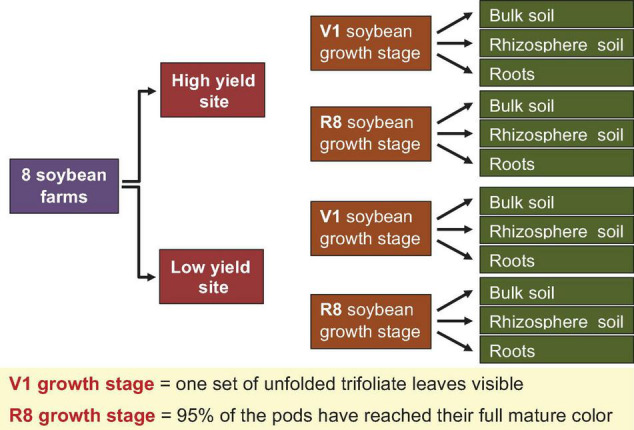
The occurrence of high- (H) and low- (L) yielding field sites within a farm is a commonly observed phenomenon in soybean cultivation. Site topography, soil physical and chemical attributes, and soil/root-associated microbial composition can contribute to this phenomenon. In order to better understand the microbial dynamics associated with each site type (H/L), we collected bulk soil (BS), rhizosphere soil (RS), and soybean root (R) samples from historically high and low yield sites across eight Pennsylvania farms at V1 (first trifoliate) and R8 (maturity) soybean growth stages (SGS). We extracted DNA extracted from collected samples and performed high-throughput sequencing of PCR amplicons from both the fungal ITS and prokaryotic 16S rRNA gene regions. Sequences were then grouped into amplicon sequence variants (ASVs) and subjected to network analysis. Based on both ITS and 16S rRNA gene data, a greater network size and edges were observed for all sample types from H-sites compared to L-sites at both SGS. Network analysis suggested that the number of potential microbial interactions/associations were greater in samples from H-sites compared to L-sites. Diversity analyses indicated that site-type was not a main driver of alpha and beta diversity in soybean-associated microbial communities. L-sites contained a greater percentage of fungal phytopathogens (ex: Fusarium, Macrophomina, Septoria), while H-sites contained a greater percentage of mycoparasitic (ex: Trichoderma) and entomopathogenic (ex: Metarhizium) fungal genera. Furthermore, roots from H-sites possessed a greater percentage of Bradyrhizobium and genera known to contain plant growth promoting bacteria (ex: Flavobacterium, Duganella). Overall, our results revealed that there were differences in microbial composition in soil and roots from H- and L-sites across a variety of soybean farms. Based on our findings, we hypothesize that differences in microbial composition could have a causative relationship with observed within-farm variability in soybean yield.

Keywords: bacterial 16S rRNA; fungal ITS; metabarcoding; metagenomics; microbiome; soybean; spatial yield variation.


Conflict of interest statement

The authors declare that the research was conducted in the absence of any commercial or financial relationships that could be construed as a potential conflict of interest.

Figures

FIGURE 1
FIGURE 1
Strategy adopted for sample collection. Bulk soil, rhizosphere soil, and roots were collected from one farmer designated high and one low yield site at V1 (one set of unfolded trifoliate leaf is visible) and R8 (95% of the pods have reached their mature color) soybean growth stages from eight soybean farms in Pennsylvania.
FIGURE 2
FIGURE 2
Network of taxon associations for bulk soil samples. Co-occurrence of fungal and prokaryotic taxa for high yield sites at V1 soybean growth stage (A), low yield sites at V1 soybean growth stage (B), high yield sites at R8 soybean growth stage (C), and low yield sites at R8 soybean growth stage (D). Nodes represent exact sequence variants (ESVs). Colors represent specific phyla. Shapes represent specific domains. Red solid lines (edges/links) connecting nodes indicate statistically significant negative correlations, and solid blue lines, positive correlations between the connected taxa. Node sizes are proportional to the degree (=node connectivity). Nodes with degree ≥5 were included in the network for the purpose of visualization clarity.
FIGURE 3
FIGURE 3
Network of taxon associations for rhizosphere soil samples. Co-occurrence of fungal and prokaryotic taxa for high yield sites at V1 soybean growth stage (A), low yield sites at V1 soybean growth stage (B), high yield sites at R8 soybean growth stage (C), and low yield sites at R8 soybean growth stage (D). Nodes represent exact sequence variants (ESVs). Colors represent specific phyla. Shapes represent specific domains. Red solid lines (edges/links) connecting nodes indicate statistically significant negative correlations, and solid blue lines, positive correlations between the connected taxa. Node sizes are proportional to the degree (=node connectivity). Nodes with degree ≥5 were included in the network for the purpose of visualization clarity.
FIGURE 4
FIGURE 4
Network of taxon associations for root samples. Co-occurrence of fungal and prokaryotic taxa for high yield sites at V1 soybean growth stage (A), low yield sites at V1 soybean growth stage (B), high yield sites at R8 soybean growth stage (C), and low yield sites at R8 soybean growth stage (D). Nodes represent exact sequence variants (ESVs). Colors represent specific phyla. Shapes represent specific domains. Red solid lines (edges/links) connecting nodes indicate statistically significant negative correlations, and solid blue lines, positive correlations between the connected taxa. Node sizes are proportional to the degree (=node connectivity).
FIGURE 5
FIGURE 5
Principal Coordinates Analysis (PCoA) of ASVs based on Bray-Curtis dissimilarity for ITS-bulk soil (A), ITS-rhizosphere soil (B), ITS-roots (C), 16S rRNA-bulk soil (D), 16S rRNA-rhizosphere soil (E), and 16S rRNA-roots (F). Marker shape and color indicate site type (high/low yield) and soybean growth stage (V1 = one set of unfolded trifoliate leaf is visible; R8 = 95% of the pods have reached their mature color), respectively.
FIGURE 6
FIGURE 6
The heat map analysis of ASVs based on average linkage clustering for ITS-bulk soil (A), ITS-rhizosphere soil (B), ITS-roots (C), 16S rRNA-bulk soil (D), 16S rRNA-rhizosphere soil (E), and 16S rRNA-roots (F). The purple, red, green, and blue color boxes indicate the low yield site, high yield site, V1 soybean growth stage (one set of unfolded trifoliate leaf is visible), and R8 soybean growth stage (95% of the pods have reached their mature color), respectively. Note that, based on both ITS and 16S rRNA OTU data sets, there is no clear clustering of samples (bulk soil, rhizosphere soil, and soybean roots) based on either site type or soybean growth stage.
FIGURE 7
FIGURE 7
Bar graphs depicting the impact of studied variables on mean α-diversity measures. Designation of the significant mean difference in panel (A) was based on Fisher’s least significant difference (LSD). Same for panels (B,C) were based on the adjustment for multiple comparisons using Tukey-Kramer test at the 5% level of significance (=5% experiment wise error rate). Error bars represent standard errors. Means followed by a common letter within each letter type (i.e., uppercase, lowercase, and italic) are not significantly different. V1 = one set of unfolded trifoliate leaf is visible; R8 = 95% of the pods have reached their mature color.
FIGURE 8
FIGURE 8
Stacked bar plots showing the mean relative abundance of major fungal phyla for (A) bulk soil, (B) rhizosphere soil, and (C) soybean root samples collected from high and low yield sites at V1 (one set of unfolded trifoliate leaf is visible) and R8 (95% of the pods have reached their mature color) soybean growth stages across eight soybean farms in Pennsylvania.
FIGURE 9
FIGURE 9
Stacked bar plots showing the mean relative abundance of major fungal genera for (A) bulk soil, (B) rhizosphere soil, and (C) soybean root samples collected from high and low yield sites at V1 (one set of unfolded trifoliate leaf is visible) and R8 (95% of the pods have reached their mature color) soybean growth stages across eight soybean farms in Pennsylvania.
FIGURE 10
FIGURE 10
Stacked bar plots showing the mean relative abundance of major prokaryotic phyla for (A) bulk soil, (B) rhizosphere soil, and (C) soybean root samples collected from high and low yield sites at V1 (one set of unfolded trifoliate leaf is visible) and R8 (95% of the pods have reached their mature color) soybean growth stages across eight soybean farms in Pennsylvania.
FIGURE 11
FIGURE 11
Stacked bar plots showing the mean relative abundance of major prokaryotic genera for (A) bulk soil, (B) rhizosphere soil, and (C) soybean root samples collected from high and low yield sites at V1 (one set of unfolded trifoliate leaf is visible) and R8 (95% of the pods have reached their mature color) soybean growth stages across eight soybean farms in Pennsylvania.

References

    1. Agler M. T., Ruhe J., Kroll S., Morhenn C., Kim S. T., Weigel D., et al. (2016). Microbial hub taxa link host and abiotic factors to plant microbiome variation. PLoS Biol. 14:e1002352. 10.1371/journal.pbio.1002352 - DOI - PMC - PubMed
    1. Aoki T., O’Donnell K., Scandiani M. M. (2005). Sudden death syndrome of soybean in South America is caused by four species of Fusarium: Fusarium brasiliense sp. nov., F. cuneirostrum sp. nov., F. tucumaniae, and F. virguliforme. Mycoscience 46 162–183. 10.1007/s10267-005-0235-y - DOI
    1. Arias M. D., Munkvold G. P., Ellis M. L., Leandro L. F. S. (2013). Distribution and frequency of Fusarium species associated with soybean roots in Iowa. Plant Dis. 97 1557–1562. 10.1094/PDIS-11-12-1059-RE - DOI - PubMed
    1. Bagwan N. B. (2010). Evaluation of Trichoderma compatibility with fungicides, pesticides, organic cakes and botanicals for integrated management of soil borne diseases of soybean [Glycine max (L.) Merril]. Int. J. Plant Prot. 3 206–209.
    1. Bai L., Cui J., Jie W., Cai B. (2015). Analysis of the community compositions of rhizosphere fungi in soybeans continuous cropping fields. Microbiol. Res. 180 49–56. 10.1016/j.micres.2015.07.007 - DOI - PubMed