

Mass spectrometric quantification of plasma glycosphingolipids in human GM3 ganglioside deficiency
- PMID: 34917767
- PMCID: PMC8669435
- DOI: 10.1016/j.clinms.2019.03.001
Mass spectrometric quantification of plasma glycosphingolipids in human GM3 ganglioside deficiency
Abstract
Background: Among Amish communities of North America, biallelic mutations of ST3GAL5 (c.694C > T) eliminate synthesis of GM3 and its derivative downstream a- and b-series gangliosides. Systemic ganglioside deficiency is associated with infantile onset psychomotor retardation, slow brain growth, intractable epilepsy, deafness, and cortical visual impairment. We developed a robust quantitative assay to simultaneously characterize glycan and ceramide moieties of plasma glycosphingolipids (GSLs) among ST3GAL5 c.694C > T homozygotes (n = 8), their heterozygous siblings (n = 24), and wild type control (n = 19) individuals.
Methods: Following extraction and saponification of total plasma lipids, GSLs were purified on a tC18 cartridge column, permethylated, and subjected to nanospray ionization mass spectrometry utilizing neutral loss scanning and data-dependent acquisition. Plasma GSLs were quantified against appropriate synthetic standards.
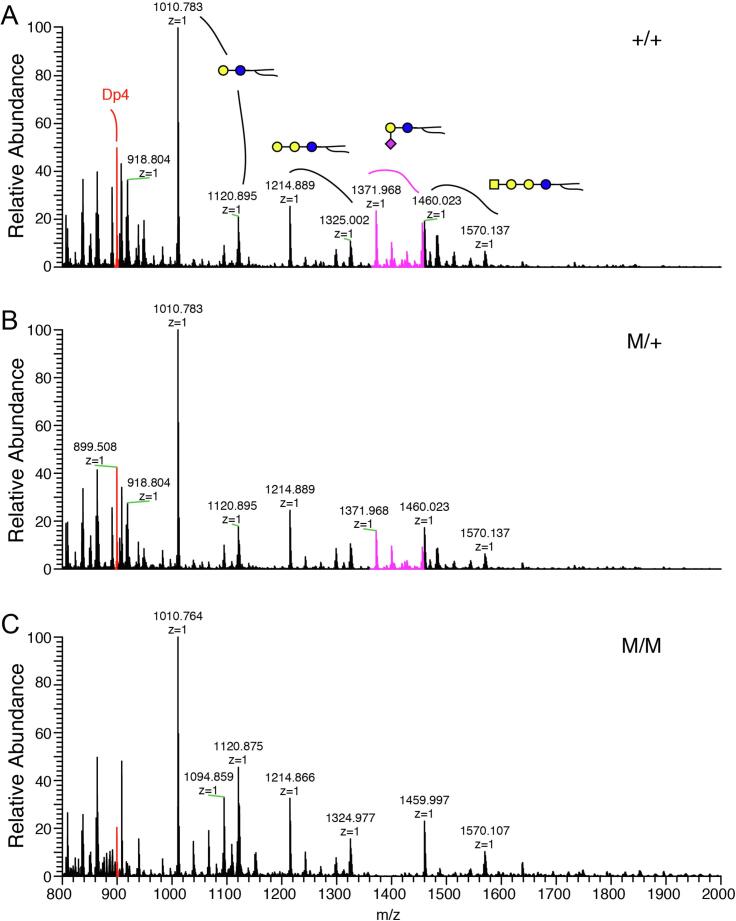
Results: Our method demonstrated linearity from 5 to 250 μl of plasma. Recovery of synthetic GSLs spiked into plasma was 99-104% with no matrix interference. Quantitative plasma GSL profiles discriminated among ST3GAL5 genotypes: GM3 and GD3 were undetectable in ST3GAL5 c.694C > T homozygotes, who had markedly elevated lactosylceramide (19.17 ± 4.20 nmol/ml) relative to heterozygous siblings (9.62 ± 2.46 nmol/ml) and wild type controls (6.55 ± 2.16 nmol/ml). Children with systemic ganglioside deficiency had a distinctive shift in ceramide composition toward higher mass species.
Conclusions: Our quantitative glycolipidomics method discriminates among ST3GAL5 c.694C > T genotypes, can reveal subtle structural heterogeneity, and represents a useful new strategy to diagnose and monitor GSL disorders in humans.
Keywords: CID, collision-induced dissociation; Cer, ceramide; Dp, degree of polymerization; EGCase, endoglycosylceramidase; ESI-MS, electrospray ionization mass spectrometry; GD3, disialo-ganglioside GD3 (IUPAC-IUB: II3- α -(Neu5Ac)2-Gg2Cer); GM1b, monosialo-ganglioside GM1b (IUPAC-IUB: IV3-α-Neu5Ac-Gg4Cer); GM3; GM3, monosialo-ganglioside GM3; GSL, glycosphingolipid; Gal, galactose; GalNAc, N-acetylgalactosamine; Ganglioside; Gb3, globotriaosylceramide (IUPAC-IUB: Gb3Cer); Gb3-D, deuterated Gb3; Gb4, globotetraosylceramide (IUPAC-IUB: Gb4Cer); Glc, glucose; GlcCer, glucosylceramide; Glycosphingolipid; LacCer, lactosylceramide; MS, mass spectrometry; MSn, multidimensional mass spectrometry; Mass spectrometry; NL, neutral loss; NSI, nanospray ionization; Neu5Ac, sialic acid as N-5-acetylneuraminic acid; Plasma; ST3GAL5, CMP-Neu5Ac:Lactosylceramide alpha-2,3-sialyltransferase 5, previously known as SIAT9, SIATGM3S, ST3GalV, GM3-synthase; TIM, total ion mapping; UPLC, ultra-high pressure liquid chromatography.
© 2019 Published by Elsevier B.V. on behalf of The Association for Mass Spectrometry: Applications to the Clinical Lab (MSACL).
Figures


References
-
- Boccuto L., Aoki K., Flanagan-Steet H., Chen C.F., Fan X., Bartel F., et al. A mutation in a ganglioside biosynthetic enzyme, st3gal5, results in salt & pepper syndrome, a neurocutaneous disorder with altered glycolipid and glycoprotein glycosylation. Hum. Mol. Genet. 2014;23:418–433. - PMC - PubMed
-
- Lee J.S., Yoo Y., Lim B.C., Kim K.J., Song J., Choi M., Chae J.H. Gm3 synthase deficiency due to st3gal5 variants in two korean female siblings: Masquerading as rett syndrome-like phenotype. Am. J. Med. Genet. A. 2016;170:2200–2205. - PubMed
-
- Simpson M.A., Cross H., Proukakis C., Priestman D.A., Neville D.C., Reinkensmeier G., et al. Infantile-onset symptomatic epilepsy syndrome caused by a homozygous loss-of-function mutation of gm3 synthase. Nat. Genet. 2004;36:1225–1229. - PubMed
-
- Wang H., Bright A., Xin B., Bockoven J.R., Paller A.S. Cutaneous dyspigmentation in patients with ganglioside gm3 synthase deficiency. Am. J. Med. Genet. A. 2013;161A:875–879. - PubMed
LinkOut - more resources
Full Text Sources
Research Materials
Miscellaneous