. 2021 Nov 27;24(12):103531.
doi: 10.1016/j.isci.2021.103531. eCollection 2021 Dec 17.

TranSNPs: A class of functional SNPs affecting mRNA translation potential revealed by fraction-based allelic imbalance

Affiliations

TranSNPs: A class of functional SNPs affecting mRNA translation potential revealed by fraction-based allelic imbalance

Samuel Valentini et al. iScience. .

Abstract

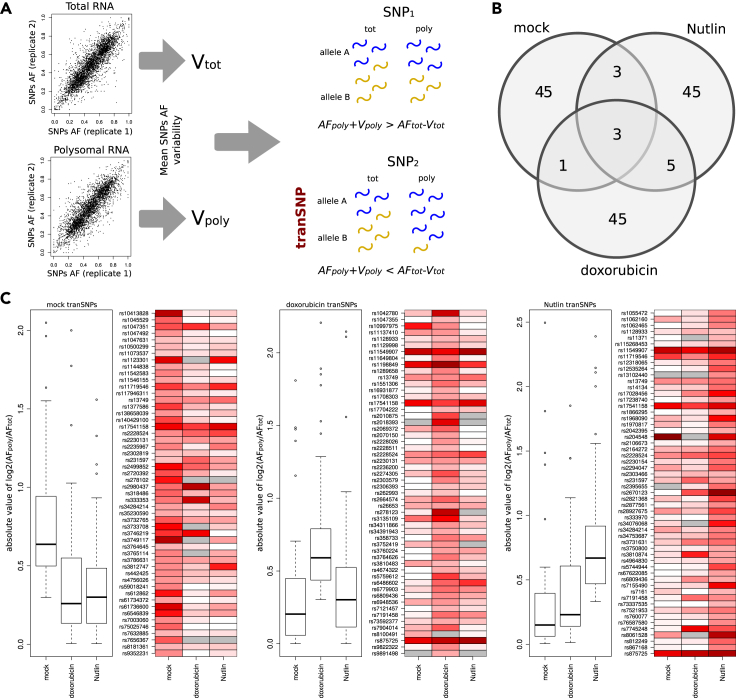
Few studies have explored the association between SNPs and alterations in mRNA translation potential. We developed an approach to identify SNPs that can mark allele-specific protein expression levels and could represent sources of inter-individual variation in disease risk. Using MCF7 cells under different treatments, we performed polysomal profiling followed by RNA sequencing of total or polysome-associated mRNA fractions and designed a computational approach to identify SNPs showing a significant change in the allelic balance between total and polysomal mRNA fractions. We identified 147 SNPs, 39 of which located in UTRs. Allele-specific differences at the translation level were confirmed in transfected MCF7 cells by reporter assays. Exploiting breast cancer data from TCGA we identified UTR SNPs demonstrating distinct prognosis features and altering binding sites of RNA-binding proteins. Our approach produced a catalog of tranSNPs, a class of functional SNPs associated with allele-specific translation and potentially endowed with prognostic value for disease risk.

Keywords: Computational bioinformatics; Molecular mechanism of gene regulation; Transcriptomics.


Conflict of interest statement

The authors declare no competing interests.

Figures

None
Graphical abstract
Figure 1
Figure 1
Identification of SNPs allelic imbalance across different RNA fractions (A) Schematic representation of the approach developed to identify RNA fraction-specific SNP allelic imbalances. RNA-seq-based SNP allelic fraction variability is estimated both in total and polysomal RNA fractions. Then variability extended SNP allelic fractions are compared and only non-overlapping total versus polysomal imbalances are retained as tranSNPs. In the example, SNP2 satisfies the condition and is hence nominated as tranSNP. AF, allelic fraction; V, mean AF variability among replicates. (B) Venn diagram showing private and shared tranSNPs identified across the three analyzed conditions. (C) Allelic imbalance distribution of condition-associated tranSNPs is shown across the different conditions. Aggregate distribution is shown using boxplots, whereas single SNPs distribution is shown using a heatmap, where red intensity represents the level of imbalance. In the boxplot, the imbalance is shown as absolute log2 ratio of allelic fraction in polysomal RNA and allelic fraction in total RNA. In the heatmap, red intensity is proportional to this value; gray represents no value.
Figure 2
Figure 2
TranSNPs results in functionally distinct alleles (A) MCF7 cells were transiently transfected with pGL4.13-based vectors containing BRI3BP 3′ UTR fragments differing for the indicated BRI3BP SNP allele, and the control pRLSV40 Renilla vector. After 24 h of transfection, cells were treated with Nutlin for 24 h before performing dual-luciferase assays. Firefly luciferase signals were normalized to Renilla to control for transfection efficiency and to relative Firefly mRNA levels to take into account differences in reporter's transcript levels. Individual values from independently transfected wells are plotted. (B) Same as (A), except that the p21-5′ UTR was cloned in the low-expression pGL3-basic vector. ∗∗p value < 0.01; ∗∗∗∗p value < 0.0001, adjusted p value based on a two-way ANOVA with Sidak's multiple comparison test. Data are represented as mean ± SD.
Figure 3
Figure 3
Prognostic significance of tranSNPs in breast cancer (A) Progression-Free Interval analysis of BRI3BP-related tranSNP. Kaplan-Meyer curves along with summary statistics are reported. (B–D) Examples of tranSNPs presenting prognostic significance. Kaplan-Meyer curves along with summary statistics are reported.
Figure 4
Figure 4
Haplotype structure and allelic imbalance along the ATF6 gene and impact of UTR TranSNPs (A) RNA-seq-based allelic fractions of ATF6 heterozygous SNPs are reported for both coding and 3′ UTR (in red) SNPs. On the top we show the distribution observed in the first biological replicate, and on the bottom we show the distribution observed in the second biological replicate. (B) Significance of ATF6 3′ UTR SNPs allelic imbalance (red line) versus distribution of sequential random SNPs imbalances. On top using heterozygous SNPs data from the first biological replicate, and on the bottom using data from the second biological replicate. (C) Dual-luciferase assays in MCF7 cells transiently transfected with reporter vectors containing ATF6 3′ UTR SNP alleles. Experiments were developed as described in Figure 2. ∗∗∗∗p value < 0.0001, adjusted p value based on a two-way ANOVA with Sidak's multiple comparison test. Data are represented as mean ± SD. (D) RIP experiment probing the interaction of PABPC1 with the ATF6 transcript. Bars plot the average fold enrichment relative to the input sample. Individual average values from three biological replicates are also shown. Results obtained with an IgG control antibody are included. ∗p value < 0.05, two-tailed, unpaired t test. Data are represented as mean ± SD.

References

    1. Abaev-Schneiderman E., Admoni-Elisha L., Levy D. SETD3 is a positive regulator of DNA-damage-induced apoptosis. Cell Death Dis. 2019;10 doi: 10.1038/s41419-019-1328-4. - DOI - PMC - PubMed
    1. Andreotti V., Bisio A., Bressac-de Paillerets B., Harland M., Cabaret O., Newton-Bishop J., Pastorino L., Bruno W., Bertorelli R., De Sanctis V., et al. The CDKN2A/p16(INK) (4a) 5’UTR sequence and translational regulation: impact of novel variants predisposing to melanoma. Pigment Cell Melanoma Res. 2016;29:210–221. doi: 10.1111/pcmr.12444. - DOI - PubMed
    1. Andrysik Z., Galbraith M.D., Guarnieri A.L., Zaccara S., Sullivan K.D., Pandey A., MacBeth M., Inga A., Espinosa J.M. Identification of a core TP53 transcriptional program with highly distributed tumor suppressive activity. Genome Res. 2017;27:1645–1657. doi: 10.1101/gr.220533.117. - DOI - PMC - PubMed
    1. Annunziato S., de Ruiter J.R., Henneman L., Brambillasca C.S., Lutz C., Vaillant F., Ferrante F., Drenth A.P., van der Burg E., Siteur B., et al. Comparative oncogenomics identifies combinations of driver genes and drug targets in BRCA1-mutated breast cancer. Nat. Commun. 2019;10:397. doi: 10.1038/s41467-019-08301-2. - DOI - PMC - PubMed
    1. Bailey S.D., Desai K., Kron K.J., Mazrooei P., Sinnott-Armstrong N.A., Treloar A.E., Dowar M., Thu K.L., Cescon D.W., Silvester J., et al. Noncoding somatic and inherited single-nucleotide variants converge to promote ESR1 expression in breast cancer. Nat. Genet. 2016;48:1260–1266. doi: 10.1038/ng.3650. - DOI - PMC - PubMed

LinkOut - more resources