. 2022 Dec;11(1):195-207.
doi: 10.1080/22221751.2021.2020598.

Pharmacologically induced endolysosomal cholesterol imbalance through clinically licensed drugs itraconazole and fluoxetine impairs Ebola virus infection in vitro

Affiliations

Pharmacologically induced endolysosomal cholesterol imbalance through clinically licensed drugs itraconazole and fluoxetine impairs Ebola virus infection in vitro

Susann Kummer et al. Emerg Microbes Infect. 2022 Dec.

Abstract

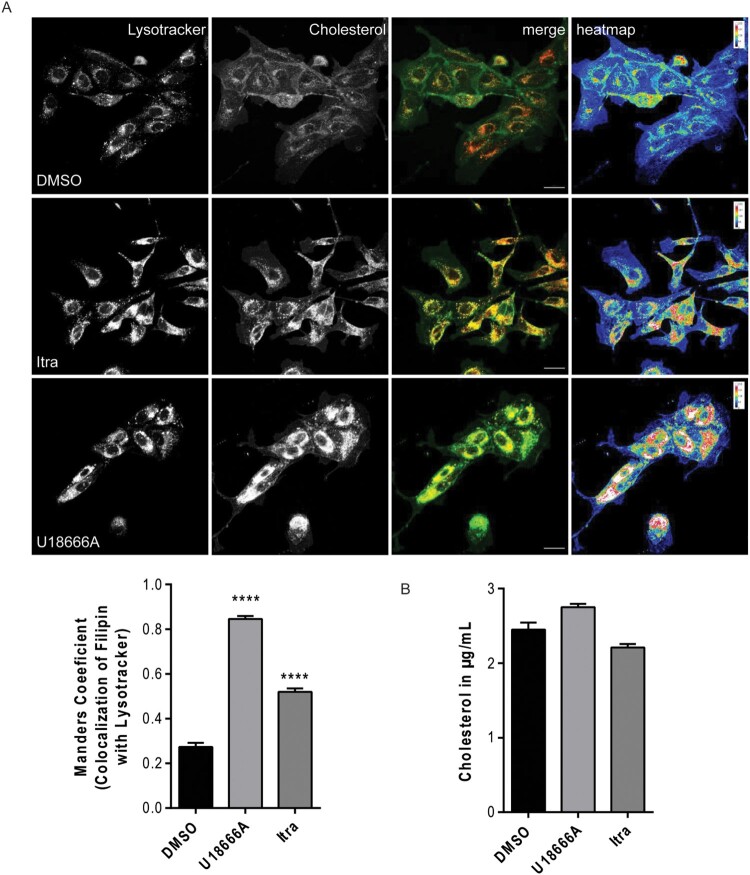
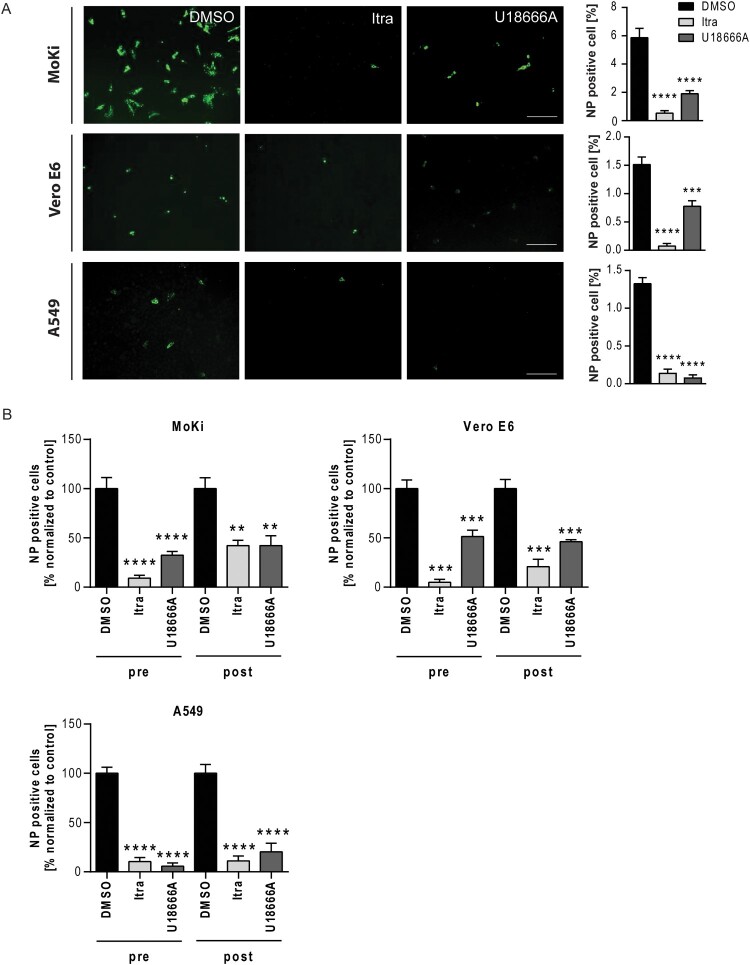
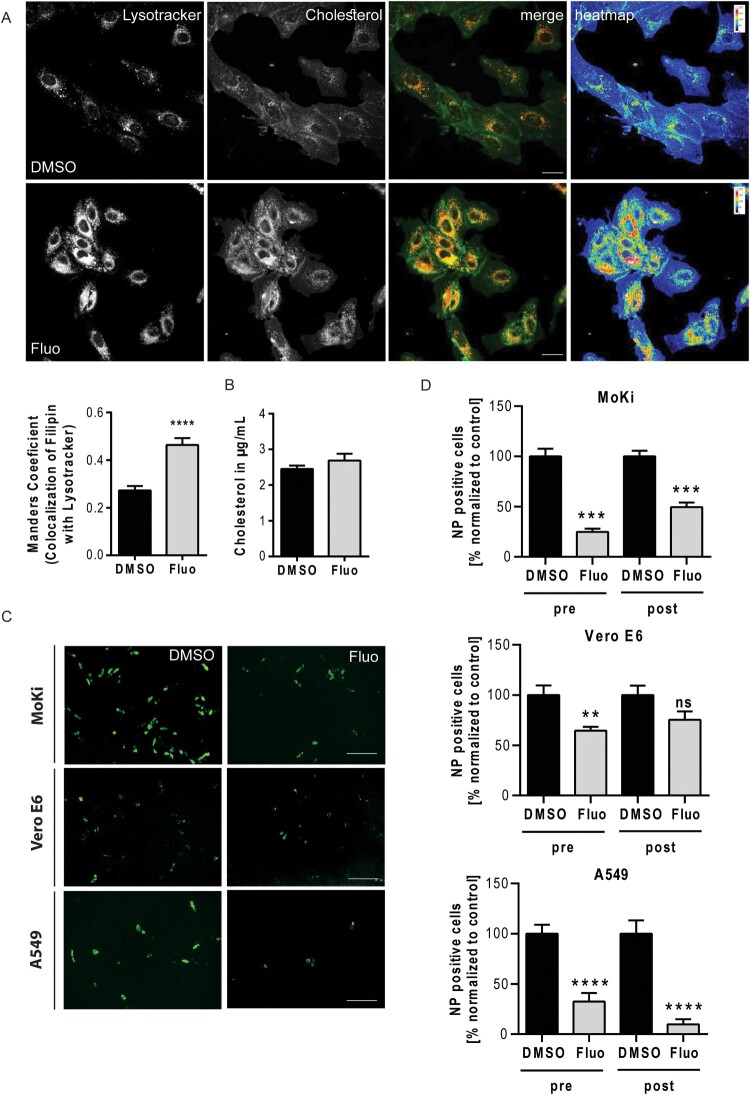
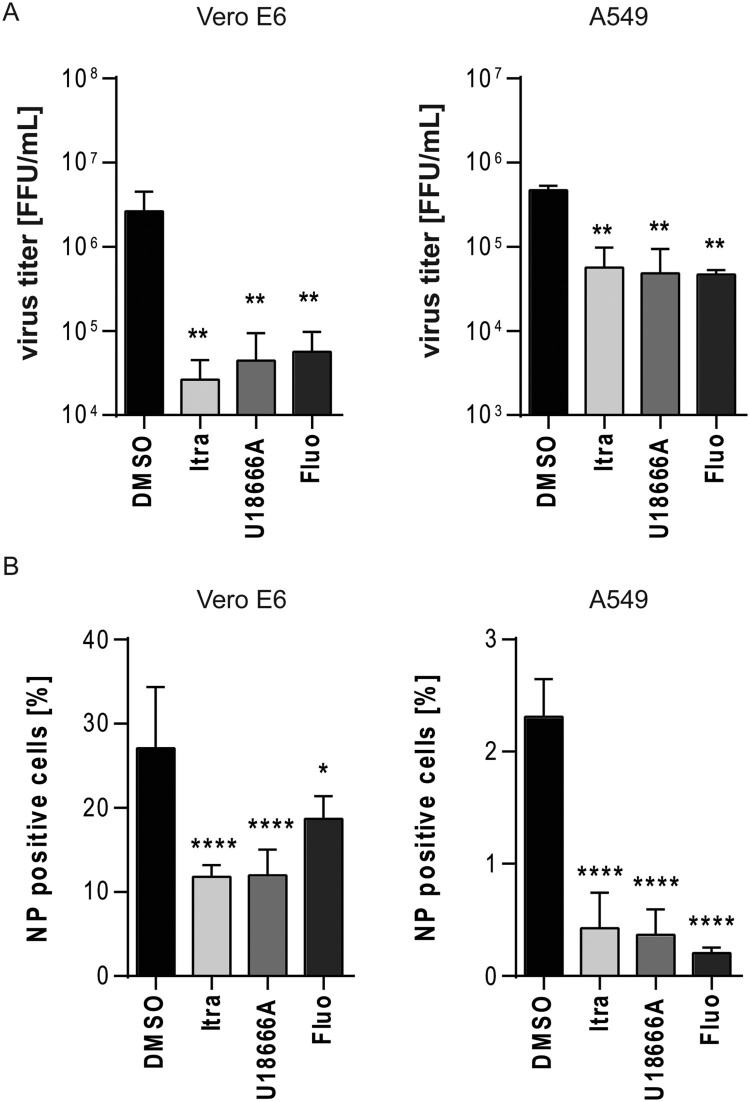
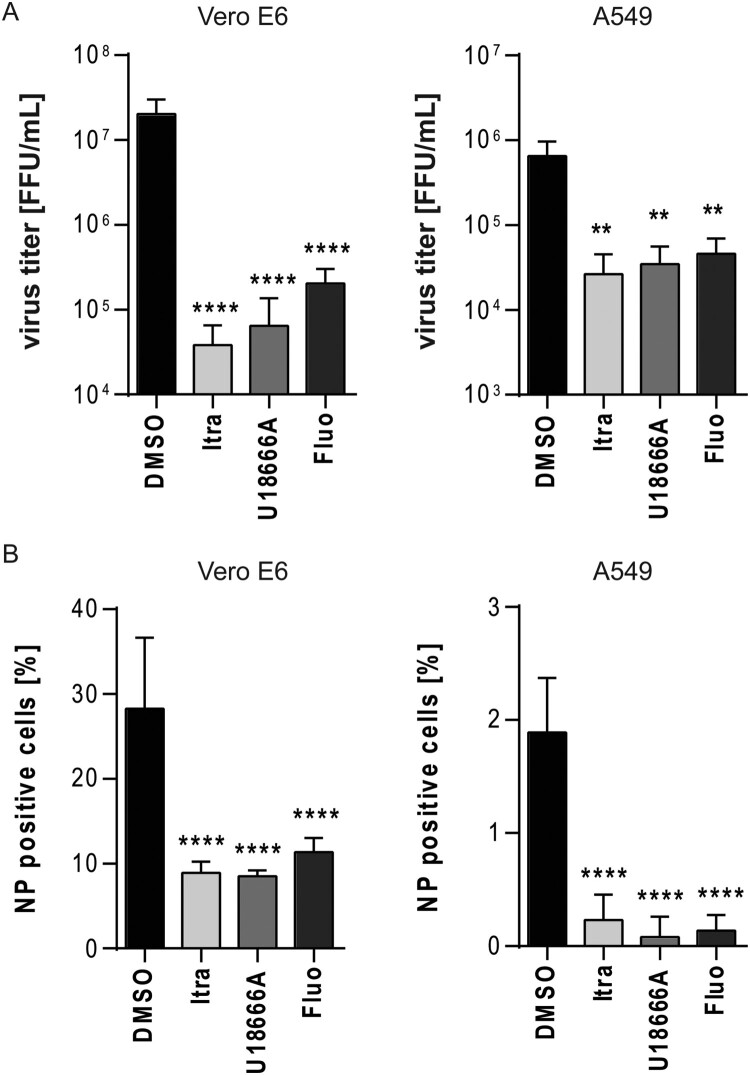
Ebola virus disease (EVD) is a severe and frequently lethal disease caused by Ebola virus (EBOV). The latest occasional EVD outbreak (2013-2016) in Western African, which was accompanied by a high fatality rate, showed the great potential of epidemic and pandemic spread. Antiviral therapies against EBOV are very limited, strain-dependent (only antibody therapies are available) and mostly restricted to symptomatic treatment, illustrating the urgent need for novel antiviral strategies. Thus, we evaluated the effect of the clinically widely used antifungal itraconazole and the antidepressant fluoxetine for a repurposing against EBOV infection. While itraconazole, similar to U18666A, directly binds to and inhibits the endosomal membrane protein Niemann-Pick C1 (NPC1), fluoxetine, which belongs to the structurally unrelated group of weakly basic, amphiphile so-called "functional inhibitors of acid sphingomyelinase" (FIASMA) indirectly acts on the lysosome-residing acid sphingomyelinase via enzyme detachment leading to subsequent lysosomal degradation. Both, the drug-induced endolysosomal cholesterol accumulation and the altered endolysosomal pH, might interfere with the fusion of viral and endolysosomal membrane, preventing infection with EBOV. We further provide evidence that cholesterol imbalance is a conserved cross-species mechanism to hamper EBOV infection. Thus, exploring the endolysosomal host-pathogen interface as a suitable antiviral treatment may offer a general strategy to combat EBOV infection.

Keywords: Ebola virus; FIASMA; Niemann-Pick C1; endolysosomal interference; fluoxetine; itraconazole; viral entry.


Conflict of interest statement

No potential conflict of interest was reported by the author(s).

Figures

Figure 1.
Figure 1.
Treatment with U18666A or itraconazole increases endolysosomal cholesterol storage in bat-derived cells. (A) Cellular cholesterol pools in MoKi control cells (DMSO-treated) or MoKi cells treated for 16 h with itraconazole (Itra, 2 µg/mL) or the NPC1 inhibitor U18666A (2 µg/mL). Endolysosomes were stained with the organelle-specific marker lysotracker and unesterified cholesterol was visualized using filipin. Heatmaps were generated by colour-encoding filipin-positive pixels according to their intensity values. Representative 2D maximum intensity projections of entire z-stacks obtained by confocal imaging of 3 individual experiments are shown. Scale bar, 20 µm. (B) Overlaps of filipin/LysoTracker signals within the stacks were analyzed by calculating Manders’ coefficients. Bar graphs represent means ± SEM of 9 stacks, with 0 indicating no overlap, and 1 indicating perfect overlap. (C) Global cellular cholesterol levels. Data are expressed as mean cholesterol concentrations (µg/mL) ± SEM from five independent experiments. Statistically significant differences were assessed by one-way ANOVA followed by Dunnett’s multiple comparison test. p-values ≤ 0.05 were considered statistically significant. ****p ≤ 0.0001.
Figure 2.
Figure 2.
Targeting NPC1 with the clinically licensed drug itraconazole or U18666A impairs EBOV infection. (A) Representative images of infected and NP-specific immunostained cells. Cells were infected using EBOV (Zaire, MOI 1) for 24 h and treated with itraconazole (Itra, 2 µg/mL) or U18666A (2 µg/mL) 16 h prior to infection. DMSO served as control. Immunostaining was performed using an anti-nucleoprotein (NP, monoclonal mouse) primary antibody in combination with a goat anti-mouse Alexa 488 coupled secondary antibody (green). Image acquisition was carried out using the GFP channel of a wide field fluorescent microscope equipped with a 10× objective. Scale bar, 400 µm. NP positive cells were expressed as percentage of total cell counts. (B) Percentage of NP-positive cells in the respective samples normalized to control (set to 100). Cells were either pre-treated (pre) for 16 h, or treated 2 h post infection (post) with the respective drugs. Bars show the means ± SEM of nine independent experiments. Data were analyzed for statistically significant differences with one-way ANOVA followed by Dunnett’s multiple comparison test; p-values ≤ 0.05 were considered statistically significant. **p ≤ 0.01, ***p ≤ 0.001, ****p ≤ 0.0001.
Figure 3.
Figure 3.
Interfering with the acid sphingomyelinase activity via fluoxetine impairs EBOV infection. (A) MoKi cells were treated for 16 h with either the solvent DMSO or fluoxetine (5 µM). Lysotracker was used to visualize the endolysosomal compartment and cellular cholesterol was stained with filipin. Representative 2D maximum intensity projections of entire z-stacks and heat maps with the filipin-positive pixels colour-encoded according to their intensity values are presented. Scale bars, 20 µm. Manders’ colocalization coefficients of LysoTracker signals overlapping with filipin were quantitated from z-stacks. Bar graphs represent means ± SEM of three independent experiments. (B) Global cellular cholesterol levels. Data are expressed as mean cholesterol concentrations (µg/mL) ± SEM from five independent experiments. (C) Representative images of NP-positive cells. MoKi, Vero E6, and A549 cells were infected using EBOV (Zaire, MOI 1) for 24 h and treated 16 h prior to infection (pre) with fluoxetine (5 µM), respectively. DMSO served as control. Infected cells were detected via immunostaining using an anti-nucleoprotein (NP) antibody. Infection rates were calculated as percentages of NP-positive cells from total cell amount. Scale bar, 400 µm. (D) Quantitative analysis of infection rates. Cells were either pre-treated (pre) for 16 h, or treated 2 h post infection (post) with fluoxetine. Bar graphs represent means ± SEM of nine independent experiments, with the samples normalized to control (set to 100%). Data were analyzed with unpaired t-test; **p ≤ 0.01, ***p ≤ 0.001, ****p ≤ 0.0001.
Figure 4.
Figure 4.
Treatment with U18666A, fluoxetine or itraconazole reduces viral particle release in MoKi and A549 cells. (A) MoKi and (B) A549 cells were treated for 16 h prior to infection (pre) or 2 h post infection (post) with either DMSO, U18666A (2 µg/mL), itraconazole (2 µg/mL) or fluoxetine (5 µM). Copy numbers of viral particles were determined in supernatants by RT-PCR. Box-and-whiskers plots (minimum to maximum) indicative of six samples of three independent experiments. Data were analyzed with One-way ANOVA; *p ≤ 0.05, **p ≤ 0.01, ****p ≤ 0.0001.
Figure 5.
Figure 5.
Evaluation of the antiviral potential at higher initial infectious dose. Vero E6 and A549 cells were infected with EBOV (Zaire, MOI 10) for 24 h and treated with itraconazole (Itra, 2 µg/mL), U18666A (2 µg/mL), or fluoxetine (Fluo, 5 µM) for the entire infection period. DMSO served as solvent control. (A) Viral titres were determined by TCID50 assay and FFU were calculated. (B) Quantification of viral infection levels via immunofluorescence assay. Numbers of NP positive cells were expressed as percentages of total cell counts. Bars show the means ± SEM of five independent experiments. Data were analyzed for statistically significant differences with one-way ANOVA followed by Dunnett’s multiple comparison test; p-values ≤ 0.05 were considered statistically significant. *p ≤ 0.05, **p ≤ 0.01, ****p ≤ 0.0001.
Figure 6.
Figure 6.
Dose-dependent anti-EBOV activities of drugs acting on the cellular cholesterol homeostasis. Vero E6 and A549 cells were infected using EBOV (Zaire, MOI 10) for 24 h and treated with itraconazole (Itra, 10 µg/mL) or U18666A (10 µg/mL) or fluoxetine (Fluo, 20 µM) for the entire infection period. DMSO served as solvent control. (A) Viral titres were determined by TCID50 assay and FFU calculated. (B) Quantification of viral infection levels via immunofluorescence assay. NP positive cells were expressed as percentage of total cell counts. Bars show the means ± SEM of five independent experiments. Data were analyzed for statistically significant differences with one-way ANOVA followed by Dunnett’s multiple comparison test; p-values ≤ 0.05 were considered statistically significant. **p ≤ 0.01, ****p ≤ 0.0001.

References

    1. World Health Organization . Ebola virus diease: key facts. Geneva: 2020.
    1. Gomes MF, et al. Assessing the international spreading risk associated with the 2014 west african ebola outbreak. PLoS Curr. 2014;6:1–11. - PMC - PubMed
    1. Ascenzi P, Bocedi A, Heptonstall J, et al. Ebolavirus and marburgvirus: insight the Filoviridae family. Mol Aspects Med. 2008;29(3):151–185. - PubMed
    1. Feldmann H, Geisbert TW.. Ebola haemorrhagic fever. Lancet. 2011;377(9768):849–862. - PMC - PubMed
    1. Haque A, Hober D, Blondiaux J.. Addressing therapeutic options for Ebola virus infection in current and future outbreaks. Antimicrob Agents Chemother. 2015;59(10):5892–5902. - PMC - PubMed

MeSH terms