. 2022 Feb 7;219(2):e20210564.
doi: 10.1084/jem.20210564. Epub 2021 Dec 17.

Lipid-loaded tumor-associated macrophages sustain tumor growth and invasiveness in prostate cancer

Affiliations

Lipid-loaded tumor-associated macrophages sustain tumor growth and invasiveness in prostate cancer

Michela Masetti et al. J Exp Med. .

Abstract

Tumor-associated macrophages (TAMs) are correlated with the progression of prostatic adenocarcinoma (PCa). The mechanistic basis of this correlation and therapeutic strategies to target TAMs in PCa remain poorly defined. Here, single-cell RNA sequencing was used to profile the transcriptional landscape of TAMs in human PCa, leading to identification of a subset of macrophages characterized by dysregulation in transcriptional pathways associated with lipid metabolism. This subset of TAMs correlates positively with PCa progression and shorter disease-free survival and is characterized by an accumulation of lipids that is dependent on Marco. Mechanistically, cancer cell-derived IL-1β enhances Marco expression on macrophages, and reciprocally, cancer cell migration is promoted by CCL6 released by lipid-loaded TAMs. Moreover, administration of a high-fat diet to tumor-bearing mice raises the abundance of lipid-loaded TAMs. Finally, targeting lipid accumulation by Marco blockade hinders tumor growth and invasiveness and improves the efficacy of chemotherapy in models of PCa, pointing to combinatorial strategies that may influence patient outcomes.


Conflict of interest statement

Disclosures: R.A. DePinho reported being a Founder and Advisor for Tvardi Therapeutics, Asylia Therapeutics, Nirogy Therapeutics, Stellanova Therapeutics, and Sporos Bioventures. The focus of these companies is not directly related to the content of this manuscript. S. Gordon reported personal fees from Verseau, Myeloid Therapeutics, and Alnylam outside the submitted work. No other disclosures were reported.

Figures

None
Graphical abstract
Figure 1.
Figure 1.
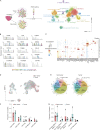
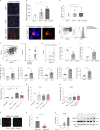
High-dimensional single-cell profiling of the immune infiltrate in PCa patients. (A) Workflow of the experimental approach. 3′-based scRNA-seq was applied to the CD45+ infiltrating cells from tumor and nontumor adjacent PCa tissue (three patients). CD45+ immune cells were isolated by FACS sorting. Identification of immune clusters in prostate (tumor and normal). Uniform manifold approximation and projection (UMAP) of CD45+ cells in prostate (tumor and normal adjacent tissue). 18 clusters characterized by lineage-specific and cluster-enriched genes were identified by integrated analysis. (B) Violin plot showing expression of lineage-specific genes in each cluster. (C) Dot plot showing expression levels of lineage-specific marker genes. (D) UMAP showing tissue distribution (tumor and nontumor tissue) of CD45+ cells. (E) Pie charts of the relative percentages of immune cell clusters in tumor and normal tissue. (F and G) Proportion of different immune cell clusters between tumor and normal prostatic tissue. We identified cluster 9, representative of NK cells, as being significantly downregulated in tumor tissue (F), whereas macrophagic cluster 11 was significantly increased in tumor tissue (G). Data in F and G are expressed as mean ± SD. Student t test was performed (F). *, P < 0.05; **, P value < 0.01. ILC, innate lymphoid cell; Macro, macrophage; Mono, monocytes.
Figure 2.
Figure 2.
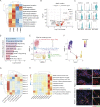
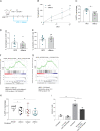
Tumor-enriched macrophages show a dysregulation of lipid metabolismassociated pathways. (A–C) Differential expression analysis between Mac1 and Mac2. (A) Heat map showing enriched IPA pathways in itMac2 and itMac1 and nMac2 and nMac1 deriving from differential expression analysis of Mac2 and Mac1 versus all the other clusters in both normal and tumor conditions. Enrichment scores are provided as −log10 P value and scaled by row. (B) Volcano plot showing differential expressed genes between Mac1 and Mac2. Genes are colored according to their log2FC value. (C) Violin plots showing normalized expression levels of selected up-regulated genes in Mac2 with respect to Mac1. (D) IPA of differentially expressed genes between Mac2 and Mac1 clusters. Selected significant pathways are shown according to −log10 P value threshold >1.3. (E) Uniform manifold approximation and projection (UMAP) representing reclustering of tumor cells belonging to Cl2, Cl9, and Cl11. (F) Monocle trajectory analysis of macrophage clusters in tumor. Cells are colored according to their pseudotime value. (G) Heat map showing the Monocle trajectory analysis of tumor macrophage clusters. Module enrichment value is reported along the different clusters and scaled by column. (H) Heat map representing the most functional relevant pathways according to IPA annotation enriched in module 6. Enrichment scores are provided as −log10 P values. A specific enrichment of module 6 with genes associated with lipid metabolism and lipid intake in MARCO_Mac was observed. (I and J) Representative confocal immunofluorescence images of human PCa from non-tumor–adjacent tissue (I) and tumor tissue (three patients were analyzed). Scale bar, 10 μm (10 μm for digital zoom). Red-stained CD68+ macrophages colocalize with green-stained ADFP lipid droplets in the tumor tissue (J). Images were acquired with an SP8-II confocal microscope (Leica) with a 40× objective. Images on the right are 2× digital zoom. Nuclei were counterstained with DAPI (blue). canc path, cancer pathway; Diap, diapedesis.
Figure S1.
Figure S1.
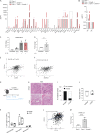
High-dimensional scRNA-seq analysis of TAMs and correlation of MARCO expression with lipid accumulation, Gleason score, and PTEN loss. (A) Volcano plot showing differential expression analysis of Mac2 subsets in the tumor and nontumor tissue. Genes are reported according to their P value and colored by log2FC values. Three patients were analyzed. (B) Heat map reporting Amit gene expression lipid signature along all clusters (Jaitin et al., 2019). (C) Uniform manifold approximation and projection (UMAP) reporting reclustering of intratumor and normal adjacent cells of original Cl2, Cl9, and Cl11. (D) Proportion of macrophage clusters between tumor and nontumor tissue. Cl3 was significantly enriched in the tumor tissue. (E) UMAP showing the correlation between myeloid reclustering and Cl2, Cl11, and Cl9 from the merge analysis. (F) Bar graph showing the quantification of ADFP+ cells on CD68+ cells. Five areas per section were considered. (G) Representative confocal immunofluorescence images of human PCa. Red-stained CD68+ macrophages colocalized with green-stained ADFP (lipid droplets). Nuclei were counterstained with DAPI (blue). Images were acquired with an SP8-II confocal microscope (Leica) with a 40× objective. Images on the right are 2× digital zoom. Scale bar, 10 mm. (H) Representative confocal immunofluorescence images of human PCa. Red-stained CD68+ macrophages colocalized with green-stained BODIPY lipids (lipid droplets). Nuclei are counterstained with DAPI. Images were acquired with an SP8-II confocal microscope with a 40× objective. Images on the right are 2× digital zoom. Scale bar, 10 mm. (I) Representative confocal immunofluorescence images of human adjacent nontumor tissue. Red-stained CD68+ macrophages and green-stained MARCO. Images were acquired with an SP8-II confocal microscope with a 40× objective. Images on the right are 2× digital zoom. Scale bar, 10 mm. (J) Bar graph showing the quantification of Fig. 3 B (tumor) and I (nontumor). Five areas per section have been considered. (K) Graphs showing the Pearson’s correlations of gene expression between MARCO and lipid-related genes in PCa patients in the TCGA cohort. (L) Correlation of MARCO gene expression with TRP53 loss in the TCGA cohort. (M) Correlation of MARCO gene expression with RB1 loss in the TCGA cohort. (N) Correlation of MARCO gene expression with Gleason score in PCa patients from the Taylor dataset. Unpaired t test (P ≤ 0.05). (O) Violin plot representing gene signature score derived from MARCO_Mac cluster along the different infiltrating immune subsets. (P) Correlation of MARCO_Mac gene signature with Gleason score in PCa patients from the Taylor dataset. Gene signature expression is provided as normalized z score. Unpaired t test (P ≤ 0.0001). (Q) Correlation of MARCO_Mac gene signature with PTEN loss in the TCGA cohort. Gene signature expression is provided as normalized z score. Data in F–J, L–N, and P–Q are expressed as mean ± SD. Student’s t test was performed (D, L–N, P, and Q). *, P < 0.05; **, P < 0.01; ***, P < 0.001. Gl, Gleason; IF, immunofluorescence.
Figure 3.
Figure 3.
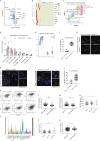
MARCO_Mac defines a macrophage subset with a prognostic significance in human PCa. (A) Dot plot showing the proportion of cells along the 18 clusters expressing CD68 and MARCO (dot size), according to their average expression (color scale). (B) Representative confocal immunofluorescence images of human PCa tumor tissue. Red-stained CD68+ macrophages colocalize with green-stained MARCO cells. Images were acquired with an SP8-II confocal microscope (Leica) with a 40× objective. Images on the right are 2× digital zoom. Nuclei were counterstained with DAPI (three patients were analyzed). Scale bar, 10 μm (10 μm for digital zoom). (C) Representative confocal immunofluorescence images of human PCa tumor tissue. Red-stained MARCO+ macrophages colocalize with green-stained BODIPY lipids (lipid droplets). Images were acquired with an SP8-II confocal microscope with a 40× objective. Images on the right are 2× digital zoom. Nuclei were counterstained with DAPI (three patients were analyzed). Scale bar, 20 μm (20 μm for digital zoom). (D) Pearson’s correlation showing a positive correlation between MARCO and CD68 in the TCGA human PCa dataset. Gene expression values are provided as FPKM. (E) Correlation of MARCO gene expression with Gleason score in PCa patients from the TCGA dataset. Unpaired t test (*, P ≤ 0.04). (F) Correlation of MARCO expression levels with PTEN loss in the TCGA cohort. Gene expression values are provided as FPKM. Unpaired t test (**, P ≤ 0.0013). (G) Heat map showing the cluster-specific gene signature based on differentially expressed genes that modulate the functional state of MARCO_Mac. (H) Violin plot representing gene signature score of MARCO_Mac cluster along tumor macrophage clusters. (I) Correlation of MARCO_Mac gene signature with Gleason score in PCa patients from TCGA dataset. Gene signature is provided as normalized z score. One-way ANOVA (***, P ≤ 0.008). (J) DFS analysis of TCGA cohort divided by the median expression value of MARCO_Mac gene signature. DFS analysis was performed by Gepia2 Web tool. Gl, Gleason. Data in E, F, and I are expressed as mean ± SD.
Figure 4.
Figure 4.
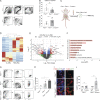
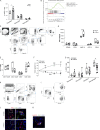
The abundance of lipid-loaded TAMs is associated with tumor progression in murine models of PCa. (A) Gating strategy for identification of TAMs and neutrophils. n = 5/group. (B) Bar graphs showing the frequency of macrophages and neutrophils, gated on CD45+ cells. (C) Workflow of TAM sorting from transgenic mice and subsequent RNA-seq. (D) RNA-seq analysis performed on TAMs (CD45+F4/80+Ly6G) isolated from Ptenpc−/− and Ptenpc−/−; Smad4pc−/− tumors. n = 3/group. Heat map showing normalized gene expression values of significant modulated genes. (E) Volcano plot showing differentially expressed genes between TAMs isolated from Ptenpc−/− (oc_Mac) and Ptenpc−/−; Smad4pc−/− (met_Mac) tumors. Genes are colored according to their log2FC values. (F) IPA of differentially expressed genes between met_Mac and oc_Mac. Significant canonical pathways are represented according to their −log10 P value. (G) Gating strategy used to identify lipid-loaded TAMs in murine prostatic tumors. CD11b+ cells were gated on previously gated viable and CD45+ cells. ADFP expression was evaluated on macrophages identified as F4/80+Ly6G cells on CD11b+CD45+ previously gated cells. (H) Frequency of ADFP+ TAMs in prostates from WT (Ptenpc+/+) mice or Ptenpc−/− and Ptenpc−/−; Smad4pc−/− transgenic animals. Data are mean ± SE. n = 3 for WT (Ptenpc+/+) prostates, n = 6 for Ptenpc−/−, and n = 5 for Ptenpc−/−; Smad4pc−/− tumors. (I) Representative confocal immunofluorescence images of tumor anterior prostate lobes from WT (Ptenpc+/+), Ptenpc−/−, and Ptenpc−/−; Smad4pc−/− mice. Red-stained F4/80+ macrophages colocalize with green-stained ADFP lipid droplets in the Ptenpc−/−; Smad4pc−/− tumors. Images were acquired with an SP8-II confocal microscope (Leica) with a 40× objective. Images are 2× digital zoom. Nuclei were counterstained with DAPI. Scale bar, 10 μm. (J) Frequency of ADFP+ TAMs in the orthotopic models of prostate cancer. Murine prostate cancer cell lines (Pten−/− or Pten−/−; Smad4−/−) were injected in one anterior lobe of a recipient mouse, while the symmetric lobe was injected with saline solution. n = 4 for Pten−/−-injected mice; n = 5 for Pten−/−; Smad4−/−-injected mice. Student t test was performed. *, P < 0.05; ***, P < 0.001 (B, H, and J). SSC-A, side scatter area; SSC-H, side scatter height. Data in B, H, and J are expressed as mean ± SD.
Figure S2.
Figure S2.
Analysis of lipid-loaded TAMs in vivo and in vitro. (A) Representative confocal immunofluorescence images of tumor anterior prostate lobes from WT (Ptenpc+/+), Ptenpc−/−, and Ptenpc−/−; Smad4pc−/− mice. Red-stained F4/80+ macrophages colocalized with green-stained ADFP lipid droplets in the Ptenpc−/−; Smad4pc−/− tumors. Images were acquired with an SP8-II confocal microscope (Leica) with a 40× objective. Nuclei were counterstained with DAPI (blue). Scale bar, 10 μm. (B) Median fluorescence intensity of ADFP in TAMs in prostates from WT (Ptenpc+/+) mice or Ptenpc−/− and Ptenpc−/−; Smad4pc−/− transgenic animals. Mean ± SE are shown. n = 3 for WT (Ptenpc+/+) prostates, n = 6 for Ptenpc−/−, and n = 5 for Ptenpc−/−; Smad4pc−/− tumors. (C) Representative confocal immunofluorescence images of tumor anterior prostate lobes from Ptenpc−/−; Smad4pc−/− mice. Red-stained MARCO+ macrophages colocalize with green-stained ADFP lipid droplets in the Ptenpc−/−; Smad4pc−/− tumors. Images were acquired with an SP8-II confocal microscope with a 40× objective. Displayed are 2× digital zoom. Nuclei were counterstained with DAPI (blue). Scale bar, 5 μm. (D) Frequency of ADFP+ neutrophils in prostates from WT (Ptenpc+/+) mice or Ptenpc−/− and Ptenpc−/−; Smad4pc−/− transgenic animals. (E) CD206 and MHC-II expression by lipid-loaded TAMs. The expression of the two markers was evaluated in ADFP+ TAMs. Increased expression of CD206 correlates with higher expression of ADFP. (F) Graph showing the Pearson’s correlation between MARCO and CD206 (MRC1) gene expression in TCGA cohort. (G) Graph showing the percentage and average expression of CD206 (MRC1) in the single-cell–derived human dataset. (H) Graph showing the Pearson’s correlation between MARCO and CD206 gene expression in the single-cell–derived human dataset. (I and J) Analysis of TAMs and neutrophils in the Pten−/− and Pten−/−; Smad4−/− orthotopic models. Frequency of TAMs (I) and of neutrophils gated on CD45+ cells (J). (K) Bar graphs based on FACS analysis showing the expression of macrophage pivotal markers on ADFP+ and ADFP tumor-infiltrating macrophages. (L) Bar graph showing the quantification of green-stained acLDL uptake in red-stained F4/80 stained macrophages exposed to different tumor CM. At least three independent experiments were quantified. Mean areas of acLDL labeling per cell ± SE are shown. (M) Quantitative RT-PCR of LDL receptor (LDLr) gene expression in primary macrophages exposed to different tumor CM. No significant differences could be detected among conditions. FC was calculated on untreated macrophages as control. All the experiments were conducted in at least three biological replicates. Student’s t test was performed on ΔCTs. (N) Quantitative RT-PCR of CD36 gene expression in primary macrophages exposed to different tumor CM. FC was calculated on untreated macrophages as control. n = 4 for untreated, Pten−/−; Smad4−/−, and Pten−/−; Trp53−/−; Smad4−/−, and n = 3 for Pten−/−. (O and P) Representative confocal immunofluorescence images and quantification of green-stained oxLDL uptake in red-stained F4/80 stained Marco WT and Marco KO macrophages exposed to Pten−/−; Trp53−/−; Smad4−/− tumor CM. Images were acquired on an SP-II confocal microscope with a 60× objective. Scale bar, 10 μm. n = 5. Mean area of oxLDL staining per cell ± SE is shown. (Q) Western blot image and bar graph showing the expression of total Stat6 and phosphorylated Stat6 on macrophages exposed to oxLDL. Student’s t test was performed (B, D, I–N, and P) *, P < 0.05; **, P < 0.01; ***, P < 0.001. CTR/Ctrl, control; Neg, negative. Data are expressed as mean ± SD.
Figure 5.
Figure 5.
MARCO-dependent lipid uptake on tumor-conditioned macrophages fosters tumor cell migration by CCL6 release. (A) Lipid uptake assay scheme and generation of lipid-loaded TAMs. At day 7 of differentiation, primary macrophages were exposed to tumor CM, the day after oxLDLs were added, leading to the formation of lipid-loaded macrophages. (B and C) Representative confocal immunofluorescence images and quantification of green-stained oxLDL uptake in red-stained F4/80 stained macrophages exposed to different tumor CM. Nuclei marked with DAPI (blue). Images were acquired with an SP-II confocal microscope (Leica) with a 60× objective. Images on the right are 2× digital zoom. Scale bar, 20 μm (20 μm for digital zoom). n = 4 independent experiments for untreated, Pten−/−; Smad4−/−, and Pten−/−; Trp53−/−; Smad4−/−, and n = 3 independent experiments for Pten−/−. Mean ± SE areas of oxLDLs per cell are shown. (D) Quantitative RT-PCR of MARCO expression in primary macrophages exposed to different tumor CM. FC was calculated on untreated macrophages as control. n = 4 independent experiments for untreated, Pten−/−; Smad4−/−, and Pten−/−; Trp53−/−; Smad4−/−, and n = 3 independent experiments for Pten−/−. (E and F) Representative confocal immunofluorescence images and quantification of green-stained oxLDL uptake in red-stained F4/80 strained MARCO KO and MARCO WT macrophages exposed to Pten−/−; Smad4−/− tumor CM. Images were acquired with an SP-II confocal microscope with a 60× objective. Images on the right are 2× digital zoom. n = 5. Mean area of oxLDLs per cell ± SE are shown. Scale bar, 20 μm (10 μm for digital zoom). (G) Quantification of oxLDL uptake in primary macrophages exposed to Pten−/−; Smad4−/− tumor CM and treated with an anti-IL-1β neutralizing antibody (nAb). n = 4 for untreated, and n = 3 for IL-1β. Mean areas of oxLDLs per cell ± SE are shown. Student’s t test was performed. (H) Migration assay. Pten−/−; Smad4−/− tumor cells were indirectly co-cultured in transwell chambers with primary macrophages previously exposed to tumor CM (Pten−/−; Smad4−/−) and treated or not with oxLDLs (10 μg/ml) for 15 h. Migrated cells on the bottom surface of the membrane were stained with Crystal Violet. Optical density was measured with a CLARIOstar plate reader at 570 λ. Spontaneous migration of Pten−/−; Smad4−/− tumor cells was used as baseline. n = 3. (I) A proteome profiler array was performed on untreated primary macrophages loaded or not with oxLDLs and on primary macrophages exposed to Pten−/−; Smad4−/− tumor CM and loaded or not with oxLDLs. Heat map, representative of protein modulation, optical density measurements are shown. Analysis was performed using ImageJ software. (J) Migration assay in the presence of anti-CCL6 antibody. Pten−/−; Smad4−/− tumor cells were co-cultured in transwell chambers with primary macrophages as described in H. In some conditions, an nAb against CCL6 (15 μl/ml) was added. Spontaneous migration of Pten−/−; Smad4−/− tumor cells was used as baseline. n = 3 independent experiments were performed and analyzed. Student’s t test was performed. *, P < 0.05; **, P < 0.01 (C, D, F, and G). Paired Student’s t test was performed on raw optical density data. *, P < 0.05 (H and J). Data are expressed as mean ± SD.
Figure S3.
Figure S3.
Analysis of the secretome from murine cancer cell lines and impact of Ccl6 blockade on tumor invasiveness in PCa. (A and B) Secretome analysis of CM derived from tumor cell lines. CM were collected from Pten−/−, Pten−/−; Smad4−/−, and Pten−/−; Trp53−/−; Smad4−/− cell lines and concentrated 1:5 in Amicon Ultra Centrifugal Filter Units, and then a multiplex ELISA analyzing 42 different cytokines (Proteome Rodent MAP 4.0; Myriad) was performed. IL-1β expression was higher in metastatic CM (Pten−/−; Smad4−/− versus Pten−/−; Trp53−/−; Smad4−/−) versus nonmetastatic one (Pten−/−). n = 2. (C) Quantitative RT-PCR analysis on primary macrophages treated with different doses of IL-1β. Marco expression rose with increasing concentration of IL-1β (n = 2). (D) Migration assay. Pten−/−; Smad4−/− cells were co-cultured in transwell chambers with primary macrophages previously exposed to tumor CM (Pten−/−; Smad4−/−) and loaded or not with oxLDLs (10 μg) for 15 h. Migrated cells on the bottom side of the membrane were stained with Cell Tracker Dye for better visualization, and nuclei were stained with DAPI. Cells were manually counted using a microscope. (E) Pearson’s correlation showing positive association between CCL23 (ortholog of murine Ccl6) and CD68 in the human PCa TCGA dataset. Gene expression values are provided as FPKM. (F) Pearson’s correlation showing positive association between CCL23 and MARCO in the human PCa TCGA dataset. Gene expression values are provided as FPKM. (G) Schematic of αCcl6 treatment in Ptenpc−/−; Smad4pc−/− mice. Mice at 9 wk of age were either treated with αCcl6 antibody or with an isotype control. n = 4 mice treated with anti-Ccl6, and n = 4 mice treated with isotype control. Mice were sacrificed at day 15. (H) Representative images of H&E staining of anterior prostate lobes from Ptenpc−/−; Smad4pc−/− mice treated with anti-Ccl6 or isotype control. Images were acquired using a VS120 dotSlide Microscope (Olympus) with a 20× objective. Scale bar, 200 μm (100 μm for digital zoom). Arrows are pointing at invasive areas. (I) Bar graph showing the quantification of tumor invasiveness. (J) Tumor size in Ptenpc−/−; Smad4pc−/− mice treated with anti-Ccl6 antibody or isotype control. Measures were taken on the day of sacrifice. (K) Percentage of myeloid subsets gated on CD45+ cells. (L) Graph showing Pearson’s correlation between IL-1β and CCL23 in TCGA cohort. (M) Bar graph showing the gene expression of Ccr1 on cells isolated from Ptenpc−/− and Ptenpc−/−; Smad4pc−/− tumors. Student’s t test was performed (D, J, K, and M). **, P < 0.01; ***, P < 0.001. CRP, C-reactive protein; SAP, serum amyloid P component. Data in C, D, H, and M are expressed as mean ± SD.
Figure 6.
Figure 6.
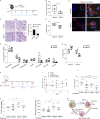
Administration of an HFD to tumor-bearing mice raises lipid accumulation in TAMs and alters their transcriptional profile. (A) Scheme of HFD effects on tumor growth and TAM phenotype experiments. NOD-SCIDγ mice were injected subcutaneously with Pten−/−; Smad4−/− cells. After 10 d, tumors were clearly visible on the flanks, and mice were randomized into two treatment groups: HFD (n = 11) and NFD (n = 9). (B) Tumor growth in NOD-SCIDγ mice injected subcutaneously with Pten−/−; Smad4−/− cells fed NFD or HFD. Measurements began 10 d after the initial cell injection. (C) Characterization of the immune infiltrate in subcutaneous Pten−/−; Smad4−/− tumors in NOD-SCIDγ mice fed either with NFD or HFD. (D) Percentage of ADFP+ macrophages in tumors from NOD-SCIDγ mice injected subcutaneously with Pten−/−; Smad4−/− cells and fed either NFD or HFD. (E) Phenotypic characterization of tumor-infiltrating TAMs in subcutaneous Pten−/−; Smad4−/− tumors in NOD-SCIDγ mice fed either with NFD or HFD. (F) RNA-seq analysis performed on TAMs (CD45+F4/80+Ly6G) isolated from Pten−/−; Smad4−/− tumors in NOD-SCIDγ mice. Heat map shows normalized gene expression values of significantly modulated genes in HFD- versus NFD-fed mice. (G) Volcano plot showing differentially expressed genes according to their P value. Modulated genes are colored according to their log2FCthresholds. (H) IPA of differentially expressed genes. Significant canonical pathways are represented according to their −log10 P value. Student’s t test was performed (B–E). *, P < 0.05; **, P < 0.01. MFI, mean fluorescence intensity. Data in C–E are expressed as mean ± SD.
Figure S4.
Figure S4.
Analysis of the immune infiltrate in vivo. (A) Bar graph showing the percentage of ADFP+ myeloid subsets gated on CD45. n = 5 mice on NFD, and n = 6 mice on HFD. (B) GSEA showing the enrichment of the GNF2_Stat6 pathway in macrophages sorted from HFD mice versus NFD mice. (C–E) Analysis of the immune infiltrate in Ptenpc−/−; Smad4pc−/− tumors from mice treated with αMarco (n = 4) or with isotype control (n = 5). Gating strategy used to analyze different immune cell subsets in Ptenpc−/−; Smad4pc−/− tumors (C) and frequency of immune subsets (D and E). (E) Frequency of different T cell subsets in Pten−/−; Smad4−/− tumors from mice treated with αMarco or with isotype control. CD4+ T cells are identified as CD4+CD25; Treg cells as CD4+CD25+, and unconventional T cells as CD4CD8. (F) Curve showing the growth of subcutaneous tumors from NOD-SCIDγ mice treated with αMarco antibody or isotype control. (G) Bar graph showing the percentage of ADFP+ myeloid cells infiltrating the tumors. (H and I) Gating strategy used to identify lipid-loaded TAMs in subcutaneous tumors from NOD-SCIDγ mice treated with αMarco antibody or isotype control. Lipid-loaded TAMs are ADFP+. (J) Representative confocal immunofluorescence images of subcutaneous tumors from NOD-SCIDγ mice injected subcutaneously with Pten−/−; Smad4−/− cells. Red-stained F4/80+ macrophages colocalize with green-stained ADFP lipid droplets. Nuclei are counterstained with DAPI (blue). Images were acquired with an SP8-II confocal microscope (Leica) with a 40× objective. Images on the right are 2× digital zoom. Scale bar, 50 μm (10 μm for the digital zoom). (K) Representative confocal immunofluorescence image of subcutaneous tumors from NOD-SCIDγ mice injected subcutaneously with Pten−/−; Smad4−/− cells. Red-stained Marco+ macrophages colocalized with green-stained ADFP lipid droplets. Nuclei are counterstained with DAPI (blue). Images were acquired with an SP8-II confocal microscope with a 40× objective. Scale bar, 10 μm. Student’s t test was performed (A and D–G), **, P < 0.01; ***, P < 0.001. FDR, false discovery rate; FSC-A, forward scatter area; L/D, length-to-diameter ratio; MFI, median fluorescence intensity; NES, normalized enrichment score; SSC-A, side scatter area; SSC-H, side scatter height. Data in A, D, E, and G are expressed as mean ± SD.
Figure 7.
Figure 7.
MARCO blockade in prostate tumor models impairs lipid-loading in TAMs and hinders tumor growth and invasiveness. (A) Scheme of αMarco treatment in Ptenpc−/−; Smad4pc−/− mice. Mice at 9 wk of age were either treated with αMarco antibody or with an isotype control (100 μg/injection on days 0 and 3 and 50 μg/injection on days 7, 10, and 14). n = 4 mice treated with αMarco, and n = 5 mice treated with isotype control. Mice were sacrificed at day 15. (B) Tumor size in Ptenpc−/−; Smad4pc−/− mice treated with αMarco antibody or control isotype. Measures were taken on the day of sacrifice. (C) Representative images of H&E staining of anterior prostate lobes from Ptenpc−/−; Smad4pc−/− mice treated with αMarco or isotype control. Arrows indicate invasive areas. Images were acquired with a VS120 dotSlide Microscope (Olympus) with a 20× objective. Scale bar, 100 μm (50 μm for digital zoom). (D) Percentage of ADFP+ macrophages in tumors from Ptenpc−/−; Smad4pc−/− mice treated with αMarco antibody or isotype control. (E) Representative confocal immunofluorescence images of tumor anterior prostate lobes from Ptenpc−/−; Smad4pc−/− mice treated with αMarco or control isotype. Red-stained F4/80+ macrophages colocalize with green-stained ADFP lipid droplets in the isotype control group versus the αMarco-treated group. Images were acquired with an SP8-II confocal microscope (Leica) with a 40× objective. Images on the right are 2× digital zoom. Scale bar, 50 μm (10 μm for digital zoom). (F) Expression of macrophage markers by TAMs from Ptenpc−/−; Smad4pc−/− tumors from mice treated with αMarco or with isotype control. n = 4 for αMarco, and n = 5 for isotype control. (G) Frequency of NK cells in Ptenpc−/−; Smad4pc−/− tumors from mice treated with αMarco or with isotype control. Cytotoxic NK cells were identified as CD11b+. (H) Scheme of αMarco/docetaxel treatment in NOD-SCIDγ mice injected subcutaneously with Pten−/−; Smad4−/− cells. After 10 d, tumors were clearly visible on the flanks, and mice were randomized into treatment groups. n = 8 for αMarco, n = 7 for isotype control, n = 7 for docetaxel plus isotype control, and n = 6 for docetaxel plus αMarco. (I) Graph showing the growth curves of tumors. Ordinary one-way ANOVA of curves. P = 0.004. Areas under the curves are as follows: control = 923.5; αMarco = 648.2, docetaxel = 594.9, docetaxel + αMarco = 445.8. (J) Bar graph showing tumor growth in NOD-SCIDγ mice injected subcutaneously with Pten−/−; Smad4−/− cells and treated with αMarco/docetaxel. (K and L) Bar graph showing the percentage of F4/80+ macrophages (gated on CD11b+) and the median fluorescence intensity (MFI) of CD206 on macrophages in tumors from NOD-SCIDγ mice injected subcutaneously with Pten−/−; Smad4−/− cells and treated with αMarco/docetaxel. (M) Scheme of the mechanism of induction and of lipid-loaded TAMs and their function. Student’s t test was performed (B, D, F, G, and J–L). *, P < 0.05; **, P < 0.01. Doce, docetaxel. Data in B, D, F, G, and J–L are expressed as mean ± SD.
Figure S5.
Figure S5.
Marco blockade hinders tumor growth in HFD-treated mice and synergizes with docetaxel in a PCa model. (A) Schematic of αMarco treatment in tumor-bearing mice exposed to HFD or to NFD as control. Mice were exposed to HFD and NFD and either treated with αMarco antibody or with an isotype control for 15 d. n = 7 mice treated with anti-Ccl6, and n = 8 mice treated with isotype control. Mice were sacrificed at day 15. (B) Curve showing the growth of subcutaneous tumors. (C) Bar graph showing the percentage of ADFP+ TAMs gated on CD45+ cells. (D and E) Bar graphs showing the frequency of total macrophages and of neutrophils infiltrating the tumors. (F and G) GSEA of the Gene Ontology Biological Process (GOBP)_IL-1β production and GOBP_IL-1 production on tumor cells from HFD- and NFD-fed mice. (H) Bar graph showing the percentage of ADFP+ TAMs gated on CD45+ cells. (I) Bar graph showing the percentage of annexin+ prostate tumor cells (Pten−/−; Smad4−/− cell line) exposed to docetaxel in the presence or absence of CM from lipid-loaded macrophages. Student’s t test was performed (B–E, H, and I). *, P < 0.05; **, P < 0.01. FDR, false discovery rate; NES, normalized enrichment score. Data are expressed as mean ± SD.

References

    1. Alimonti, A., Nardella C., Chen Z., Clohessy J.G., Carracedo A., Trotman L.C., Cheng K., Varmeh S., Kozma S.C., Thomas G., et al. . 2010. A novel type of cellular senescence that can be enhanced in mouse models and human tumor xenografts to suppress prostate tumorigenesis. J. Clin. Invest. 120:681–693. 10.1172/JCI40535 - DOI - PMC - PubMed
    1. Aran, D., Looney A.P., Liu L., Wu E., Fong V., Hsu A., Chak S., Naikawadi R.P., Wolters P.J., Abate A.R., et al. . 2019. Reference-based analysis of lung single-cell sequencing reveals a transitional profibrotic macrophage. Nat. Immunol. 20:163–172. 10.1038/s41590-018-0276-y - DOI - PMC - PubMed
    1. Bacci, M., Lorito N., Smiriglia A., and Morandi A.. 2021. Fat and furious: Lipid metabolism in antitumoral therapy response and resistance. Trends Cancer. 7:198–213. 10.1016/j.trecan.2020.10.004 - DOI - PubMed
    1. Baenke, F., Peck B., Miess H., and Schulze A.. 2013. Hooked on fat: the role of lipid synthesis in cancer metabolism and tumour development. Dis. Model. Mech. 6:1353–1363. 10.1242/dmm.011338 - DOI - PMC - PubMed
    1. Balaban, S., Nassar Z.D., Zhang A.Y., Hosseini-Beheshti E., Centenera M.M., Schreuder M., Lin H.M., Aishah A., Varney B., Liu-Fu F., et al. . 2019. Extracellular fatty acids are the major contributor to lipid synthesis in prostate cancer. Mol. Cancer Res. 17:949–962. 10.1158/1541-7786.MCR-18-0347 - DOI - PubMed

Publication types

MeSH terms