

Automated COVID-19 diagnosis and prognosis with medical imaging and who is publishing: a systematic review
- PMID: 34919204
- PMCID: PMC8678975
- DOI: 10.1007/s13246-021-01093-0
Automated COVID-19 diagnosis and prognosis with medical imaging and who is publishing: a systematic review
Abstract
Objectives: To conduct a systematic survey of published techniques for automated diagnosis and prognosis of COVID-19 diseases using medical imaging, assessing the validity of reported performance and investigating the proposed clinical use-case. To conduct a scoping review into the authors publishing such work.
Methods: The Scopus database was queried and studies were screened for article type, and minimum source normalized impact per paper and citations, before manual relevance assessment and a bias assessment derived from a subset of the Checklist for Artificial Intelligence in Medical Imaging (CLAIM). The number of failures of the full CLAIM was adopted as a surrogate for risk-of-bias. Methodological and performance measurements were collected from each technique. Each study was assessed by one author. Comparisons were evaluated for significance with a two-sided independent t-test.
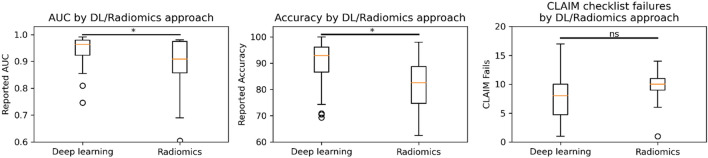
Findings: Of 1002 studies identified, 390 remained after screening and 81 after relevance and bias exclusion. The ratio of exclusion for bias was 71%, indicative of a high level of bias in the field. The mean number of CLAIM failures per study was 8.3 ± 3.9 [1,17] (mean ± standard deviation [min,max]). 58% of methods performed diagnosis versus 31% prognosis. Of the diagnostic methods, 38% differentiated COVID-19 from healthy controls. For diagnostic techniques, area under the receiver operating curve (AUC) = 0.924 ± 0.074 [0.810,0.991] and accuracy = 91.7% ± 6.4 [79.0,99.0]. For prognostic techniques, AUC = 0.836 ± 0.126 [0.605,0.980] and accuracy = 78.4% ± 9.4 [62.5,98.0]. CLAIM failures did not correlate with performance, providing confidence that the highest results were not driven by biased papers. Deep learning techniques reported higher AUC (p < 0.05) and accuracy (p < 0.05), but no difference in CLAIM failures was identified.
Interpretation: A majority of papers focus on the less clinically impactful diagnosis task, contrasted with prognosis, with a significant portion performing a clinically unnecessary task of differentiating COVID-19 from healthy. Authors should consider the clinical scenario in which their work would be deployed when developing techniques. Nevertheless, studies report superb performance in a potentially impactful application. Future work is warranted in translating techniques into clinical tools.
Keywords: Chest X-ray; Computed tomography; Coronavirus; Diagnosis; Prognosis; Staging.
© 2021. Australasian College of Physical Scientists and Engineers in Medicine.
Conflict of interest statement
The authors have no conflicts of interest to declare.
Figures


References
-
- Simpson S, Kay FU, Abbara S, Bhalla S, Chung JH, Chung M, Henry TS, Kanne JP, Kligerman S, Ko JP, Litt H. Radiological Society of North America expert consensus document on reporting chest CT findings related to COVID-19: endorsed by the society of thoracic radiology, the American College of Radiology, and RSNA. Radiol Cardiothorac Imaging. 2020;2:e200152. doi: 10.1148/ryct.2020200152. - DOI - PMC - PubMed
-
- The Royal Australian and New Zealand College of Radiologists (2020) Guidelines for CT Chest and Chest Radiograph reporting in patients with suspected COVID-19 infection
Publication types
MeSH terms
LinkOut - more resources
Full Text Sources
Medical