. 2021 Dec;11(12):e625.
doi: 10.1002/ctm2.625.

Interleukin-2-inducible T-cell kinase (Itk) signaling regulates potent noncanonical regulatory T cells

Affiliations

Interleukin-2-inducible T-cell kinase (Itk) signaling regulates potent noncanonical regulatory T cells

Mahinbanu Mammadli et al. Clin Transl Med. 2021 Dec.

Abstract

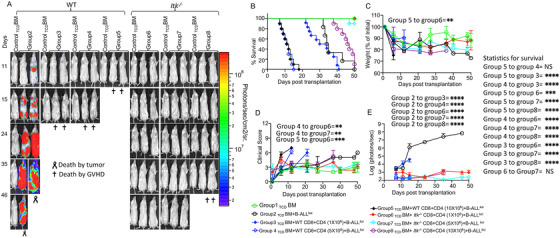
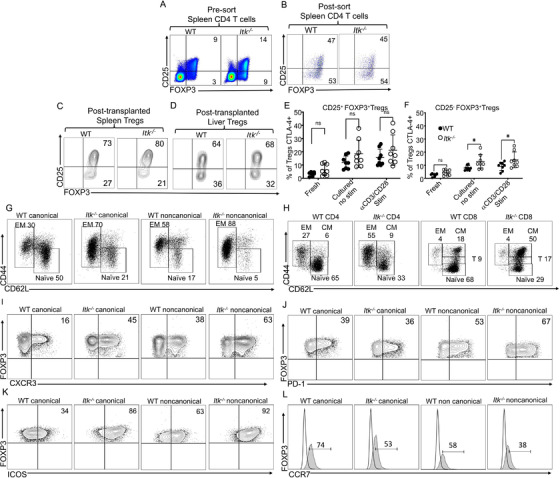
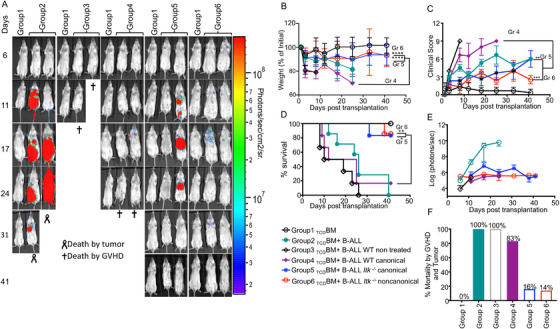
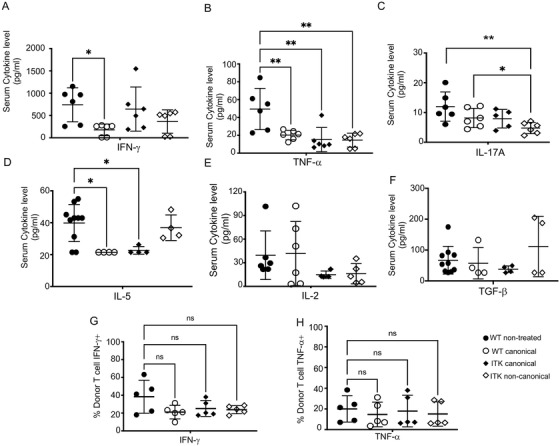
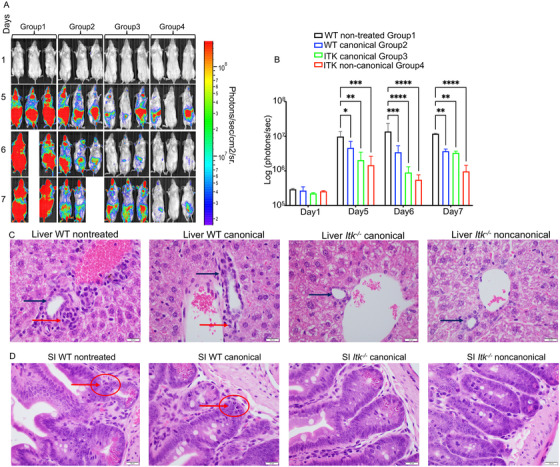
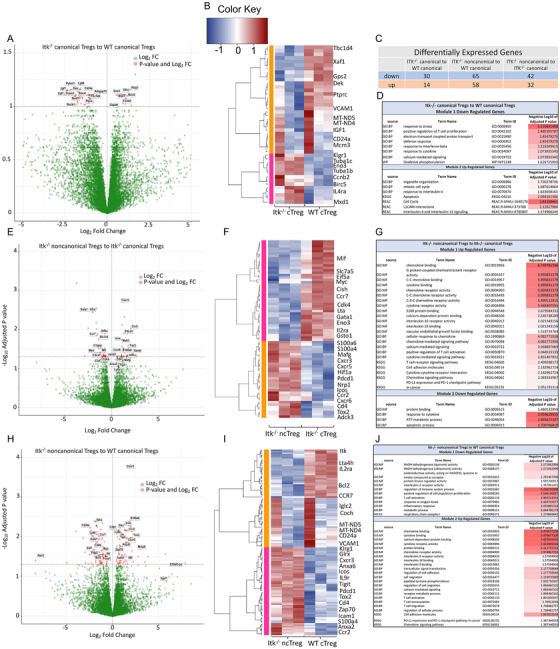
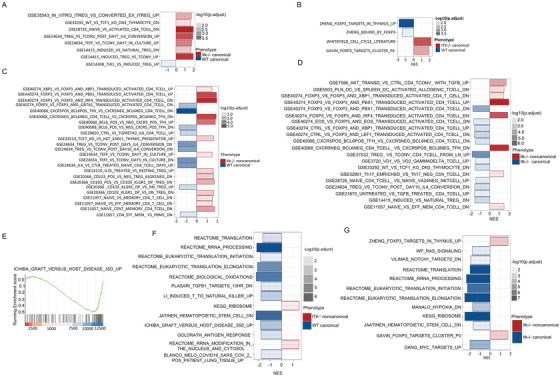
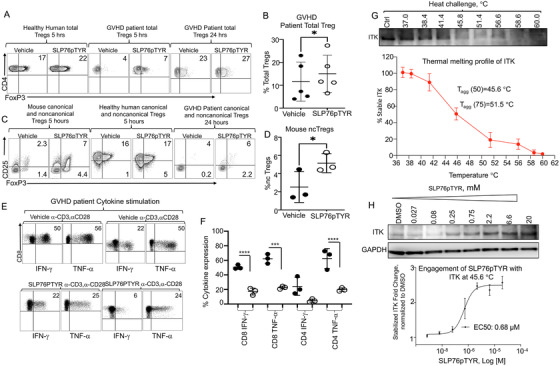
Regulatory T cells (Tregs) play an important role in controlling autoimmunity and limiting tissue damage and inflammation. IL2-inducible T cell kinase (Itk) is part of the Tec family of tyrosine kinases and is a critical component of T cell receptor mediated signaling. Here, we showed that either genetic ablation of Itk signaling or inhibition of Itk signaling pathways resulted in increased frequency of "noncanonical" CD4+ CD25- FOXP3+ Tregs (ncTregs), as well as of "canonical" CD4+ CD25+ FOXP3+ Tregs (canTregs). Using in vivo models, we showed that ncTregs can avert the formation of acute graft-versus-host disease (GVHD), in part by reducing conventional T cell proliferation, proinflammatory cytokine production, and tissue damage. This reduction in GVHD occurred without disruption of graft-versus-leukaemia (GVL) effects. RNA sequencing revealed that a number of effector, cell adhesion, and migration molecules were upregulated in Itk-/- ncTregs. Furthermore, disrupting the SLP76: ITK interaction using a specific peptide inhibitor led to enhanced Treg development in both mouse and primary human cells. This peptide inhibitor also significantly reduced inflammatory cytokine production in primary GVHD patient samples and mouse T cells without causing cell death or apoptosis. We provide evidence that specifically targeting Itk signaling could be a therapeutic strategy to treat autoimmune disorders.

Keywords: CCR7; CTLA-4; CXCR3; GVHD; GVL; ICOS; Itk; PD-1; SLP76pTYR; Tregs; canonical Tregs; noncanonical Tregs.


Conflict of interest statement

AA receives research support from 3M Corporation. The other authors declare no conflicts of interest.

Figures

FIGURE 1
FIGURE 1
T cells from Itk−/– mice delay GVHD even at high doses. (A) We have used MHC‐mismatched donors and recipients in order to induce GVHD, T cell‐depleted bone marrow (TCDBM) from C57Bl/6 (B6) mice, donor T cells from C57BL/6 (B6) WT or Itk –/− C57BL/6 background mice (MHC haplotype b) were administered in the lethally irradiated BALB/c (MHC haplotype d) recipients. Different numbers of CD4+ and CD8+ T cells from WT or Itk–/– mice were purified and mixed at a 1:1 ratio and transplanted into lethally irradiated BALB/c mice, along with 2 × 105 B‐ALL‐luc cells and 10 × 106 T cell depleted bone marrow cells. Group 1 received 10 × 106 T cell depleted bone marrow only (labelled as TCDBM). Group 2 received 10 × 106 T cell depleted bone marrow along with 2 × 105 B‐ALL‐luc cells (TCDBM+B‐ALL‐luc). Group 3 was transplanted with 10 × 106 T cell depleted bone marrow with 0.5 × 106 purified CD8+ and 0.5 × 106 CD4+ T cells from WT C57Bl/6 mice (1:1 ratio), along with 2 × 105 B‐ALL‐luc+ cells (TCD BM+WT CD8+CD4 (1 × 106) + B‐ALL‐luc). Group 4 received 10 × 106 TCDBM with 2.5 × 106 purified CD8+ and 2.5 × 106 CD4+ T cells from WT C57Bl/6 mice (1:1 ratio), along with 2 × 105 B‐ALL‐luc+ cells (TCDBM+WT CD8+CD4 (5 × 106) +B‐ALL‐luc). Group 5 received 10 × 106 TCDBM with 5 × 106 purified WT CD8+ and 5 × 106 CD4+ T cells from WT C57Bl/6 mice (1:1 ratio), along with 2 × 105 B‐ALL‐luc+ cells (BM+WT CD8+CD4 (10 × 106) +B‐ALL‐luc). Group 6 was transplanted with 10 × 106 TCDBM with 0.5 × 106 purified Itk–/– CD8+ and 0.5 × 106 CD4+ T cells (1:1 ratio), along with 2 × 105 B‐ALL‐luc+ cells (TCD BM+ Itk–/– CD8+CD4 (1 × 106) +B‐ALL‐luc). Group 7 was transplanted with 10 × 106 TCDBM with 2.5 × 106 purified Itk–/– CD8+ and 2.5 × 106 CD4+ T cells (1:1 ratio), along with 2 × 105 B‐ALL‐luc+ cells (TCD BM+ Itk–/– CD8+CD4 (5 × 106) +B‐ALL‐luc). Group 8 was transplanted with 10 × 106 TCDBM with 5 × 106 purified Itk–/– CD8+ and 5 × 106 CD4+ T cells (1:1 ratio), along with 2 × 105 B‐ALL‐luc+ cells (TCD BM+ Itk–/– CD8+CD4 (10 × 106) +B‐ALL‐luc). Recipient BALB/c mice were imaged using IVIS 50 three times a week. The mice were monitored for survival (B), changes in body weight (C), and clinical score (D) for about 50 days post BMT. (E) Quantitated luciferase bioluminescence of tumour growth. Statistical analysis of differences in survival (B) for different groups of recipient BALB/c mice is shown on the right. Statistics for differences in weight loss (C), score (D), and bioluminescence (E) are shown within the respective graphs. Groups of recipient BALB/c transplanted with T cells from WT mice were compared among each other and compared to recipient BALB/c transplanted with T cells from Itk–/– mice. Statistical analysis for survival and the clinical score was performed using a log‐rank test and one‐way ANOVA with Tukey's test, respectively. For weight changes and clinical score, one representative of two independent experiments is shown (n = 3 mice/group for BM alone; n = 5 experimental mice/group for all 7 other groups). Survival is a combination of two experiments. Symbol meaning for p values are: ns—p > .05; *p ≤ .05; **p ≤ .01; ***p ≤ .001; ****p ≤ .0001. Note: Control mouse is a recipient mouse given TCDBM only (group 1), used as a negative control for BLI (no bioluminescent tumour cells were given)
FIGURE 2
FIGURE 2
Itk deficiency enhances noncanonical Treg production. (A) Pre‐sorted WT and Itk–/– CD4+ T cells from spleens of naive mice were examined for expression of CD25 and FOXP3 by flow cytometry. (B) Next, for FACS, purified canonical and noncanonical Tregs from WT C57Bl/6 and Itk–/– mice were gated on CD4 and FOXP3 positive T cells and the non‐Treg CD4+ T cells were excluded; then Tregs were gated on CD25 and FOXP3 to confirm the canonical and noncanonical Tregs. (C) FACS purified CD4+ FOXP3+ Tregs from either C57BL/6‐FOXP3RFP or Itk –/− FOXP3RFP mice were transplanted into lethally irradiated BALB/c animals along with CD8+ T cells from WT C57Bl/6 mice. At day 7 post‐transplant, donor Tregs from the recipient spleen (C) or liver (D) were gated on H‐2kb and CD3 to identify the donor T cells. Next, T cells were gated on CD4 and CD8 markers, followed by CD4 versus FOXP3 gating to plot CD25 and FOXP3 for determining canonical and noncanonical Tregs. E‐F) CD4+ T cells were obtained from naive WT C57Bl/6 mice and Itk –/– mice, and either stained immediately or cultured for 6 h with or without anti‐CD3/anti‐CD28. Cells were then stained for CTLA‐4, CD3, CD4, CD25 and FOXP3. CTLA‐4 expression in (E) CD25+ FOXP3+ (canonical) Tregs from WT or Itk –/– mice and (H) in CD25 FOXP3+ (noncanonical) Tregs from WT or Itk –/– mice. (G) Canonical and noncanonical Tregs from naive WT C57Bl/6 mice and Itk –/– mice were examined for CD44 and CD62L expression. (H) Conventional CD8+ and CD4+ T cells from naive WT C57Bl/6 mice and Itk –/– mice were examined for CD44 and CD62L expression. (I) CXCR3 expression in canonical and noncanonical WT or Itk –/– Tregs from naive mice. (J) PD‐1 expression in canonical and noncanonical WT or Itk –/– Tregs from naive mice. (K) ICOS expression in canonical and noncanonical WT or Itk –/– Tregs from naive mice. (L) CCR7 expression in canonical and noncanonical WT or Itk –/– Tregs from naive mice. One experiment is shown as a representative from two independent experiments, for statistics data from two to three independent experiments pooled. Statistical analysis was performed using one‐way ANOVA with Tukey's test, p value presented with each figure. Symbol meaning for p values are: ns, p > .05; * p ≤ .05; ** p ≤ .01; *** p ≤ .001; **** p ≤ .0001
FIGURE 3
FIGURE 3
Noncanonical Itk –/− Tregs suppress GVHD but maintain GVL effects. (A) Group 1 BALB/c recipient mice were lethally irradiated and transplanted with 10 × 106 TCDBM, alone. Group 2 BALB/c mice were transplanted with 10 × 106 TCDBM and 1 × 105 primary tumour cells (B‐ALL‐luc +). Group 3 BALB/c mice were transplanted with 10 × 106 TCDBM +1 × 106 WT CD8+ T cells and 1 × 105 primary tumour cells (B‐ALL‐luc +). Group 4 BALB/c mice were transplanted with 10 × 106 TCDBM, 1 × 106 WT CD8+T cells, and 1 × 105 primary tumour cells (B‐ALL‐luc +), and were treated with 0.5 × 106 canonical Tregs from WT C57Bl/6 mice. Group 5 BALB/c mice were transplanted with 10 × 106 TCDBM,1 × 106 WT CD8+T cells, and1 × 105 primary tumour cells (B‐ALL‐luc +), and were treated with 0.5 × 106 canonical Tregs from Itk–/– mice. Group 6 BALB/c mice were transplanted with 10 × 106 TCDBM, 1 × 106 WT CD8+T cells, and 1 × 105 primary tumour cells (B‐ALL‐luc +), and were treated with 0.5 × 106 noncanonical Tregs from Itk–/– mice. Tregs were sorted from either WT mice or Itk –/− mice using CD4, CD25, and FOXP3RFP. Recipient BALB/c mice were imaged using IVIS 200 three times a week. Recipient BALB/c mice were also monitored for (B) changes in body weight, and (C) clinical score, and (D) survival for more than 40 days post BMT. For body weight changes and clinical score, one representative of two independent experiments is shown (n = 3 mice/group for BM alone; n = 5 experimental mice/group for all five other groups). (E) Quantitated luciferase bioluminescence of tumour growth. (F) Mortality from GVHD and tumour during the experiment, as a percent of mice dead. Statistical analysis for survival and the clinical score was performed using the log‐rank test and one‐way ANOVA with Tukey's test, respectively, and analysis for weight changes was done using one‐way ANOVA with Tukey's test. One representative experiment out of 2 is shown for A, C‐E. B and F are a combination of two experiments, three‐ to five mice per group. Symbol meaning for p values are: ns, p > .05; * p ≤ .05; ** p ≤ .01; *** p ≤ .001; **** p ≤ .0001. Note: Control mouse is a recipient mouse given TCDBM only (group 1), used as a negative control for BLI (no bioluminescent tumour cells were given)
FIGURE 4
FIGURE 4
Noncanonical Itk –/− Tregs suppress serum level inflammatory cytokine production by donor T cells. (A‐F) 1 × 106 purified WT CD3+ T cells were transplanted with TCDBM into irradiated BALB/c mice. At day 7 post allo‐HSCT, recipient BALB/c were euthanized and serum cytokines (IFN‐γ, TNF‐α, IL17A, IL‐5, IL‐2 and TGF‐β were determined by multiplex ELISA. (G) IFN‐γ expression by donor CD8+ T cells taken from recipient spleen 7 days post‐transplant. (H) TNF‐α expression by donor CD8+ T cells taken from recipient spleen 7 days post‐transplant. Combined data from two independent experiments is shown for cytokine restimulation. Statistical analysis was performed using one‐way ANOVA with Tukey's test, p value presented with each figure. Symbol meaning for p values are: ns, p > .05; * p ≤ .05; ** p ≤ .01; *** p ≤ .001; **** p ≤ .0001. One experiment's data are shown as representative from three independent experiments for serum ELISA
FIGURE 5
FIGURE 5
Noncanonical Itk –/− Tregs suppress donor T cell proliferation in vivo, resulting in less damage to GVHD target organs. (A) BALB/c recipient mice for all groups were lethally irradiated and transplanted with 10 × 106 T cell‐depleted bone marrow cells and 1 × 106 WT‐luc + CD8+ T cells (donor T cells expressing luciferase). Group 1 recipient mice were not given any additional cells (non‐treated). Group 2 BALB/c recipient mice were treated with FACS sorted canonical Tregs from WT C57Bl/6 mice. Group 3 BALB/c recipient mice were treated with FACS sorted canonical Tregs from Itk –/− mice. Group 4 BALB/c recipient mice were treated with FACS sorted noncanonical Tregs from Itk –/− mice. Recipient BALB/c mice were imaged using IVIS 50 every day for 7 days post‐transplant in order to track the transplanted WT‐luc + CD8 T cells' proliferation in the different treatment groups. (B) Quantification of luciferase bioluminescence, representing CD8‐luc + donor T cell proliferation. Statistical analysis was performed using one‐way ANOVA with Tukey's test, one experiment is shown. (C‐D) BALB/c mice were transplanted as described in (A), except the WT CD8 T cells were from WT mice (not WT luc). At day 7 post‐transplantation, recipient mouse livers and small intestines were obtained, sectioned, and stained with H&E. Representative photos or recipient organs for each treatment group are shown. Statistical analysis was performed using a Chi‐square test and Kruskal Wallis test followed by Dunn's multiple comparison test. p Value presented with the figure. Symbol meaning for p values are: ns, p > .05; * p ≤ .05; ** p ≤ .01; *** p ≤ .001; **** p ≤ .0001. One experiment is shown as a representative from two independent experiments
FIGURE 6
FIGURE 6
Noncanonical Itk –/− Tregs have different gene expression patterns than canonical Tregs. (A) Volcano plot showing differentially expressed genes (FDR ≤ .1) between Itk–/– canonical and WT canonical Tregs. (B) Hierarchical clustering of genes and heatmap illustrating expression of genes compared between Itk–/– canonical and WT canonical Tregs. All replicates are shown (n = 3) for each group. Modules are identified by numbers and by colour distinguishing up‐ and downregulated genes in groups. (C) Table showing the number of up or downregulated DEGs between groups for each of three separate comparisons made. (D) GO annotation analysis table of up‐ and downregulated genes between Itk–/– canonical and WT canonical Treg groups. (E) Volcano plot showing differentially expressed genes (FDR≤ .05) between Itk–/– noncanonical and Itk–/– canonical Tregs. (F) Hierarchical clustering of genes and heatmap illustrating expression of genes compared between Itk–/– noncanonical and Itk–/– canonical Tregs. (G) GO annotation analysis table of up‐ and downregulated genes between Itk–/– noncanonical and Itk–/– canonical Treg groups. (H) Volcano plot showing differentially expressed genes (FDR≤.05) between Itk–/– noncanonical and WT canonical Tregs. (I) Hierarchical clustering of genes and heatmap illustrating expression of genes compared between Itk–/– noncanonical and WT canonical Tregs. (J) GO annotation analysis table of up‐ and downregulated genes between Itk–/– noncanonical and WT canonical Treg groups
FIGURE 7
FIGURE 7
Gene set enrichment analysis of the WT or Itk –/− Treg groups. (A) Gene Set Enrichment Analysis (GSEA) results of Itk–/– canTregs versus WT canTregs using MSigDB C7 (immunological) gene sets. Negative normalized enrichment score (NES) is an indicator of downregulation and positive NES is an indicator of upregulation of the genes in the corresponding pathway. Colour specifies the group (Itk–/– canTregs or WT canTregs) in which expression is enriched; colour transparency indicates the negative Log10 of adjusted p value. (B) GSEA results of Itk–/– canTregs versus WT canTregs using MSigDB C2 (curated) gene sets. (C) GSEA results of Itk–/– ncTregs versus WT canTregs using MSigDB C7 (immunological) gene sets. (D) GSEA results of Itk–/– ncTregs versus Itk–/– canTregs using MSigDB C7 (immunological) gene sets. (E) Running enrichment score (ES) for the “ICHIBA_GRAFT_VERSUS_HOST_DISEASE_35D_UP” pathway genes, comparing Itk–/– ncTregs to WT canTreg. The ES for the pathway is defined as the peak score furthest from zero, with a negative ES meaning enrichment in the WT canTregs group. (F) GSEA results of Itk–/– ncTregs versus WT canTregs using MSigDB C2 (curated) gene sets. (G) GSEA results of Itk–/– ncTregs versus Itk –/− canTregs using MSigDB C2 (curated) gene sets
FIGURE 8
FIGURE 8
Disruption of Itk/SLP76 Y145 signaling enhanced FOXP3 expression and decreased proinflammatory cytokines in healthy human and GVHD patient samples. Peripheral blood mononuclear cells (PBMCs) of healthy donors or from GVHD patient donors, or mouse CD3 T cells were isolated from the spleens of naive WT C57Bl/6 mice. For Treg cell culture, cells were resuspended in media and stimulated with anti‐CD3 in the presence of Polybrene and SLP76pTYR or vehicle. Cells were cultured for 5 to 24 h, then stained for Treg markers. (A) CD4+ FoxP3+ cell percentage in 5‐ or 24‐h SLP76pTYR‐ or vehicle‐treated healthy human or GVHD patient PBMCs. (B) Quantification of five independent experiments of (A). (C) Canonical (CD4+ CD25+ FoxP3+) and noncanonical (CD4+ CD25 FoxP3+) Treg percentage in SLP76pTYR or vehicle‐treated mouse T cells, healthy human PBMCs, and GVHD patient PBMCs. (D) Quantification of noncanonical Tregs in mice which were treated with SLP76pTYR or vehicle alone, from three independent experiments. (E) Human GVHD PBMC samples were stimulated with anti‐CD3/anti‐CD28 and treated with vehicle or SLP76pTYR, then cultured in the presence of GolgiPlug for 6 h. Cells were then stained for IFN‐γ and TNF‐α and analyzed by flow cytometry for CD8+ and CD4+ T cells. (F) Quantification of GVHD patient IFN‐γ and TNF‐α expression in CD8+ and CD4+T cells treated with vehicle or SLP76pTYR, from three independent experiments. (G‐H) CETSA was performed using fresh cell lysate from purified cultured mouse T cells, prepared in non‐denaturing buffer. Cell lysate was dispensed into a 96‐well PCR plate in the above medium (approx. 10 000 cells/well/50 μL), then was subjected to a temperature gradient (37‐60°C) for 20 min. Subsequently, centrifugation was performed at 14 000 rpm to sediment the unstable protein content. Supernatant was collected and an SDS‐PAGE gel was run, and immuno‐detection was performed for ITK using the corresponding primary antibody. Band intensity was quantified on a LI‐COR C‐Digit Blot Scanner, and the T agg(50) and T agg(75) values were calculated for ITK (G). In a subsequent run (H), fresh lysates from purified mouse T cells were treated at various doses with threefold dilutions (20, 6.6, 2.2, 0.75, 0.25, 0.08 and 0.027 μM) of the peptide SLP76pTYR or the DMSO control, for 1 h. Samples were then subjected to heat challenge at T agg(50) for 20 min, and unstable protein was removed by a centrifugation step. Following an immuno‐blotting step, bands of remaining stable ITK were quantified, normalized to loading control and plotted using GraphPad Prism software. EC50 values of engagement for both compounds with ITK were subsequently calculated. Statistical analysis was performed using one‐way ANOVA, p value presented with each figure. Symbol meaning for p values are: ns, p > .05; * p ≤ .05; ** p ≤ .01; *** p ≤ .001; **** p ≤ .0001. One experiment is shown as a representative from 3 independent experiments, for statistics data from 2–3 independent experiments pooled

References

    1. Sakaguchi S, Yamaguchi T, Nomura T, Ono M. Regulatory T cells and immune tolerance. Cell. 2008;133(5):775‐787. 10.1016/j.cell.2008.05.009 - DOI - PubMed
    1. Heinrichs J, Bastian D, Veerapathran A, Anasetti C, Betts B, Yu XZ. Regulatory T‐cell therapy for graft‐versus‐host disease. J Immunol Res Ther. 2016;1(1):1‐14. - PMC - PubMed
    1. Whangbo JS, Antin JH, Koreth J. The role of regulatory T cells in graft‐versus‐host disease management. Expert Rev Hematol. 2020;13(2):141‐154. 10.1080/17474086.2020.1709436 - DOI - PubMed
    1. Ruhnau J, Schulze J, von Sarnowski B, et al. Reduced numbers and impaired function of regulatory T cells in peripheral blood of ischemic stroke patients. Mediators Inflamm. 2016;2016:2974605. 10.1155/2016/2974605 - DOI - PMC - PubMed
    1. Li Z, Li D, Tsun A, Li B. FOXP3+ regulatory T cells and their functional regulation. Cell Mol Immunol. 2015;12(5):558‐565. 10.1038/cmi.2015.10 - DOI - PMC - PubMed

Publication types

MeSH terms