. 2021 Dec 17;7(51):eabg3750.
doi: 10.1126/sciadv.abg3750. Epub 2021 Dec 17.

Comprehensive analysis of spatial architecture in primary liver cancer

Affiliations

Comprehensive analysis of spatial architecture in primary liver cancer

Rui Wu et al. Sci Adv. .

Abstract

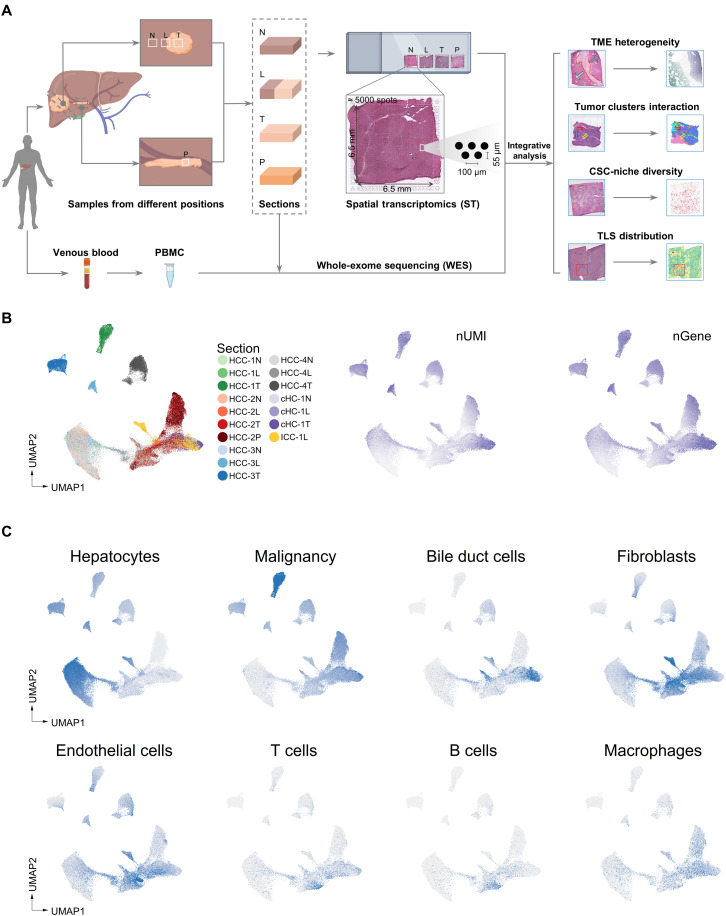
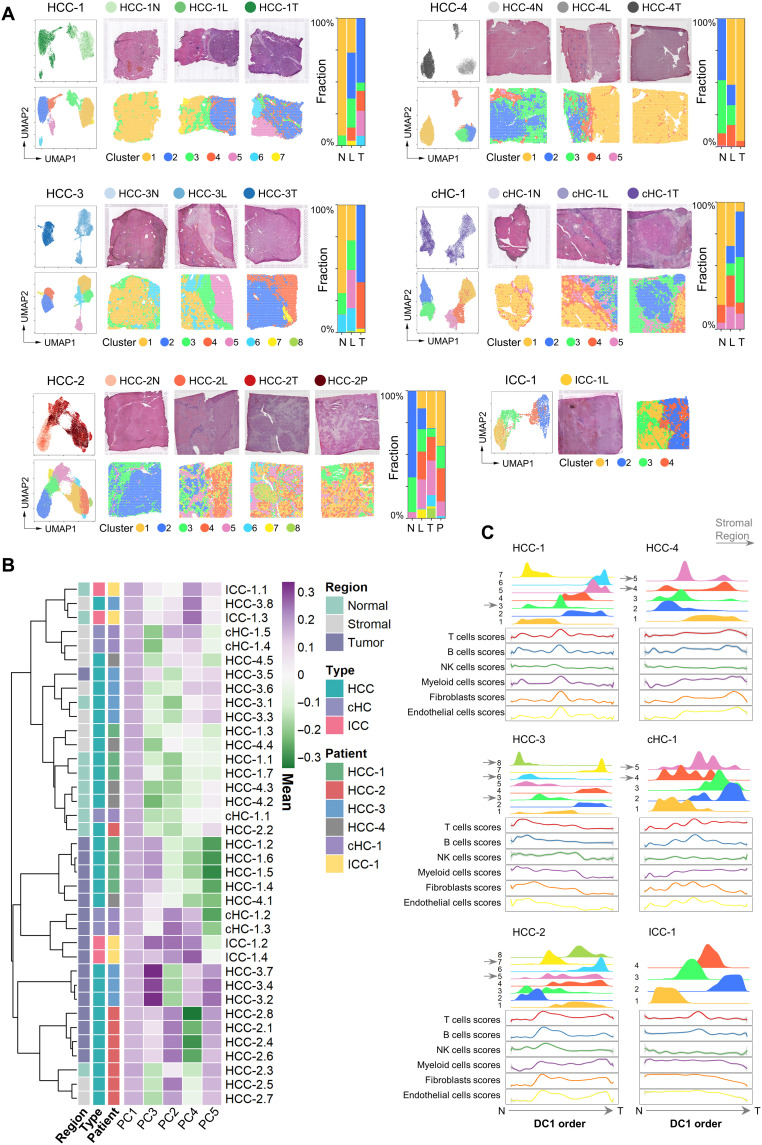
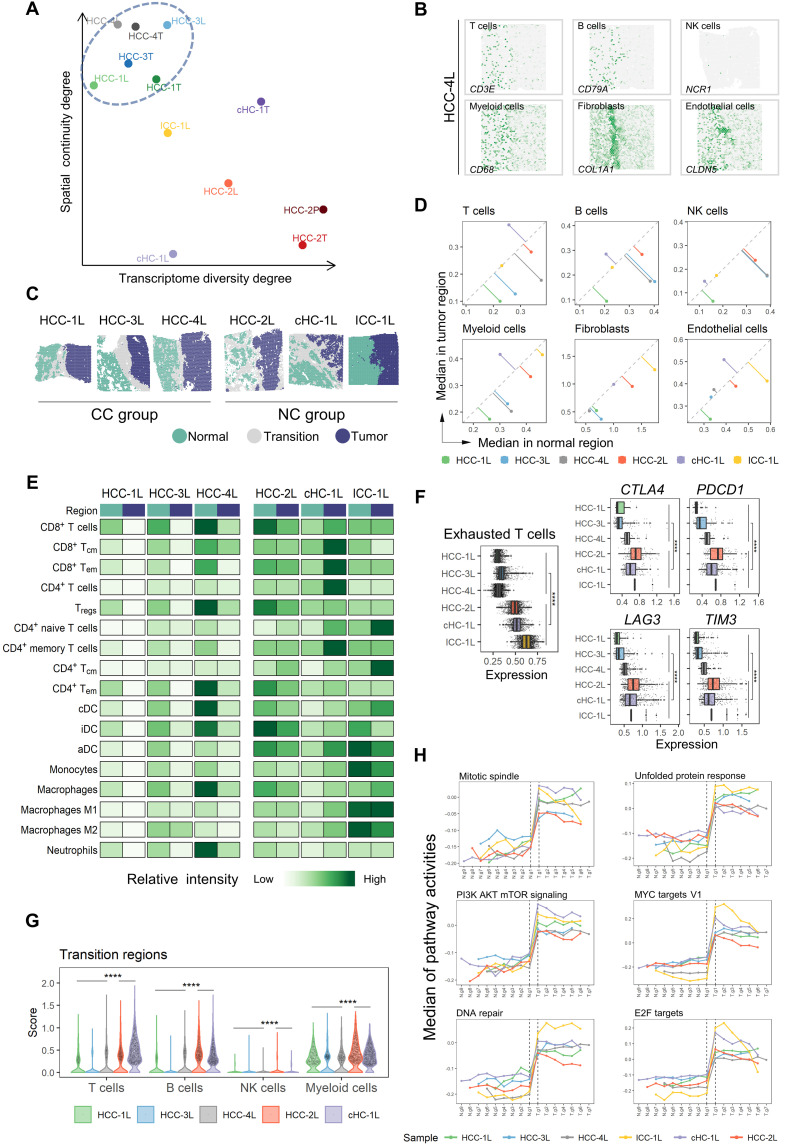
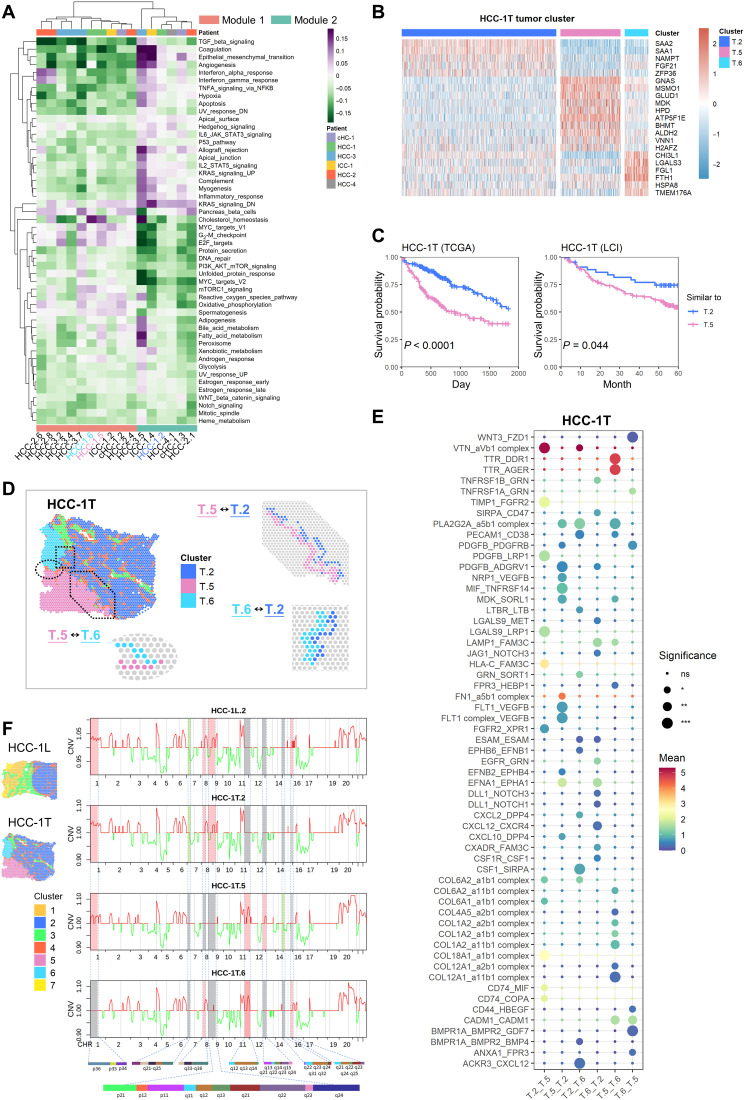
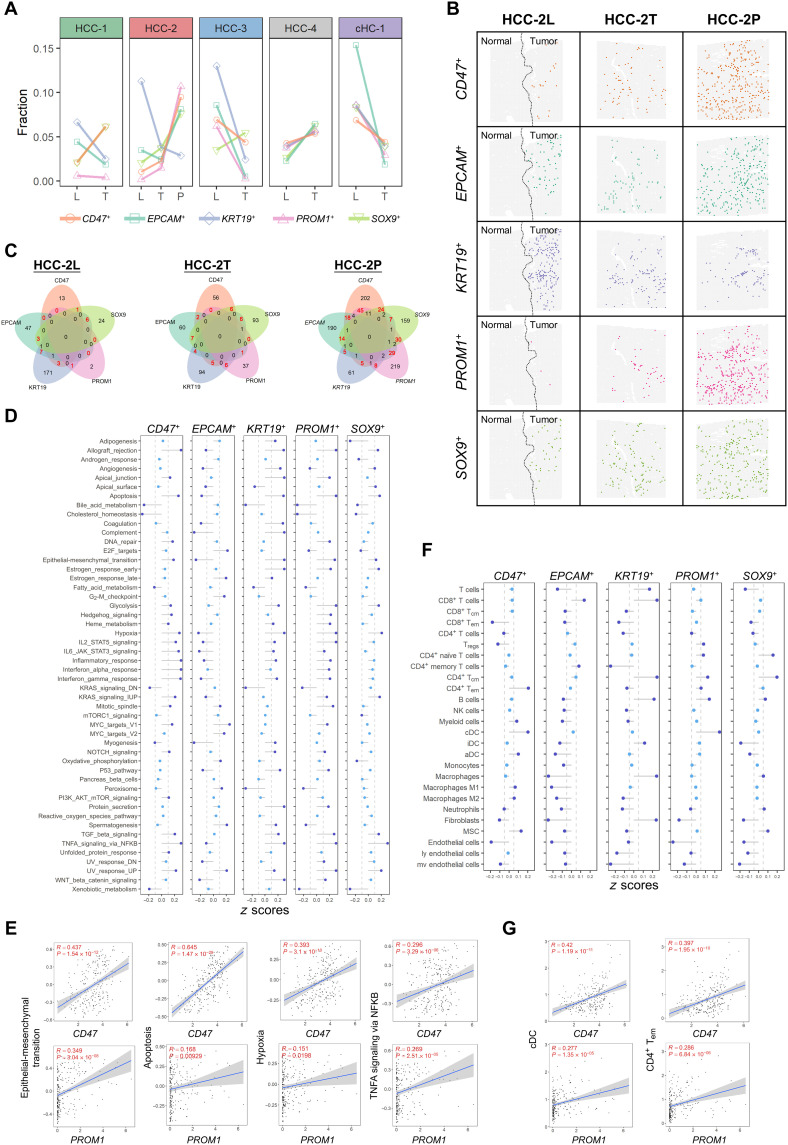
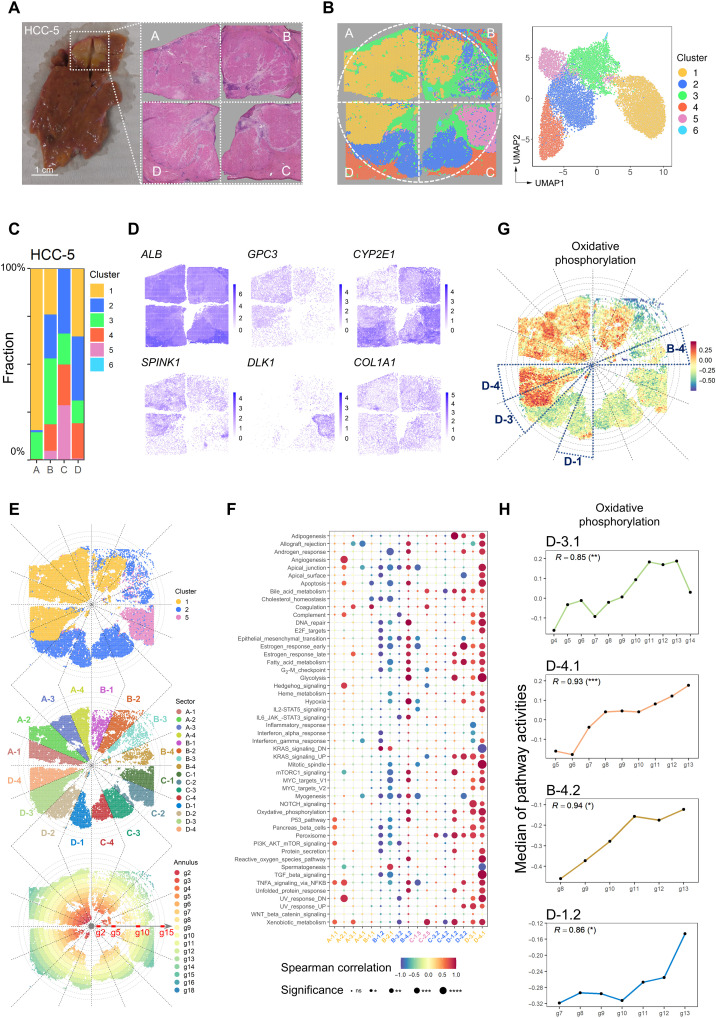
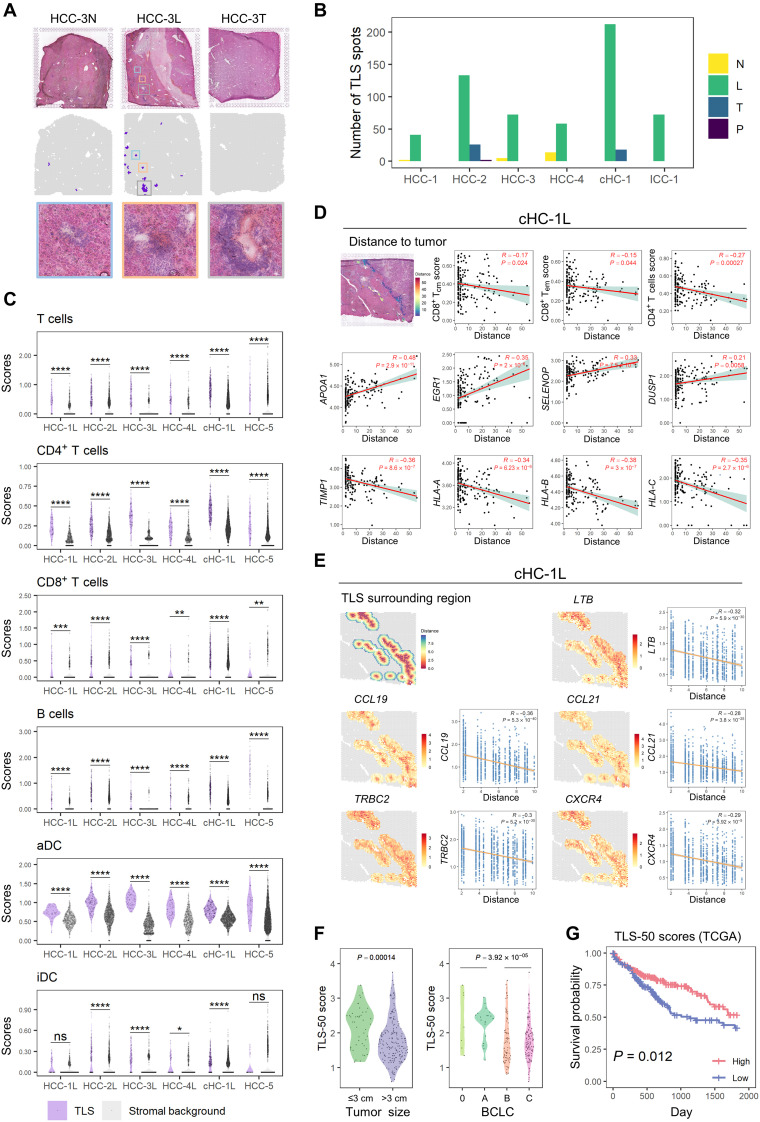
Heterogeneity is the major challenge for cancer prevention and therapy. Here, we first constructed high-resolution spatial transcriptomes of primary liver cancers (PLCs) containing 84,823 spots within 21 tissues from seven patients. The progressive comparison of spatial tumor microenvironment (TME) characteristics from nontumor to leading-edge to tumor regions revealed that the tumor capsule potentially affects intratumor spatial cluster continuity, transcriptome diversity, and immune cell infiltration. Locally, we found that the bidirectional ligand-receptor interactions at the 100-μm-wide cluster-cluster boundary contribute to maintaining intratumor architecture and the PROM1+ and CD47+ cancer stem cell niches are related to TME remodeling and tumor metastasis. Last, we proposed a TLS-50 signature to accurately locate tertiary lymphoid structures (TLSs) spatially and unveiled that the distinct composition of TLSs is shaped by their distance to tumor cells. Our study provides previous unknown insights into the diverse tumor ecosystem of PLCs and has potential benefits for cancer intervention.


Figures

Fig. 1.
Fig. 1.. Exploration of PLC architecture with ST.
(A) Workflow of PLC samples collection, processing for ST and WES, and data analysis. (B) UMAP (Uniform Manifold Approximation and Projection) plot of spots from all sections, colored by their sample source, the number of expressed unique molecular identifiers (nUMI) and genes (nGene), respectively. HCC-1N represented the N section of HCC-1. (C) UMAP plot of cell type enrichment scores from all sections. Each dot represents a spot of ST sections, and the shade of color represents the scores of the corresponding cell type.
Fig. 2.
Fig. 2.. Different patterns of PLC spatial heterogeneities.
(A) Left: For each patient: UMAP of the spots colored by their section sources (top) and cluster identities (bottom), respectively. Middle: H&E staining (top) and the spatial cluster distribution (bottom) of each section in order of N/L/T/P. Right: Fraction of clusters in each section. (B) Similarity comparison of the clusters across different patients. The clusters’ tissue regions, histopathological types, and patient information were annotated on the left. HCC-1.1 represented the cluster 1 of HCC-1. The clusters’ normal, stromal, and tumor region labels were annotated according to the expression profile of marker genes and the corresponding tissue types in H&E image. (C) Distribution of the clusters (top half plot of each patient; y axis, the cluster’s density) and the main stromal and immune cell type scores (bottom half plot; y axis, the fitted cell type enrichment score) along the direction of the first diffusion map component (DC1 order, the shared x axis).
Fig. 3.
Fig. 3.. Microenvironment characteristics in leading-edge area.
(A) Transcriptome diversity degree and spatial continuity degree of tumor regions in L/T/P sections. (B) Spatial feature plots of six marker genes of stromal and immune cell types in HCC-4L. (C) Distribution of normal, tumor, and transition regions in L section and the grouping results of the CC (complete capsule) group and NC (non- or discontinuous capsule) group. (D) Comparison of the median of stromal and immune cell type scores between the normal (x axis) and the tumor (y axis) regions in each L section. (E) Comparison of the relative intensity (each row shared a color scale, while different rows did not) of stromal and immune cell subtype scores between the normal and tumor regions in each L section. iDC, interdigitating dendritic cell; aDC, active dendritic cell. (F) Comparison of the expression levels of exhausted T cell signature, CTLA4, PDCD1, LAG3, and TIM3, between the CC and NC groups. Two-sided Wilcoxon rank sum tests on the CC and NC groups were used to analyze the significance of their differences. ****P < 0.0001. (G) Comparison of the immune cell scores in the “transition regions” between the CC and NC groups. One-sided Wilcoxon rank sum tests (the CC group was less than NC group) were used to calculate the statistical significance. ****P < 0.0001. (H) Changes of hallmark pathways’ activities along with the gradient divisions on both sides of the transition region. Each dot indicated the median of the pathway activity in the corresponding area. PI3K, phosphoinositide 3-kinase; mTOR, mammalian target of rapamycin.
Fig. 4.
Fig. 4.. Intratumor heterogeneity in PLCs.
(A) Clustered heatmap of tumor clusters’ hallmark pathway average activities. The tumor clusters were grouped into two functional modules. HCC-1.2 represented cluster 2 of HCC-1. TGF, transforming growth factor; TNFA, tumor necrosis factor a; NFKB, nuclear factor kappa B subunit; UV, ultraviolet; IL6, interleukin 6; STAT3, signal transducer and activator of transcription 3; PI3K, phosphatidylinositol 3-kinase; mTOR, mammalian target of rapamycin. (B) Expression profiles of some differential expression genes of the clusters 2/5/6 in HCC-1T. T.2 represented cluster 2 in HCC-1T. (C) Survival curves of two groups of patients in The Cancer Genome Atlas (TCGA) and Liver Cancer Institute (LCI) cohorts to compare the relative malignancy of ST tumor cluster pairs (cluster 2 versus cluster 5 in HCC-1T). These two groups were divided according to which ST tumor cluster the bulk samples were more similar to an expression level. Log-rank test was used to measure the statistical significance of their relative malignancy degrees. (D) Definition of the boundary areas to study the interaction between two neighbor tumor clusters in HCC-1T. The regions with four spots wide along the boundary lines in each cluster were selected, and the spots of stromal clusters were excluded. (E) Bubble heatmap showing the mean interaction strength between the neighbor clusters at the boundaries for ligand-receptor pairs. Dot size indicated the statistical significances by permutation test. *P < 0.05; **P < 0.01; ***P < 0.001. Dot color indicated the mean interaction strength levels. HCC-1T.2 represented cluster 2 in HCC-1T. ns, not significant. (F) Averaged copy number variation (CNV) profiles for each tumor cluster in HCC-1, inferred from spatial transcriptomes. The color of the lines indicated the amplification (red) and deletion (green). The differences between clusters were highlighted by background colors (red, green, and gray), and their detailed chromosome band labels were also presented. HCC-1L.2 represented cluster 2 in HCC-1L.
Fig. 5.
Fig. 5.. Functional analysis of heterogeneous CSC niches in PLCs.
(A) Fractions of the positive spots of the five CSC markers in indicated sections. (B) Distribution of the putative CSC niches (spots) of five CSC markers in the L/T/P sections of HCC-2. (C) Venn diagrams of the positive niches of the five CSC markers in L/T/P sections of HCC-2. The numbers of double-positive spots were highlighted in red. (D) Hallmark pathway activities (average z scores of HCC-2P) in the five types of CSC niches. TGF, transforming growth factor; TNFA, tumor necrosis factor a; NFKB, nuclear factor kappa B subunit; UV, ultraviolet; IL6, interleukin 6; STAT3, signal transducer and activator of transcription 3; PI3K, phosphatidylinositol 3-kinase; mTOR, mammalian target of rapamycin. (E) Scatter plots showing the correlation between hallmark pathway activities and the expression levels of the CSC markers (CD47 and PROM1) on bulk sequencing data of 239 HCC cases. Linear regression and Pearson correlation were used to measure their relation. (F) Cell type enrichment scores (average z scores of HCC-2P) in the five types of CSC niches. MSC, mesenchymal stem cells. (G) Scatter plots showing the correlation between cell type enrichment scores and the expression levels of the CSC markers (CD47 and PROM1) on bulk sequencing data of 239 HCC cases. Linear regression and Pearson correlation were used to measure their relation.
Fig. 6.
Fig. 6.. The global view tumor heterogeneity within one intact HCC nodule.
(A) A case of HCC (HCC-5) with a diameter of about 1 cm was divided into four sections (A, B, C, and D sections) to analyze the global spatial heterogeneity. Photo credit: Rui Wu, International Cooperation Laboratory on Signal Transduction, Eastern Hepatobiliary Surgery Hospital, Shanghai 200438, China. (B) Distribution of clusters in the tissue space and UMAP space. (C) Fractions of the clusters in each section. (D) Spatial feature plots of six differentially expressed genes on HCC-5. (E) Distribution of the divided sectors and annuluses on the tumor region (top). Each section was equally divided into four sectors (middle). Each annulus area was five spots wide (bottom). (F) Bubble heatmap showing the Spearman correlation between the median of the hallmark pathway activities and the annular orders in the tumor clusters of different sectors. A-1.1 represented cluster 1 in sector A-1. Dot color indicated the correlation values. Dot size indicated the statistical significance. *P < 0.05; **P < 0.01; ***P < 0.001; ****P < 0.0001. (G) Spatial distribution of the oxidative phosphorylation pathway activities. (H) Change of oxidative phosphorylation pathway median activities along with the annulus orders from inside to the outside in the D-3.1, D-4.1, B-4.2, and D-1.2 (bottom). The Spearman correlations and statistical significances were labeled. *P < 0.05; **P < 0.01; ***P < 0.001.
Fig. 7.
Fig. 7.. Spatial distribution and clinical significance of TLS.
(A) TLSs identified by TLS-50 signature and their corresponding H&E staining images in HCC-3. (B) Bar plot showing the distribution of the identified TLS spots in the different sections of each patient. (C) Violin plots showing the signature difference of immune cell type scores in the TLSs and their surrounding stromal backgrounds. Statistical significances were determined by two-sided Wilcoxon rank sum tests. *P < 0.05; **P < 0.01; ***P < 0.001; ****P < 0.0001. (D) Scatter plots showing the correlation between the cell type enrichment degrees or gene expression levels of TLS spots and their distances to tumor regions in cHC-1 L. These distances were presented at the H&E staining (the first subplot). Linear regression and Pearson correlation were used to measure the relation. (E) Spatial plots showing the surrounding regions (five spots wide) of TLSs in cHC-1 L, which were colored by the distances to TLS spots or some genes’ expression profiles. Scatter plots showing the correlation between these genes’ expression levels and the distances to TLS spots. Linear regression and Pearson correlation were used to measure the relation. (F) Violin plots showing the distribution of TLS-50 scores of the bulk sequencing data of 239 HCC cases, which were grouped by tumor sizes (left) and BCLC stages (right), respectively. (G) Survival curves of cases with high (top 50%) and low (bottom 50%) TLS-50 signature scores in TCGA cohorts. Log-rank test was used to measure the statistical significance.

References

    1. Dagogo-Jack I., Shaw A. T., Tumour heterogeneity and resistance to cancer therapies. Nat. Rev. Clin. Oncol. 15, 81–94 (2018). - PubMed
    1. Lawson D. A., Kessenbrock K., Davis R. T., Pervolarakis N., Werb Z., Tumour heterogeneity and metastasis at single-cell resolution. Nat. Cell Biol. 20, 1349–1360 (2018). - PMC - PubMed
    1. Zheng C., Zheng L., Yoo J. K., Guo H., Zhang Y., Guo X., Kang B., Hu R., Huang J. Y., Zhang Q., Liu Z., Dong M., Hu X., Ouyang W., Peng J., Zhang Z., Landscape of infiltrating T cells in liver cancer revealed by single-cell sequencing. Cell 169, 1342–1356.e16 (2017). - PubMed
    1. Su S., Chen J., Yao H., Liu J., Yu S., Lao L., Wang M., Luo M., Xing Y., Chen F., Huang D., Zhao J., Yang L., Liao D., Su F., Li M., Liu Q., Song E., CD10+GPR77+ cancer-associated fibroblasts promote cancer formation and chemoresistance by sustaining cancer stemness. Cell 172, 841–856.e816 (2018). - PubMed
    1. Chen K. H., Boettiger A. N., Moffitt J. R., Wang S., Zhuang X., RNA imaging. Spatially resolved, highly multiplexed RNA profiling in single cells. Science 348, aaa6090 (2015). - PMC - PubMed