. 2021 Dec 17;16(12):e0260933.
doi: 10.1371/journal.pone.0260933. eCollection 2021.

Flooding and ecological restoration promote wetland microbial communities and soil functions on former cranberry farmland

Affiliations

Flooding and ecological restoration promote wetland microbial communities and soil functions on former cranberry farmland

Rachel L Rubin et al. PLoS One. .

Abstract

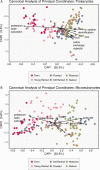
Microbial communities are early responders to wetland degradation, and instrumental players in the reversal of this degradation. However, our understanding of soil microbial community structure and function throughout wetland development remains incomplete. We conducted a survey across cranberry farms, young retired farms, old retired farms, flooded former farms, ecologically restored former farms, and natural reference wetlands with no history of cranberry farming. We investigated the relationship between the microbial community and soil characteristics that restoration intends to maximize, such as soil organic matter, cation exchange capacity and denitrification potential. Among the five treatments considered, flooded and restored sites had the highest prokaryote and microeukaryote community similarity to natural wetlands. In contrast, young retired sites had similar communities to farms, and old retired sites failed to develop wetland microbial communities or functions. Canonical analysis of principal coordinates revealed that soil variables, in particular potassium base saturation, sodium, and denitrification potential, explained 45% of the variation in prokaryote communities and 44% of the variation in microeukaryote communities, segregating soil samples into two clouds in ordination space: farm, old retired and young retired sites on one side and restored, flooded, and natural sites on the other. Heat trees revealed possible prokaryotic (Gemmatimonadetes) and microeukaryotic (Rhizaria) indicators of wetland development, along with a drop in the dominance of Nucletmycea in restored sites, a class that includes suspected mycorrhizal symbionts of the cranberry crop. Flooded sites showed the strongest evidence of wetland development, with triple the soil organic matter accumulation, double the cation exchange capacity, and seventy times the denitrification potential compared to farms. However, given that flooding does not promote any of the watershed or habitat benefits as ecological restoration, we suggest that flooding can be used to stimulate beneficial microbial communities and soil functions during the restoration waiting period, or when restoration is not an option.


Conflict of interest statement

The authors have declared that no competing interests exist.

Figures
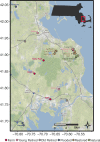
Fig 1
Fig 1. Map of study area.
23 sites were surveyed in southeast Massachusetts, spanning five treatments. Map tiles by Stamen Design, under CC BY 3.0. Data by OpenStreetMap (WGS-84), under ODbL.
Fig 2
Fig 2. Similarity between treatments and natural wetland sites.
Plots depict similarity scores for (A) prokaryote communities; (B) microeukaryote communities; and (C) Soil variables. Points indicate the mean similarity of each site to all samples drawn from natural sites, and vertical error bars are standard deviations of similarity scores (eight technical replicates are represented). Grey box plots indicate the median and interquartile range of all soil samples for each treatment category.
Fig 3
Fig 3. Canonical analysis of principal coordinates.
(A) Prokaryotic communities were distinct (capscale, p < 0.01), and the six largest predictors of community composition were: potassium base saturation, sodium, zinc, cation exchange capacity, denitrification potential, and iron. Together, soil variables explained 45% of the variation of the weighted UniFrac distance, whereas 52% of the variation was unconstrained. Conditional variables (latitude and longitude) explained the remaining 3% of the variation in this dataset. (B) Microeukaryote communities were distinct (capscale, p<0.01), and the six largest predictors of community composition were: potassium base saturation, sodium, pH, denitrification potential, copper and phosphorus. Together, soil variables explained 44% of the variation in the weighted UniFrac distance, whereas 49% of the variation was unconstrained. Conditional variables (latitude and longitude) explained the remaining 7% of the variation in this dataset.
Fig 4
Fig 4. Differences in prokaryotic taxa between treatments and natural wetlands.
Heat trees were constructed using the metacoder package [33], at the class taxonomic level. The size of the node in each cladogram is proportional to the number of unique classes within each phylum. Color intensity is proportional to the difference in abundance between natural sites and the other treatments, as calculated from the log2 ratio of median abundance. Young retired and old retired samples were pooled together for simplicity, since they had similar communities. Taxa that have a higher within-sample dominance in natural sites are shown in teal whereas taxa that have a higher within-sample dominance in farm, retired, flooded, and restored wetlands are shown in orange. Nonsignificant comparisons are shown in grey. Colored labels showcase example taxa that were consistently more (teal) or less (orange) abundant in natural sites or displayed variation across the four heat trees.
Fig 5
Fig 5. Differences in eukaryotic taxa between management histories and natural wetlands.
Heat trees were constructed using the metacoder package, at the class level. The size of the nodes in each cladogram is proportional to the number of unique classes within each phylum, and color intensity is proportionate to the difference in abundance between natural sites and each of the other management categories, calculated from the log2 ratio of median abundance. Young retired and old retired samples were pooled together for simplicity, since they had similar communities. Taxa that have a higher within-sample dominance in natural sites are shown in teal whereas taxa that have a higher within-sample dominance in farm, retired, flooded, and restored wetlands are shown in orange. Nonsignificant comparisons are shown in grey. Colored labels showcase example taxa that were consistently more (teal) or less (orange) abundant in natural sites or displayed variation across the four heat trees.
Fig 6
Fig 6. Relative dominance of two most common eukaryotic genera.
The two most common eukaryotic genera were Archaeorhizomyces and Cairneyella, suspected mycorrhizal symbionts of the cranberry crop. Both genera had lower median within-sample dominance in young retired farms, old retired farms, flooded, restored, and natural sites than in cranberry farms. Points indicate mean abundance for each site and vertical lines are standard errors calculated from eight technical replicates. Grey box plots indicate the median and interquartile range of all soil samples within each treatment category.

References

    1. Ballantine KA, Schneider R. Fifty-five years of soil development in restored freshwater depressional wetlands. Ecological Applications. 2009;19:1467–1480. doi: 10.1890/07-0588.1 - DOI - PubMed
    1. Strickland MS, Callaham MA, Gardiner ES, Stanturf JA, Leff JW, et al.. Response of soil microbial community composition and function to a bottomland forest restoration intensity gradient. Appl Soil Ecol. 2017;119:317–326.
    1. Sims A, Zhang Y, Gajaraj S, Brown PB, Ju Z. Toward the development of microbial indicators for wetland assessment. Water Res. 2013;1711–1725. doi: 10.1016/j.watres.2013.01.023 - DOI - PubMed
    1. Astudillo-García C, Hermans SM, Stevenson B, Buckley HL, Lear G. Microbial assemblages and bioindicators as proxies for ecosystem health status: potential and limitations. Appl Microb Biotechnol. 2019;103:6407–6421. doi: 10.1007/s00253-019-09963-0 - DOI - PubMed
    1. Hermans SM, Buckley HL, Case BS, Curran-Cournane F, Taylor M, Lear. Using soil bacterial communities to predict physico-chemical variables and soil quality. Microbiome 2020;8:79. doi: 10.1186/s40168-020-00858-1 - DOI - PMC - PubMed

Publication types