. 2022 Apr 29;145(3):964-978.
doi: 10.1093/brain/awab446.

Single-cell sequencing of human midbrain reveals glial activation and a Parkinson-specific neuronal state

Affiliations

Single-cell sequencing of human midbrain reveals glial activation and a Parkinson-specific neuronal state

Semra Smajić et al. Brain. .

Abstract

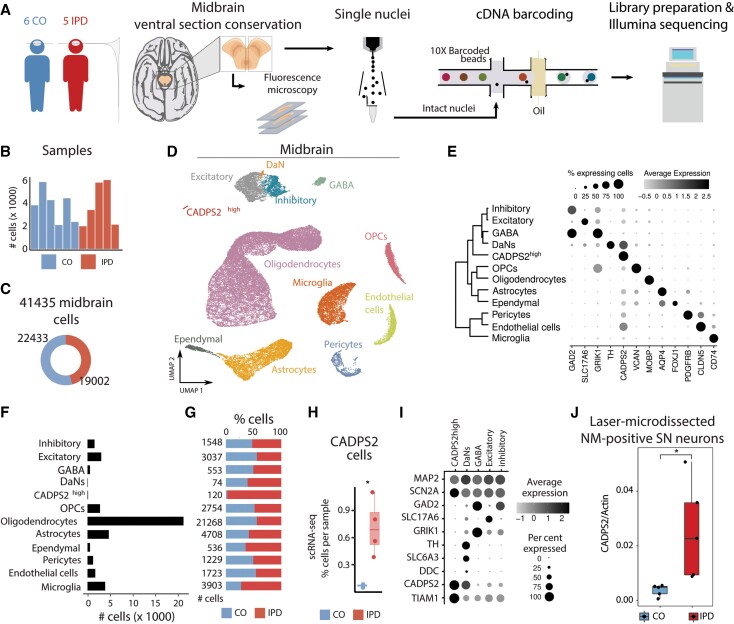
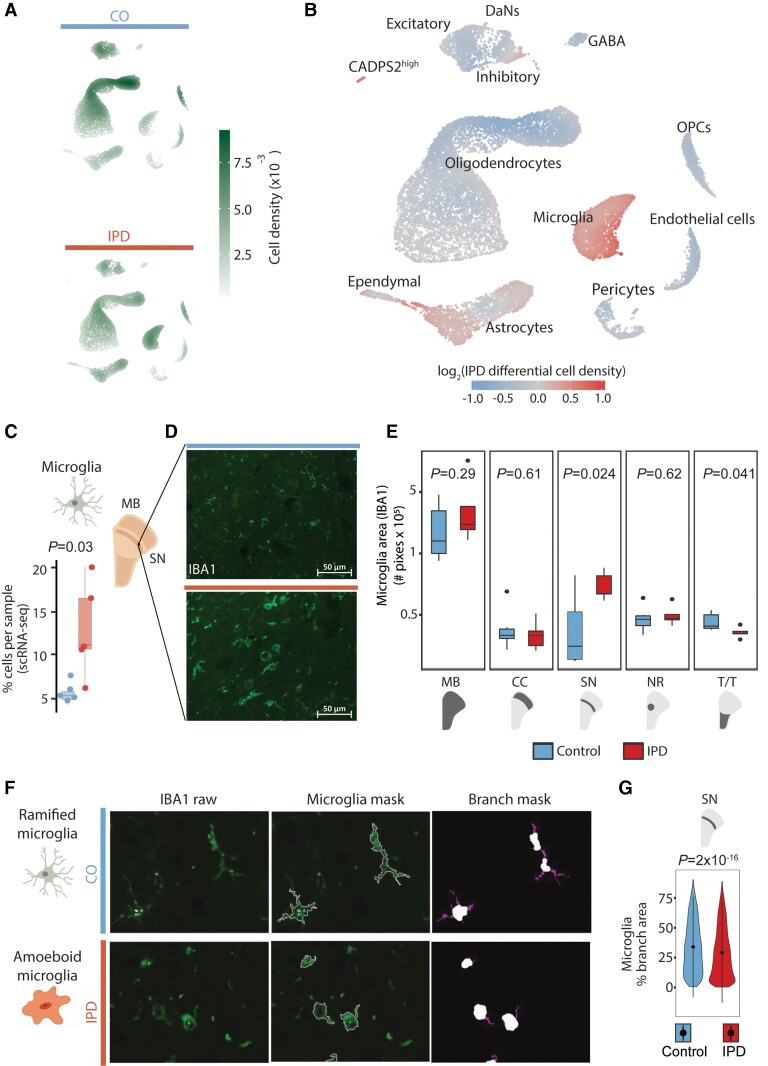
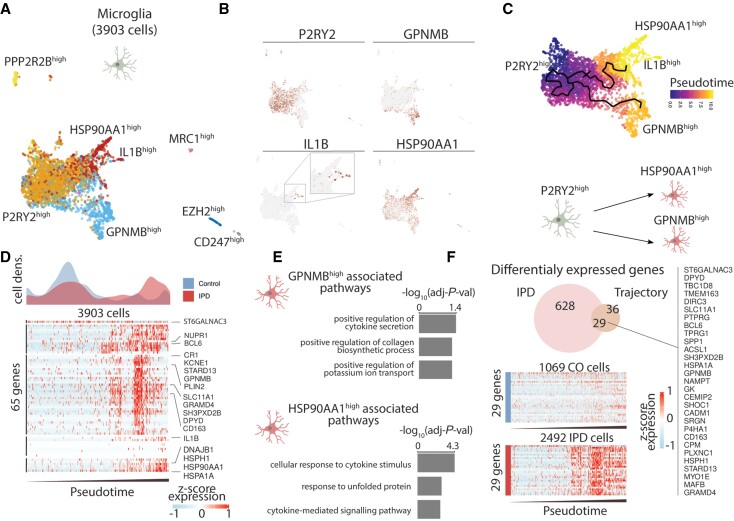
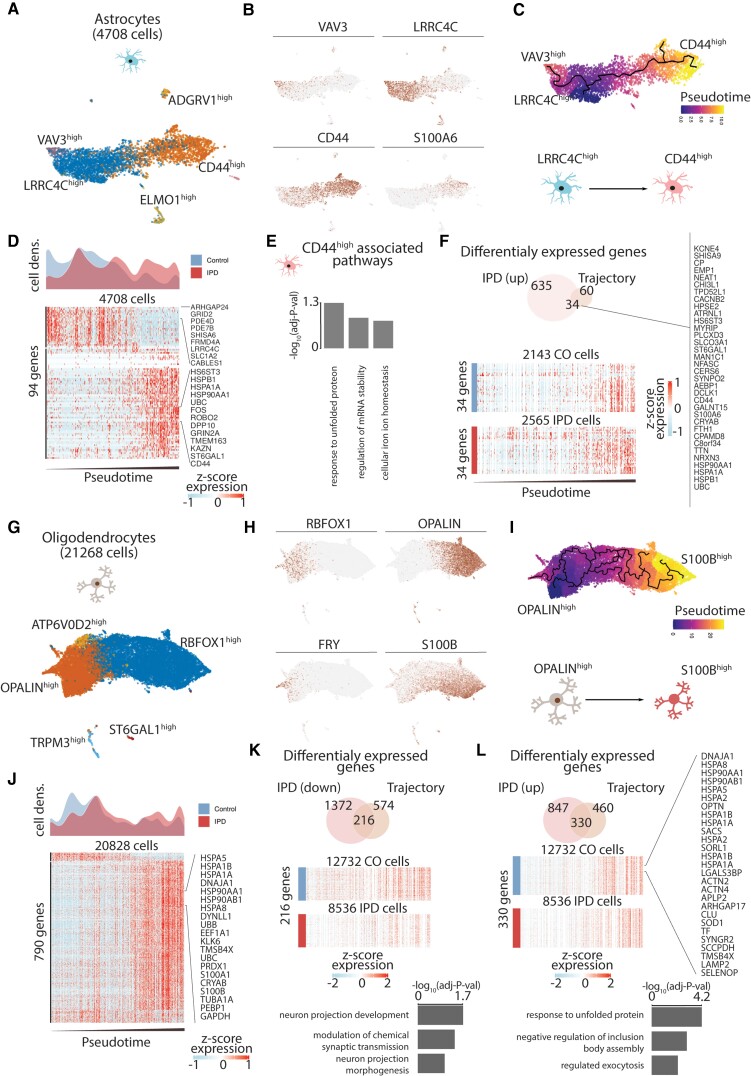
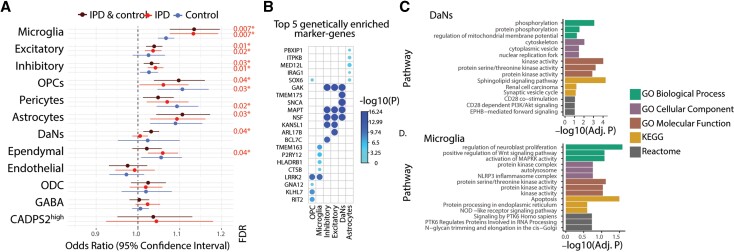
Idiopathic Parkinson's disease is characterized by a progressive loss of dopaminergic neurons, but the exact disease aetiology remains largely unknown. To date, Parkinson's disease research has mainly focused on nigral dopaminergic neurons, although recent studies suggest disease-related changes also in non-neuronal cells and in midbrain regions beyond the substantia nigra. While there is some evidence for glial involvement in Parkinson's disease, the molecular mechanisms remain poorly understood. The aim of this study was to characterize the contribution of all cell types of the midbrain to Parkinson's disease pathology by single-nuclei RNA sequencing and to assess the cell type-specific risk for Parkinson's disease using the latest genome-wide association study. We profiled >41 000 single-nuclei transcriptomes of post-mortem midbrain from six idiopathic Parkinson's disease patients and five age-/sex-matched controls. To validate our findings in a spatial context, we utilized immunolabelling of the same tissues. Moreover, we analysed Parkinson's disease-associated risk enrichment in genes with cell type-specific expression patterns. We discovered a neuronal cell cluster characterized by CADPS2 overexpression and low TH levels, which was exclusively present in idiopathic Parkinson's disease midbrains. Validation analyses in laser-microdissected neurons suggest that this cluster represents dysfunctional dopaminergic neurons. With regard to glial cells, we observed an increase in nigral microglia in Parkinson's disease patients. Moreover, nigral idiopathic Parkinson's disease microglia were more amoeboid, indicating an activated state. We also discovered a reduction in idiopathic Parkinson's disease oligodendrocyte numbers with the remaining cells being characterized by a stress-induced upregulation of S100B. Parkinson's disease risk variants were associated with glia- and neuron-specific gene expression patterns in idiopathic Parkinson's disease cases. Furthermore, astrocytes and microglia presented idiopathic Parkinson's disease-specific cell proliferation and dysregulation of genes related to unfolded protein response and cytokine signalling. While reactive patient astrocytes showed CD44 overexpression, idiopathic Parkinson's disease microglia revealed a pro-inflammatory trajectory characterized by elevated levels of IL1B, GPNMB and HSP90AA1. Taken together, we generated the first single-nuclei RNA sequencing dataset from the idiopathic Parkinson's disease midbrain, which highlights a disease-specific neuronal cell cluster as well as 'pan-glial' activation as a central mechanism in the pathology of the movement disorder. This finding warrants further research into inflammatory signalling and immunomodulatory treatments in Parkinson's disease.

Keywords: Parkinson’s disease; microglia; midbrain substantia nigra; neuroinflammation; single-cell sequencing.


Figures

Figure 1
Figure 1
Cell type composition of human midbrain. (A) The experimental approach to midbrain tissue processing and nuclei extraction. Nuclei suspensions were processed with the 10× Genomics platform and sequenced with an Illumina sequencer. (B) Contribution of nuclei from idiopathic Parkinson’s disease (IPD) patients or controls to each cell type. (C) The number of high-quality nuclei per sample. Overall, the population consists of 19 002 nuclei from idiopathic Parkinson’s disease patients and 22 433 nuclei from controls. (D) UMAP embedding of the 41 435 human midbrain nuclei. Cells are coloured by cell type. (E) Cell type transcriptome similarity and representative marker genes. CADPS2high cells cluster together with the neuronal cells. (F) The number of profiled nuclei per cell type. (G) The proportion of idiopathic Parkinson’s disease and control profiled cells per cell type. (H) CADPS2high cell proportion per sample, (t-test P = 0.02). (I) CADPS2high cells are neurons. They express MAP2, SCN2A, and TIAM1, but have low levels of TH. (J) Digital PCR reveals significantly higher expression of CADPS2 in neuromelanin-positive nigral neurons (n = 150 per person) dissected from idiopathic Parkinson’s disease midbrain sections compared to those isolated from control tissue (t-test P = 0.027).
Figure 2
Figure 2
Idiopathic Parkinson’s disease (IPD) midbrain is characterized by an increase in microglia. Differential cell type composition in idiopathic Parkinson’s disease patients compared to age-matched control subjects. (A) Two-dimensional cell density in the first UMAP embeddings of the human midbrain for idiopathic Parkinson’s disease patients and control subjects independently. (B) Differential 2D cell density in idiopathic Parkinson’s disease midbrain. Idiopathic Parkinson’s disease midbrain has a larger population of microglia and astrocytes than control midbrain tissue. (C) Microglia cell proportion per sample. Idiopathic Parkinson’s disease patients display a higher proportion of microglia cells (t-test P = 0.03). (D) IBA1 immunofluorescence in idiopathic Parkinson’s disease and control ventral midbrain sections. (E) IBA1-positive areas in the entire midbrain and individual regions of 11 individuals. The Parkinson’s disease-associated increase of microglia is the most significant in the SN (t-test P = 0.024). (F) Microglia morphology analysis. (G) An idiopathic Parkinson’s disease-associated reduction of microglia branching indicates less ramified microglia in the SN (t-test P = 2 × 10−16), which implies increased cell reactivity. MB = midbrain; PD = Parkinson’s disease; NR = nucleus ruber; TT = tectum/tegmentum; CC = crus cerebri. IPD: red bar; control: blue bar; scale bar = 50 μm.
Figure 3
Figure 3
Trajectory reconstruction reveals microglia differential activation in idiopathic Parkinson’s disease (IPD). (A) Microglia subpopulations labelled with a representative marker gene. (B) Expression of P2RY12, GPNMB, IL1B and HSP90AA1 along the ∼4000 microglia cells. These genes are characteristic of the major three microglia subpopulations. (C). Trajectory reconstruction and pseudotime representation based on the P2RY1high, GPNMBhigh, and HSP90AA1Bhigh subpopulations. This reveals a two-branches activation trajectory. (D) Differential cell-density distribution along pseudotime for idiopathic Parkinson’s disease and control samples. Also, the expression of 65 genes, whose expression is associated with the microglia activation trajectory. Z-score normalized expression is presented for each gene over ∼4000 microglia cells organized by their pseudotime. (E) Gene ontology (GO) molecular function enrichment of the genes associated with the GPNMB and HSP90AA1 activation trajectories. (F) Twenty-nine idiopathic Parkinson’s disease differentially expressed genes intersect with the differentially expressed genes along the microglia activation trajectory.
Figure 4
Figure 4
Trajectory reconstruction reveals astrocyte differential activation, loss of myelinating oligodendrocytes, and differential activation in idiopathic Parkinson’s disease (IPD). (A) Astroglial subpopulations are named based on characteristic marker genes. (B) VAV3, LRRC4C, CD44, and S100A6 expression across the ∼4700 astrocytes. (C) Inferred cell trajectory and pseudotime for the major astrocyte subpopulations, VAV3high, LRRC4Chigh and CD44high cells. (D) Idiopathic Parkinson’s disease and control differential cell-density distribution over pseudotime and the expression of the 94 genes highly associated with the astrogliosis trajectory in the ∼4700 astrocytes organized by pseudotime. (E) GO molecular function pathway enrichment of the upregulated genes in the CD44high activated branch. (F) The 34 intersected genes between the upregulated genes in idiopathic Parkinson’s disease and across the astrocyte activation trajectory. (G) Oligodendrocyte subpopulations are named based on representative marker genes. (H) Expression of OPALIN, RBFOX1, FRY and S100B in the ∼21 000 oligodendrocytes. (I) Inferred cell trajectory and pseudotime ordering of the major oligodendrocytes subpopulations, OPALINhigh, ATP6V0D2high, and S100Bhigh cells. (J) Idiopathic Parkinson’s disease and control differential cell density over pseudotime. Expression levels of 790 highly variable genes across the oligodendrocyte trajectory. Expression is presented for ∼21 000 oligodendrocytes organized by their pseudotime. (K and L) The intersection of idiopathic Parkinson’s disease differentially expressed and trajectory-associated genes. Also, the GO molecular enrichment of the intersected genes is presented. (K) Two hundred and sixteen idiopathic Parkinson’s disease downregulated genes across the trajectory are associated with pathways important for neuron projection and synaptic transmission. (L) Three hundred and thirty genes are idiopathic Parkinson’s disease upregulated along the oligodendrocyte trajectory. These genes are mainly associated with the unfolded protein response.
Figure 5
Figure 5
Idiopathic Parkinson’s disease (IPD)-associated genetic variants enriched in microglia and neuron-specific genes. (A) Forest plots of the odds ratio (OR) and 95% confidence intervals for the association between the Parkinson’s disease-associated variants and the marker genes of the midbrain cell types from idiopathic Parkinson’s disease patients, control subjects and both conditions. This approach describes the enrichment of Parkinson’s disease risk variants, taken from the latest Parkinson’s disease GWAS, in genes with cell-type-specific patterns in order to identify idiopathic Parkinson’s disease relevant cell types in the midbrain. Only significant association P-values were shown (*P < 0.05). (B) Top five enriched genes in six midbrain cell types. The association of a gene with a cell type is quantified and the most responsible genes for the genetic variant enrichment observed in (A) were shown. The P-values of genes association are colour coded from light to dark blue and the size of circles is inversely proportional to P-values. (C and D) Gene Ontology terms (GO) and molecular pathways (KEGG, Reactome) associated respectively with the DaNs and microglia marker genes responsible for the Parkinson’s disease variant enrichment.

Comment in

References

    1. Grünewald A, Kumar KR, Sue CM. New insights into the complex role of mitochondria in Parkinson’s disease. Prog Neurobiol. 2019;177:73–93. - PubMed
    1. Smolders S, Van Broeckhoven C. Genetic perspective on the synergistic connection between vesicular transport, lysosomal and mitochondrial pathways associated with Parkinson’s disease pathogenesis. Acta Neuropathol Commun. 2020;8:63. - PMC - PubMed
    1. Inamdar NN, Arulmozhi DK, Tandon A, Bodhankar SL. Parkinson’s disease: genetics and beyond. Curr Neuropharmacol. 2007;5:99–113. - PMC - PubMed
    1. Obeso JA, Stamelou M, Goetz CG, et al. . Past, present, and future of Parkinson’s disease: a special essay on the 200th Anniversary of the Shaking Palsy. Mov Disord. 2017;32:1264–1310. - PMC - PubMed
    1. Ouchi Y, Yagi S, Yokokura M, Sakamoto M. Neuroinflammation in the living brain of Parkinson’s disease. Parkinsonism Relat Disord. 2009;15(Suppl 3):S200–S204. - PubMed

Publication types

Substances