

Genomic Signatures of a Major Adaptive Event in the Pathogenic Fungus Melampsora larici-populina
- PMID: 34919678
- PMCID: PMC8755504
- DOI: 10.1093/gbe/evab279
Genomic Signatures of a Major Adaptive Event in the Pathogenic Fungus Melampsora larici-populina
Abstract
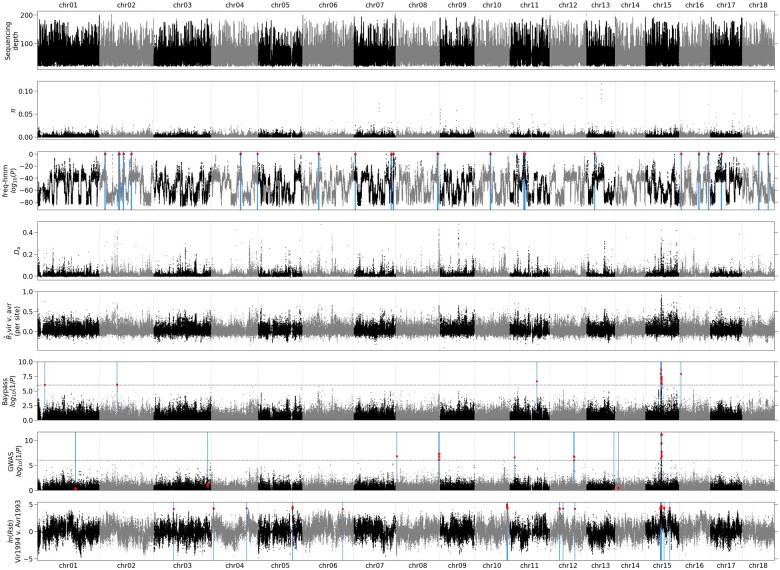
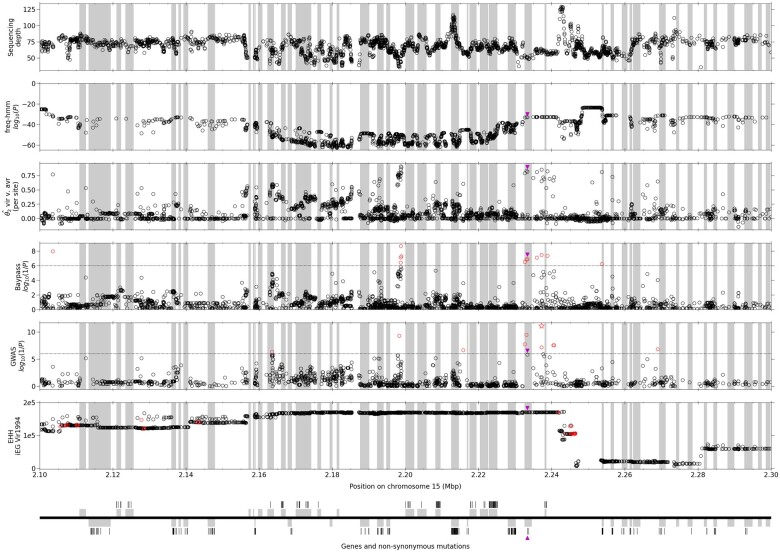
The recent availability of genome-wide sequencing techniques has allowed systematic screening for molecular signatures of adaptation, including in nonmodel organisms. Host-pathogen interactions constitute good models due to the strong selective pressures that they entail. We focused on an adaptive event which affected the poplar rust fungus Melampsora larici-populina when it overcame a resistance gene borne by its host, cultivated poplar. Based on 76 virulent and avirulent isolates framing narrowly the estimated date of the adaptive event, we examined the molecular signatures of selection. Using an array of genome scan methods based on different features of nucleotide diversity, we detected a single locus exhibiting a consistent pattern suggestive of a selective sweep in virulent individuals (excess of differentiation between virulent and avirulent samples, linkage disequilibrium, genotype-phenotype statistical association, and long-range haplotypes). Our study pinpoints a single gene and further a single amino acid replacement which may have allowed the adaptive event. Although our samples are nearly contemporary to the selective sweep, it does not seem to have affected genome diversity further than the immediate vicinity of the causal locus, which can be explained by a soft selective sweep (where selection acts on standing variation) and by the impact of recombination in mitigating the impact of selection. Therefore, it seems that properties of the life cycle of M. larici-populina, which entails both high genetic diversity and outbreeding, has facilitated its adaptation.
Keywords: coevolution; genome scan; genome-wide association studies; plant–pathogen interactions; population genomics.
© The Author(s) 2021. Published by Oxford University Press on behalf of the Society for Molecular Biology and Evolution.
Figures

References
-
- Aguileta G, et al.2010. Finding candidate genes under positive selection in non-model species: examples of genes involved in host specialization in pathogens. Mol Ecol. 19(2):292–306. - PubMed
-
- Armenteros JJA, et al.2019. SignalP 5.0 improves signal peptide predictions using deep neural networks. Nat Biotechnol. 37(4):420–423. - PubMed
-
- Barres B, et al.2008. Genetic structure of the poplar rust fungus Melampsora larici-populina: evidence for isolation by distance in Europe and recent founder effects overseas. Infect Genet Evol. 8(5):577–587. - PubMed
-
- Bendtsen JD, Jensen LJ, Blom N, von Heijne G, Brunak S.. 2004. Feature-based prediction of non-classical and leaderless protein secretion. Protein Eng Des Sel. 17(4):349–356. - PubMed
