. 2022 Jan 11;17(1):110-126.
doi: 10.1016/j.stemcr.2021.11.007. Epub 2021 Dec 16.

APOE2, E3, and E4 differentially modulate cellular homeostasis, cholesterol metabolism, and inflammatory response in isogenic iPSC-derived astrocytes

Affiliations

APOE2, E3, and E4 differentially modulate cellular homeostasis, cholesterol metabolism, and inflammatory response in isogenic iPSC-derived astrocytes

Sherida M de Leeuw et al. Stem Cell Reports. .

Erratum in

Abstract

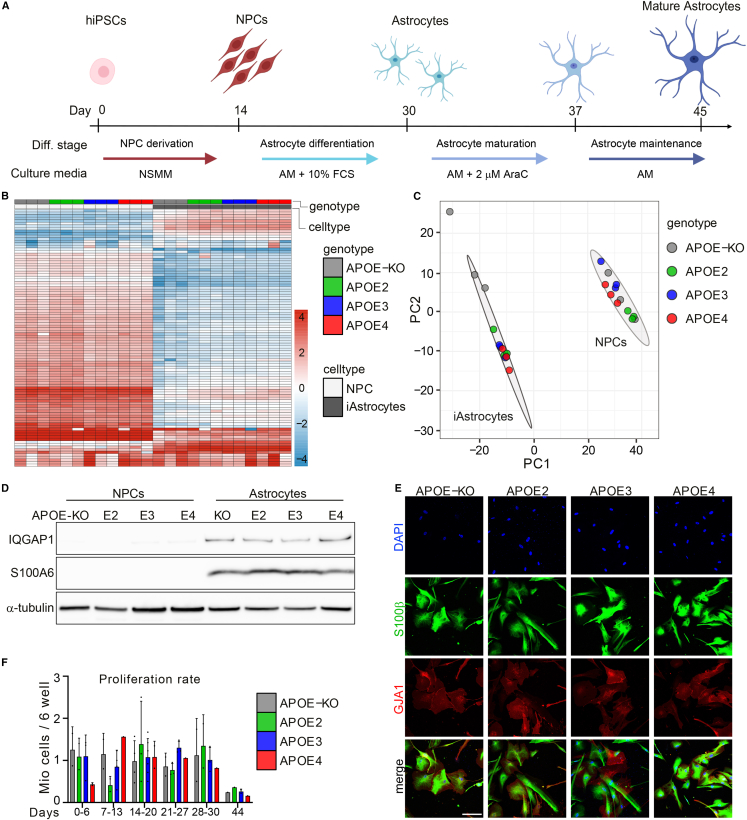
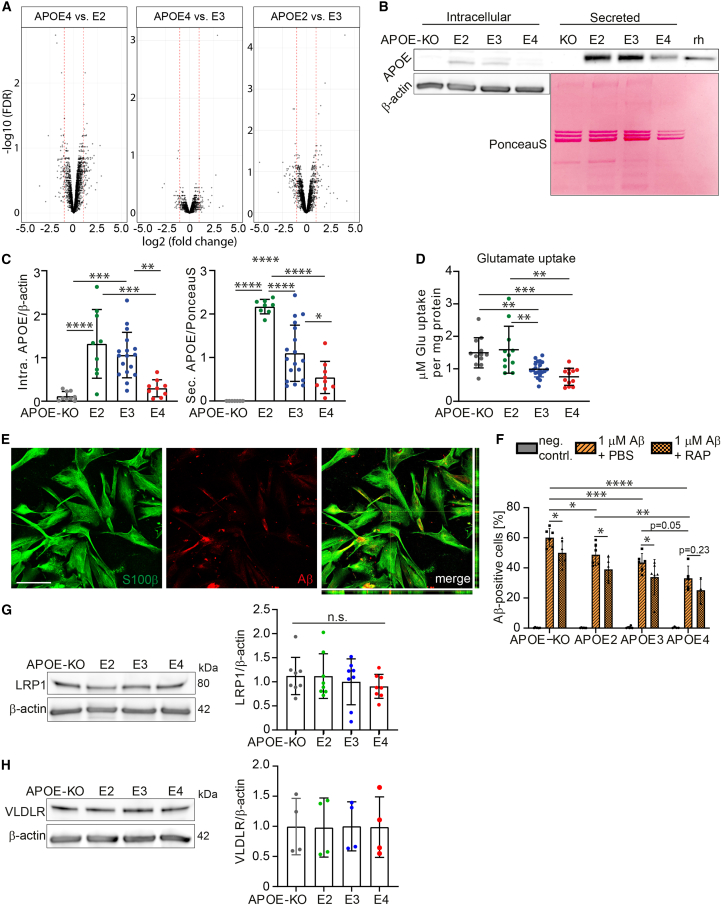
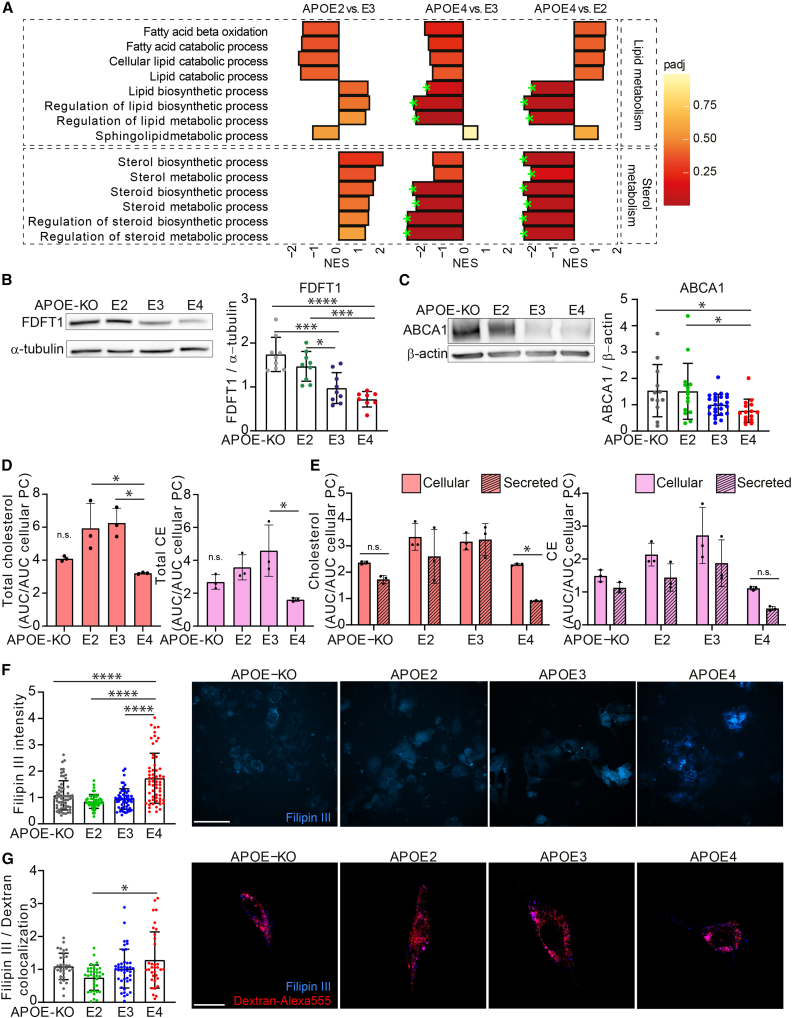
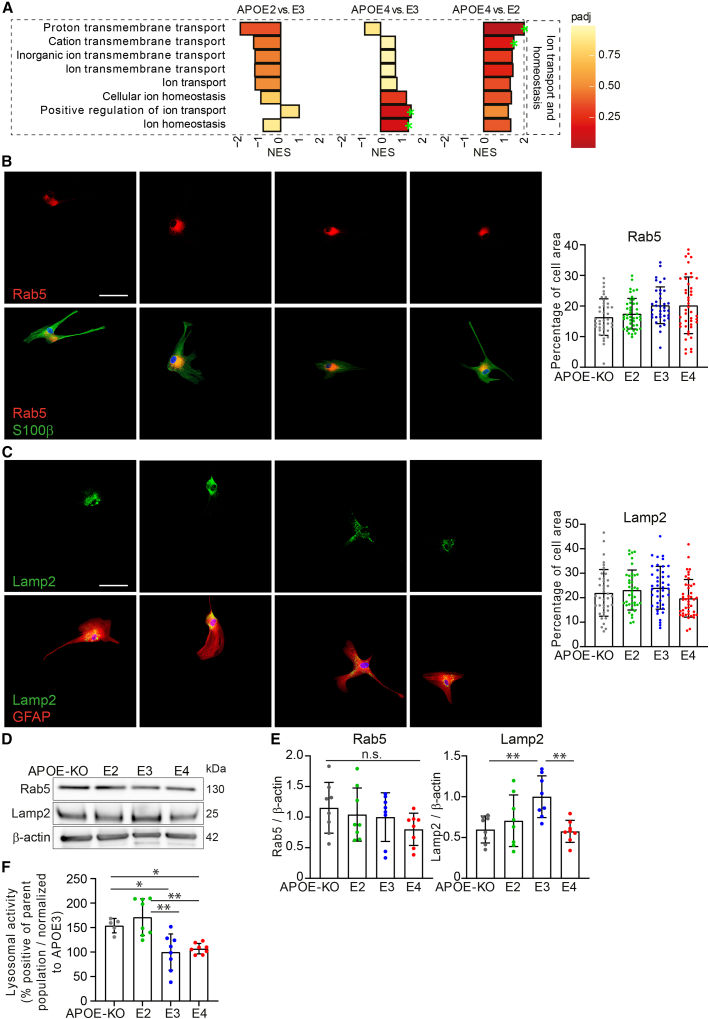
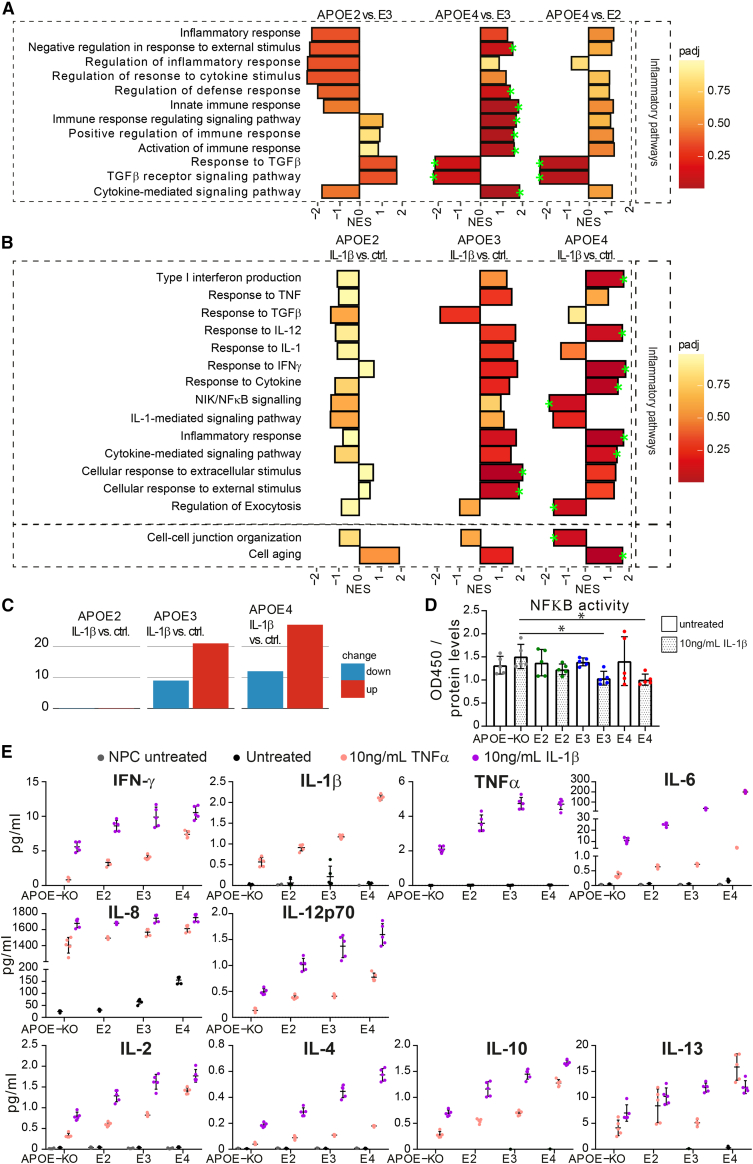
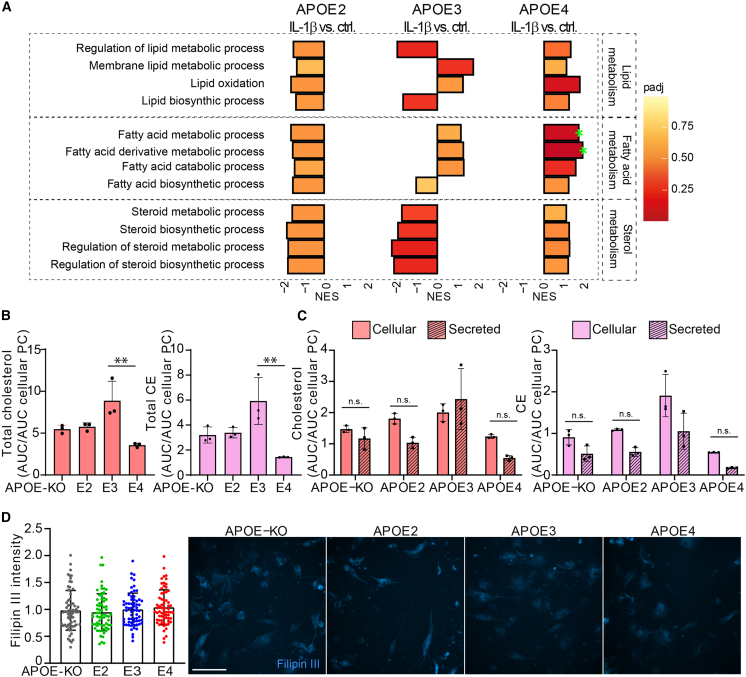
The apolipoprotein E4 (APOE4) variant is the strongest genetic risk factor for Alzheimer disease (AD), while the APOE2 allele is protective. A major question is how different APOE genotypes affect the physiology of astrocytes, the main APOE-producing brain cells. Here, we differentiated human APOE-isogenic induced pluripotent stem cells (iPSCs) (APOE4, E3, E2, and APOE knockout [APOE-KO]) to functional "iAstrocytes". Mass-spectrometry-based proteomic analysis showed genotype-dependent reductions of cholesterol and lipid metabolic and biosynthetic pathways (reduction: APOE4 >E3 >E2). Cholesterol efflux and biosynthesis were reduced in APOE4 iAstrocytes, while subcellular localization of cholesterol in lysosomes was elevated. An increase in immunoregulatory proteomic pathways (APOE4 >E3 >E2) was accompanied by elevated cytokine release in APOE4 cells (APOE4 >E3 >E2 >KO). Activation of iAstrocytes exacerbated proteomic changes and cytokine secretion mostly in APOE4 iAstrocytes, while APOE2 and APOE-KO iAstrocytes were least affected. Taken together, APOE4 iAstrocytes reveal a disease-relevant phenotype, causing dysregulated cholesterol/lipid homeostasis, increased inflammatory signaling, and reduced β-amyloid uptake, while APOE2 iAstrocytes show opposing effects.

Keywords: APOE; Alzheimer disease; Aβ; astrocytes; cholesterol; homeostasis; iPSCs; inflammation; isogenic; lipid metabolism; proteomics.


Figures

Figure 1
Figure 1
APOE-isogenic iPSCs are differentiated to iAstrocytes (A) Schematic representation of the iAstrocyte differentiation protocol. (B) Heatmap of top 100 differentially expressed proteins between NPCs and iAstrocytes selected by fold change. (C) PCA of proteomic data from NPCs and iAstrocytes of all genotypes. Three biological replicates were analyzed. (D) Western blot of astrocyte marker proteins IQGAP1 and S100A6 in APOE-isogenic NPCs and astrocytes. (E) Immunocytochemistry of astrocyte markers S100β and GJA1 in APOE-isogenic iAstrocytes at day 44. Scale bar: 150 μm. (F) Proliferation rate of APOE-isogenic iAstrocytes at different time points in culture. See also Figure S1.
Figure 2
Figure 2
APOE-isogenic iAstrocytes show allele-dependent decline in homeostatic functions (A) Volcano plots of proteomic analysis comparing APOE2 versus APOE3, APOE4 versus APOE3, and APOE4 versus APOE2 iAstrocytes. Log2 of fold change is plotted against −log10 of FDR. Red lines indicate a fold change of 1. (B) Western blot of APOE in lysate (intracellular) and supernatant (secreted) of iAstrocytes. Intracellular APOE was normalized to β-actin, secreted APOE to the PonceauS signal of the respective lane. Recombinant human (rh) APOE served as control. (C) Quantification of APOE western blot bands from lysate (Intra. APOE) and supernatant (Sec. APOE). (D) Glutamate uptake assay showing the amount of glutamate taken up by APOE-isogenic iAstrocytes within 1 h. Data were normalized to total protein content of the respective cell lysate. (E) Representative confocal images of stained iAstrocytes (S100β), treated with 1 μM Aβ42. Scale bar: 150 μm. (F) Flow-cytometry-based Aβ42 uptake assay showing percentage Aβ-positive cells of live cells. Cells were treated with 1 μM pre-aggregated Aβ42-hilyte488 or pre-treated for 24 h with 0.2 μM LRP1 antagonist RAP. (G) Western blot and quantification of LRP1 in lysates from iAstrocytes. (H) Western blot and quantification of VLDLR in lysates from iAstrocytes. Data represent mean ± SD. p < 0.05; ∗∗p < 0.01; ∗∗∗p < 0.001; ∗∗∗∗p < 0.0001, one-way ANOVA with post hoc Tukey's multiple comparisons test (C, D, G, and H), two-way ANOVA with post hoc Holm-Šídák's multiple comparisons test (F). All datapoints (n-numbers) are plotted in each bar graph (three independent experiments).
Figure 3
Figure 3
APOE-isogenic iAstrocytes show allele-dependent regulation of cholesterol and lipid metabolism (A) GSEA normalized enrichment scores (NESs) of protein lists ranked according to the t-statistic obtained for the contrast APOE2 versus APOE3, APOE4 versus APOE3, and APOE4 versus APOE2 iAstrocytes. NES is plotted on the x axis, with color-coded bars for the individual Gene Ontology (GO) terms, according to adjusted p value (padj). We annotated gene sets with padj <0.2 (green stars). (B) Western blot and quantification of FDFT1 in lysates from iAstrocytes, normalized to α-tubulin. (C) Western blot and quantification of ABCA1 in lysates from iAstrocytes, normalized to β-actin. (D) Total cholesterol and CE quantified with HPTLC, normalized to cellular phosphatidylcholine content. (E) Cellular and secreted cholesterol and CE quantified with HPTLC, normalized to cellular phosphatidylcholine content. (F) Bar graphs of Filipin III intensity quantification, normalized to APOE3 intensity, with representative example images. Scale bar: 150 μm. (G) Bar graphs showing quantification of Filipin III and Dextran-Alexa 555 colocalization in iAstrocytes, normalized to APOE3. Representative images of Filipin III (blue) and Alexa 555 (red) overlay are displayed. N = number of images analyzed. For each plot, three experiments were conducted, 7–10 images per line were taken per experiment. Scale bar: 50 μm. Data represent mean ± SD. p < 0.05; ∗∗∗p < 0.001; ∗∗∗∗p < 0.0001, Kruskal-Wallis test (C and G); one-way ANOVA with post hoc Tukey's multiple comparisons test (B, D, F); or two-way ANOVA with post hoc Holm-Šídák's multiple comparisons test (E). All datapoints (n numbers) are plotted in each bar graph (three independent experiments; B, C, F, and G). See also Figure S2.
Figure 4
Figure 4
Subtle changes in lysosomal marker LAMP2 according to APOE genotype (A) GSEA NESs of protein lists ranked according to the t-statistic obtained for the contrast APOE2 versus APOE3, APOE4 versus APOE3, and APOE4 versus APOE2 iAstrocytes. NES is plotted on the x axis, with color-coded bars according to padj. Padj ≤0.2 was considered significant, annotated with green stars. (B) Immunocytochemical stainings of RAB5 (red, upper) and merged with S100β (green, lower). The signal is quantified and calculated as percentage of cell area. (C) Immunocytochemical stainings of LAMP2 (green, upper) and merged with GFAP (red, lower). The signal is quantified and calculated as percentage of cell area. Scale bar: 50 μm. (D) Western blot of LAMP2 and RAB5 from lysate of iAstrocytes. Scale bar: 50 μm. (E) Western blot quantification of RAB5 or LAMP2 normalized to β-actin. (F) Lysosomal activity assay in iAstrocytes, normalized to APOE3. Data represent mean ± SD (p < 0.05; ∗∗p < 0.01, one-way ANOVA with post hoc Tukey's multiple comparisons test). All datapoints (n-numbers) are plotted in each bar graph (three independent experiments).
Figure 5
Figure 5
APOE genotype-dependent effects on inflammatory pathway expression and cytokine release (A) GSEA NESs of protein lists ranked according to the t-statistic obtained for the contrast APOE2 versus APOE4, APOE4 versus APOE3, and APOE4 versus APOE2 iAstrocytes respectively. (B) GSEA of differential protein expression of baseline versus IL-1β treated iAstrocytes (APOE2, E3, and E4 respectively). NES is plotted on the x axis, with color-coded bars according to padj. We annotated gene sets with padj <0.2 (green stars). (C) Number of differentially expressed biological pathways determined by GSEA, with a padj <0.5. (D) NF-κB assay showing NF-κB activity in iAstrocytes at baseline (untreated) and after IL-1β treatment. (E) Levels of inflammatory cytokines secreted by NPCs at baseline (gray), iAstrocytes at baseline (black), 10 ng/mL IL-1β-treated iAstrocytes (coral), and 10 ng/mL TNF-α-treated iAstrocytes (lilac), measured with MSD. Data represent mean ± SD. All datapoints (n-numbers) are plotted in each bar graph. For the MSD graphs, data from five cell culture wells were analyzed in one experiment. The full MSD data are depicted in Table S2.
Figure 6
Figure 6
IL-1β treatment induces lipid, fatty acid, and sterol metabolism in APOE4 iAstrocytes (A) GSEA of differential protein expression at baseline versus IL-1β-treated iAstrocytes (APOE2, E3, and E4 respectively). NES is plotted on the x axis, with color-coded bars according to padj. Padj ≤ 0.2 was considered significant, annotated with green stars. (B) Total cholesterol and CE in IL-1β-treated iAstrocytes determined with HPTLC, normalized to cellular phosphatidylcholine. (C) Cellular and secreted cholesterol and CE in IL-1β-treated iAstrocytes determined with HPTLC, normalized to cellular phosphatidylcholine. (D) Bar graphs of Filipin III intensity quantification, normalized to APOE3 intensity, with representative example images on the right side. Scale bar: 150 μm. Data represent mean ± SD. ∗∗∗∗p < 0.0001, one-way ANOVA with post hoc Tukey's multiple comparisons test (B and D); two-way ANOVA with post hoc Holm-Šídák's multiple comparisons test (C). All datapoints (n-numbers) are plotted in the bar graphs (three independent experiments).

References

    1. Aleshkov S., Abraham C.R., Zannis V.I. Interaction of nascent ApoE2, ApoE3, and ApoE4 isoforms expressed in mammalian cells with amyloid peptide beta (1-40). Relevance to Alzheimer's disease. Biochemistry. 1997;36:10571–10580. doi: 10.1021/bi9626362. - DOI - PubMed
    1. Basak J.M., Verghese P.B., Yoon H., Kim J., Holtzman D.M. Low-density lipoprotein receptor represents an apolipoprotein E-independent pathway of Aβ uptake and degradation by astrocytes. J. Biol. Chem. 2012;287:13959–13971. doi: 10.1074/jbc.M111.288746. - DOI - PMC - PubMed
    1. Bi X., Song J., Gao J., Bi X., Song J., Gao J., Zhao J., Wang M., Scipione C.A., Koschinsky M.L., et al. Activation of liver X receptor attenuates lysophosphatidylcholine-induced IL-8 expression in endothelial cells via the NF-κB pathway and SUMOylation. J Cell Mol Med. 2016;20:2249–2258. doi: 10.1111/jcmm.12903. - DOI - PMC - PubMed
    1. Colacurcio D.J., Pensalfini A., Jiang Y., Nixon R.A. Dysfunction of autophagy and endosomal-lysosomal pathways: Roles in pathogenesis of Down syndrome and Alzheimer’s Disease. Free Radic Biol Med. 2018;114:40–51. doi: 10.1016/j.freeradbiomed.2017.10.001. - DOI - PMC - PubMed
    1. Cui L., Zhao L.P., Ye J.Y., Yang L., Huang Y., Jiang X.P., Zhang Q., Jia J.Z., Zhang D.X., Huang Y. The lysosomal membrane protein Lamp2 alleviates lysosomal cell death by promoting autophagic flux in ischemic cardiomyocytes. Front. Cell Dev. Biol. 2020;8:31. doi: 10.3389/fcell.2020.00031. - DOI - PMC - PubMed

Publication types

MeSH terms