. 2022;13(4):1201-1221.
doi: 10.1016/j.jcmgh.2021.12.007. Epub 2021 Dec 14.

TOB1 Blocks Intestinal Mucosal Inflammation Through Inducing ID2-Mediated Suppression of Th1/Th17 Cell Immune Responses in IBD

Affiliations

TOB1 Blocks Intestinal Mucosal Inflammation Through Inducing ID2-Mediated Suppression of Th1/Th17 Cell Immune Responses in IBD

Ritian Lin et al. Cell Mol Gastroenterol Hepatol. 2022.

Abstract

Background & aims: TOB1 is an anti-proliferative protein of Tob/BTG family and typically involved in the tumorigenesis and T cell activation. Although TOB1 is associated with T helper 17 cell-related autoimmunity, its role in modulating T cell-mediated immune responses in IBD remains poorly understood. Here, we explored its expression and the underlying mechanisms involved in the pathogenesis of inflammatory bowel disease (IBD).

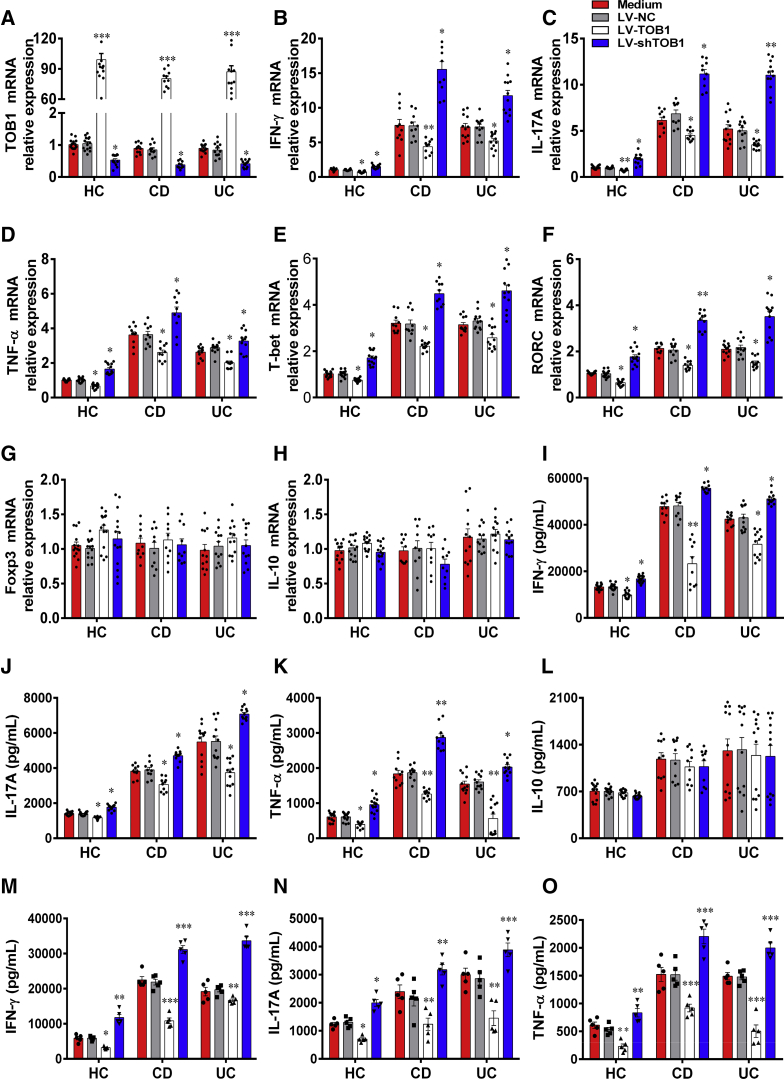
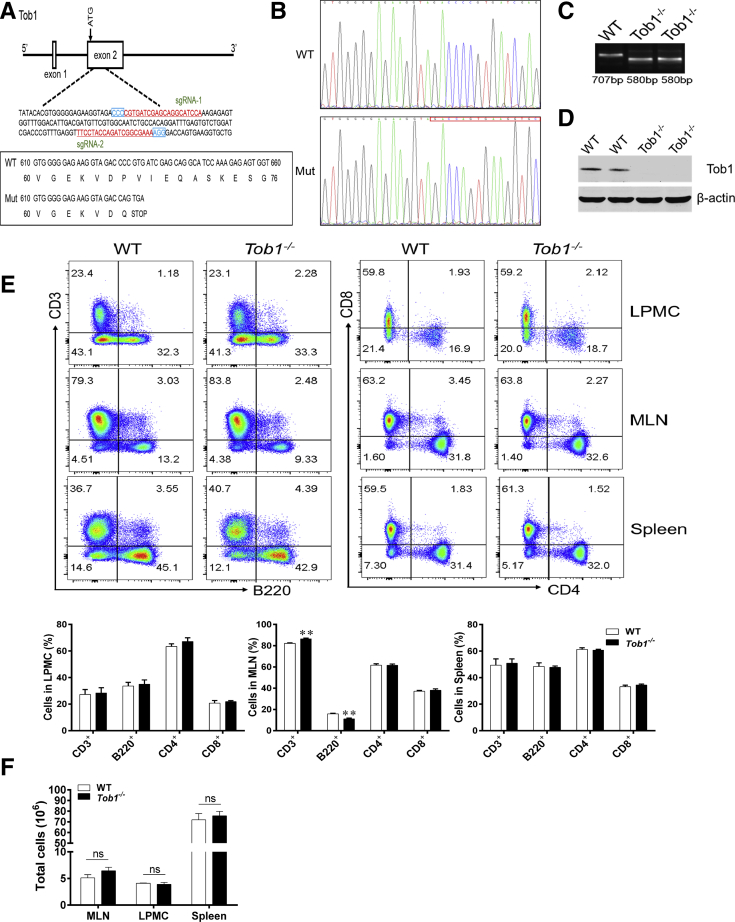
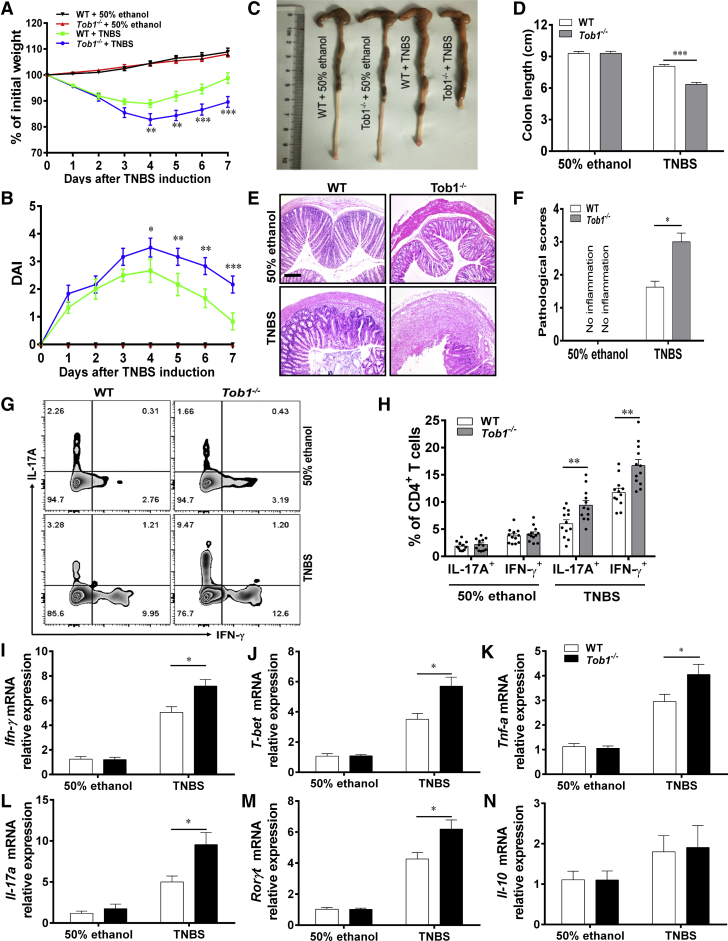
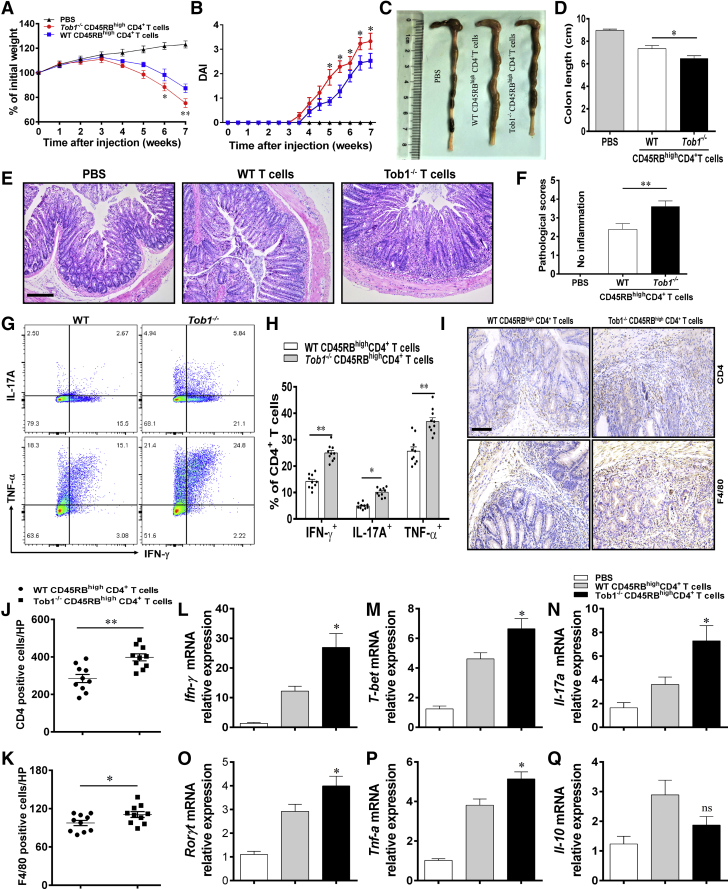
Methods: TOB1 and ID2 expression in IBD patients was examined by quantitative real time polymerase chain reaction and immunohistochemistry. IBD CD4+ T cells were transfected with lentivirus expressing TOB1, ID2, TOB1 short hairpin RNA and ID2 short hairpin RNA, respectively, and Tob1-/-CD4+ T cells were transfected with lentivirus expressing Id2. Experimental colitis was established in Tob1-/- mice by trinitrobenzene sulfonic acid enema and in Rag1-/- mice reconstituted with Tob1-/-CD45RBhighCD4+ T cells to further explore the role of Tob1 in intestinal mucosal inflammation. Splenic CD4+ T cells of Tob1-/- mice were sorted to determine transcriptome differences by RNA sequencing.

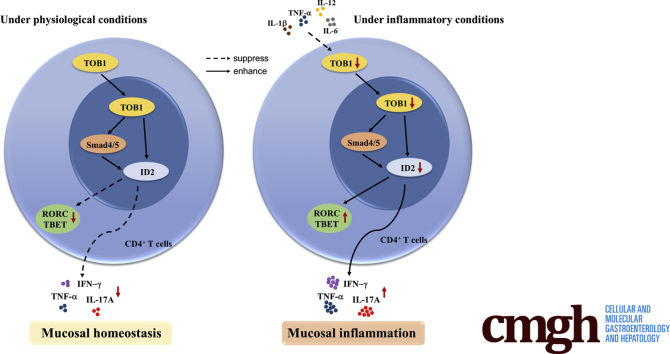
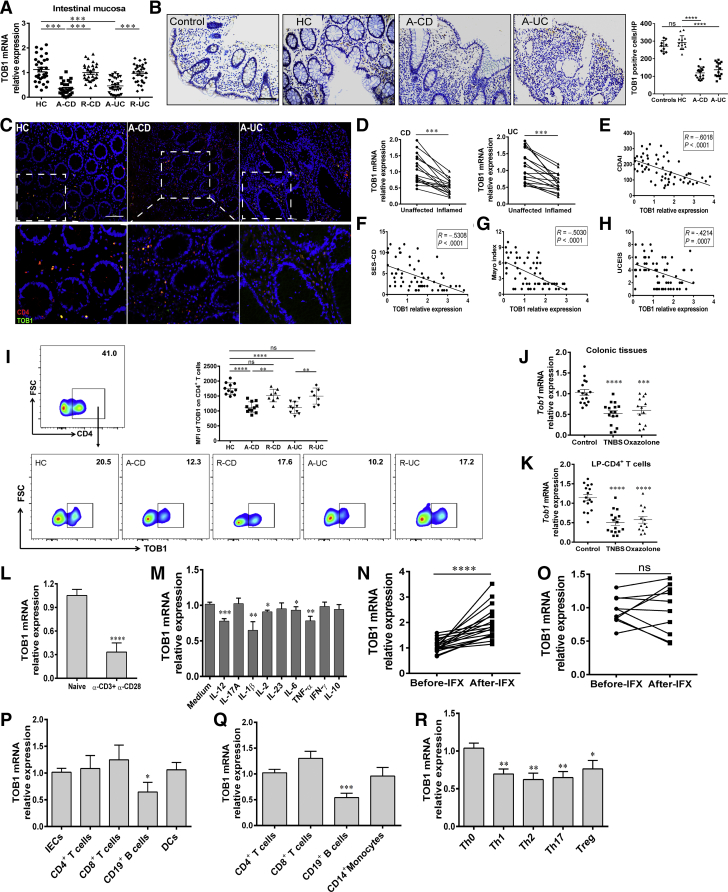
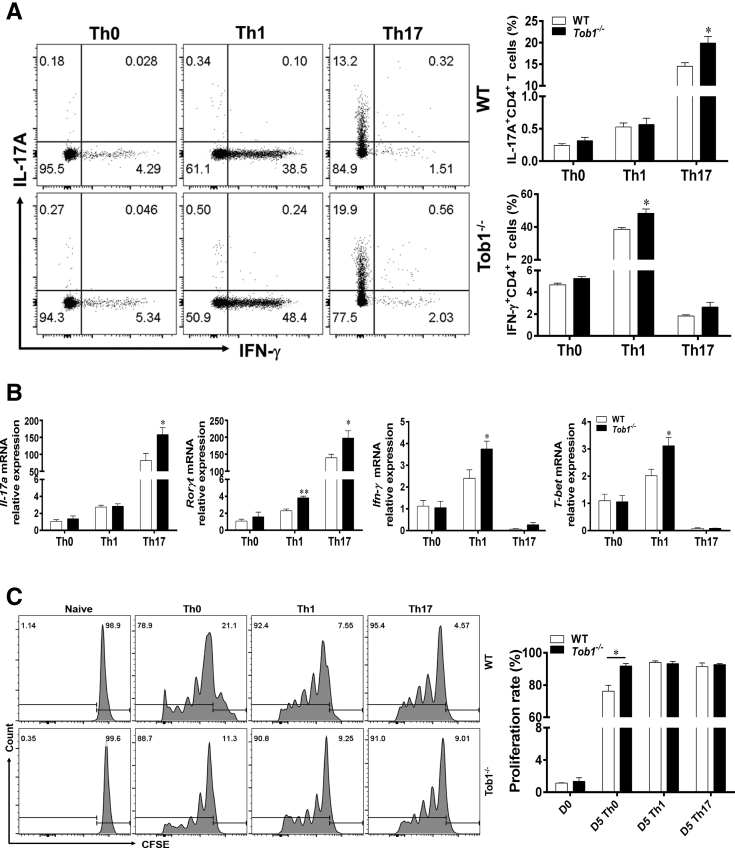
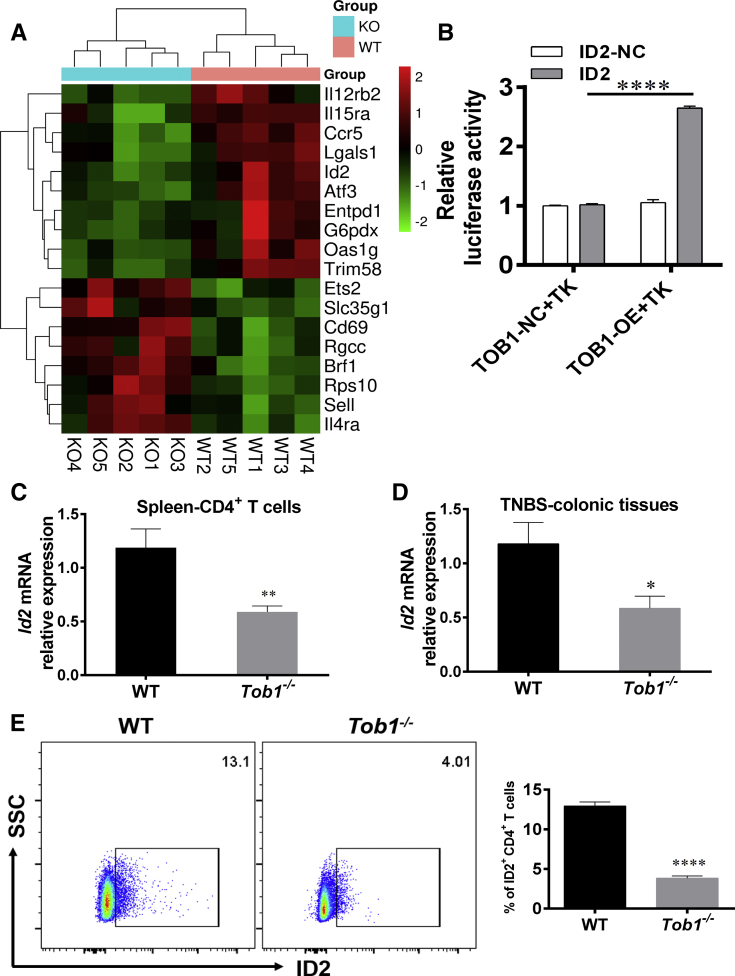
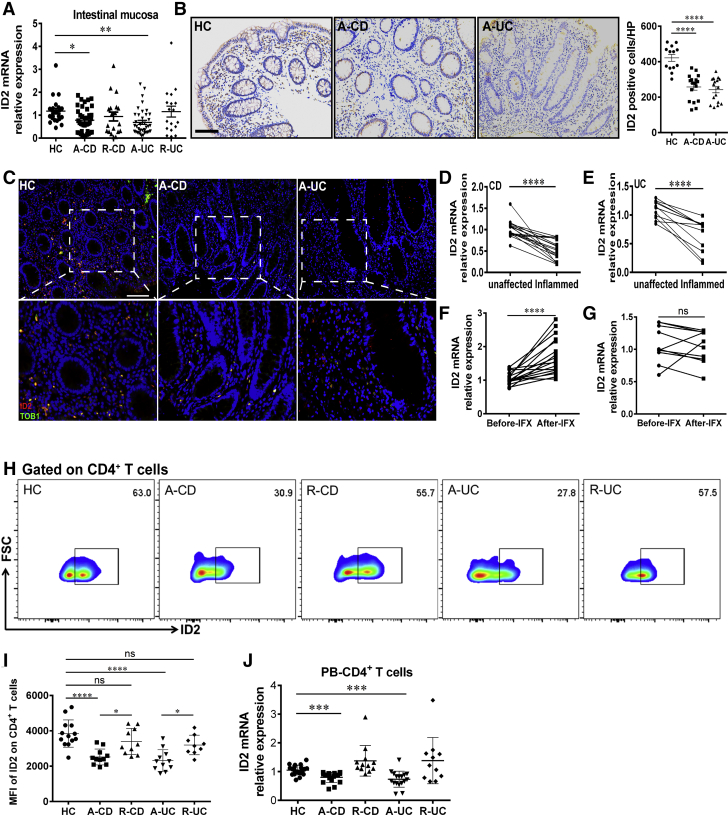
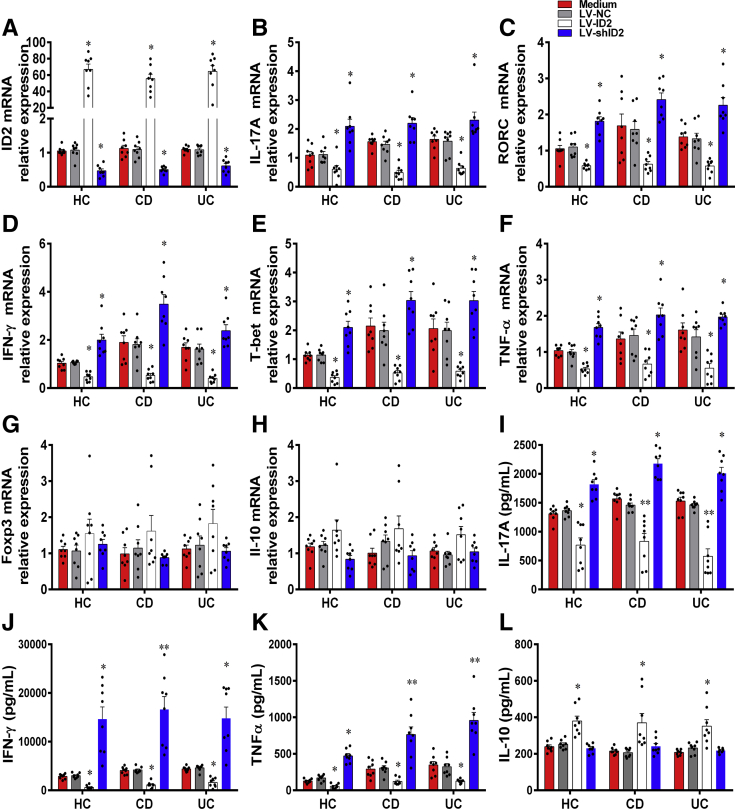
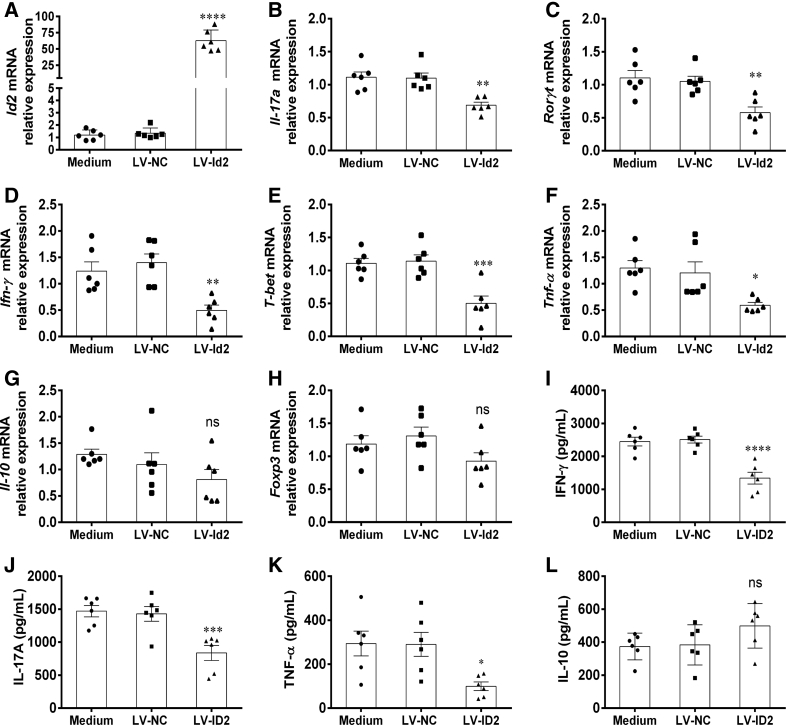
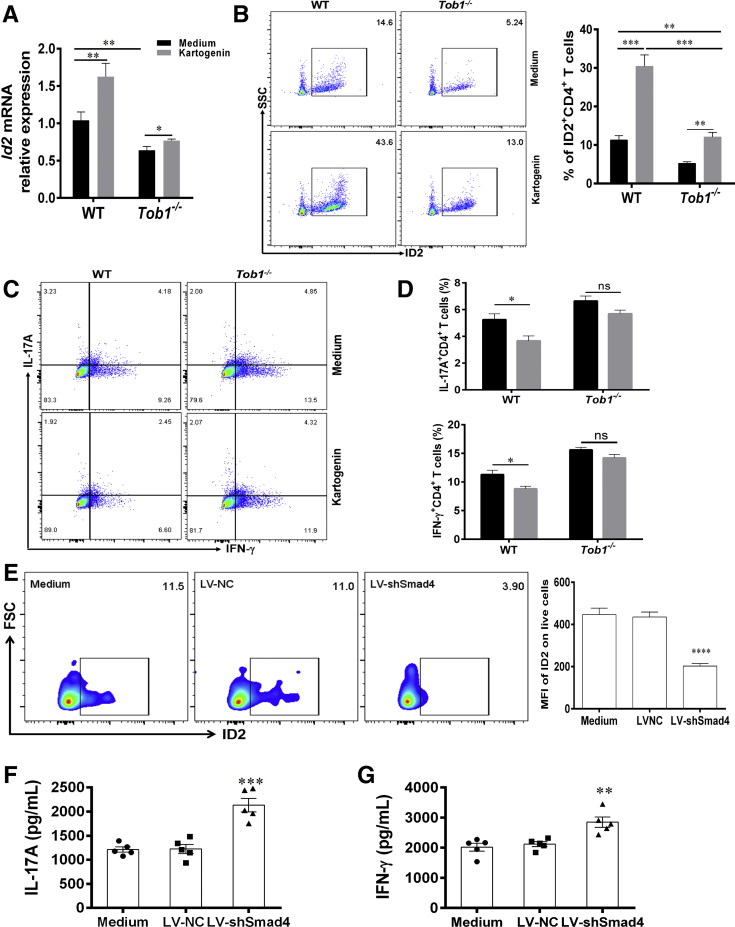
Results: TOB1 expression was decreased in inflamed mucosa and peripheral blood CD4+ T cells of IBD patients compared with healthy subjects. Overexpression of TOB1 downregulated IBD CD4+ T cells to differentiate into Th1/Th17 cells compared with control subjects. Severe colitis was observed in Tob1-/- mice through trinitrobenzene sulfonic acid enema or in Rag1-/- mice reconstituted with Tob1-/-CD45RBhighCD4+ T cells, compared with control animals. RNA sequencing analysis revealed ID2 as functional target of TOB1 to inhibit IBD CD4+ T cell differentiation into Th1/Th17 cells. Mechanistically, TOB1 was associated with Smad4/5 to induce ID2 expression and restrain Th1/Th17 cell differentiation.

Conclusions: TOB1 restrains intestinal mucosal inflammation through suppressing Th1/Th17 cell-mediated immune responses via the Smad4/5-ID2 pathway. It may serve as a novel therapeutic target for treatment of human IBD.

Keywords: CD4(+) T Cells; ID2; Inflammatory Bowel Disease; Mucosal Inflammation; TOB1.


Figures

None
Graphical abstract
Figure 1
Figure 1
TOB1 expression is decreased in active IBD patients. (A) Colon biopsies were collected from 29 patients with A-CD, 29 patients with R-CD, 31 patients with A-UC, 30 patients with R-UC, and 31 HC subjects, respectively, and TOB1 expression was analyzed by qRT-PCR. (B) Immunohistochemistry (IHC) analysis of TOB1 in representative sections from colon mucosa of non-IBD inflammatory control subjects (n = 9, including 3 patients with celiac disease, 3 patients with Clostridium difficile infectious colitis, and 3 patients with ischemic enteritis), HC subjects (n = 13), patients with A-CD (n = 17), and patients with A-UC (n = 16), respectively. Scale bars = 100 μm. (C) Immunofluorescence double staining showed co-localization of TOB1 with CD4+ cells in HC, A-CD, and A-UC samples, respectively. Scale bars = 100 μm. (D) TOB1 expression in inflamed and unaffected colon tissues from the same patients with active CD (n = 16) and active UC (n = 17), respectively, was examined by qRT-PCR. (EH) TOB1 expression in intestinal mucosa of CD patients was observed to be negatively associated with CDAI and Simple Endoscopic Score for Crohn’s Disease (R = –0.6018, P < .0001; and R = –0.5308, P < .0001, respectively) and the correlation analysis between Mayo score, Ulcerative Colitis Endoscopic Index of Severity, and TOB1 expression in intestinal mucosa of UC patients (R = –0.5030, P < .0001; and R = –0.4214, P = .0007, respectively). (I) PB-CD4+ T cells were obtained from HC subjects (n = 11), patients with A-CD (n = 11), patients with R-CD (n = 8), patients with A-UC (n = 10), and patients with R-UC (n = 7), respectively. TOB1 expression was analyzed by flow cytometry, and MFIs (Median Fluorescence Intensity) of TOB1 expression were shown in each group. (J and K) Colon tissues and LP-CD4+ T cells were collected from TNBS- (n = 16), oxazolone-induced (n = 13) colitis mice and WT control animals (n = 16), respectively, and Tob1 expression was examined by qRT-PCR. (L) Naïve PB-CD4+ T cells were sorted from 13 healthy donors and cultured with plate-bound anti-CD3 mAb (5 μg/mL) and soluble anti-CD28 mAb (2 μg/mL) for 24 hours, and qRT-PCR was performed to analyze TOB1 expression. ∗∗P < .01 vs naïve CD4+ T cells. (M) PB-CD4+ T cells (5 × 105/mL) from healthy donors (n = 10) were stimulated with various cytokines (10 ng/mL) for 48 hours, and TOB1 expression was analyzed by qRT-PCR. Gene expression was normalized to GAPDH in each group. (N and O) 29 patients with active CD were receiving anti-TNF mAb (ie, infliximab, IFX) treatment at weeks 0, 2, and 6, and intestinal mucosal biopsies were collected from these patients at week 14 after an induction therapy, (N) 19 patients achieved clinical remission, and (O) 10 patients failed to IFX therapy. (P) Expression of TOB1 mRNA in intestinal mucosal biopsies was analyzed by qRT-PCR. LP-CD4+, CD8+ T, CD19+ B cells, dendritic cells (DCs), and intestinal epithelial cells (IECs) were isolated from normal colon tissues of 6 patients who underwent colectomy for colon cancer, and the mRNA levels of TOB1 were analyzed by qRT-PCR. ∗P < .05 vs IECs. (Q) CD4+, CD8+ T, CD19+ B cells, and CD14+ monocytes were isolated from PB of 8 healthy donors by immunomagnetic positive selection, and TOB1 expression was determined by qRT-PCR. ∗∗∗P < .001 vs CD4+ T cells. (R) PB-CD4+ T cells were isolated from 6 healthy donors and cultured with plate-bound anti-CD3 mAb (5 μg/mL) and soluble anti-CD28 mAb (2 μg/mL) under Th0, Th1, Th2, Th17, and Treg cell–polarizing conditions, respectively, for 5 days, and qRT-PCR was performed to analyze TOB1 expression in these CD4+ T cells. ∗P < .05, and ∗∗P < .01 vs Th0 cells. Spearman rank correlation was used to analyze the correlation between TOB1 expression and disease activities of IBD patients. Statistical analysis was performed with paired 2-sided Student’s t tests or analysis of variance. ∗P < .05, ∗∗P < .01, ∗∗∗P < .001, ∗∗∗∗P < .0001.
Figure 2
Figure 2
Forced expression of TOB1 in IBD CD4+T cells restricts excessive Th1/Th17 cell immune responses. PB-CD4+ T cells from patients with A-CD (n = 10), patients with A-UC (n = 12), and HC subjects (n = 14) were transfected with LV-TOB1, LV-shTOB1, and LV-NC, respectively, and then cultured under stimulation with plate-bound anti-CD3 mAb (5 μg/mL) and soluble anti-CD28 mAb (2 μg/mL) for 5 days. (A) The transfected CD4+ T cells were harvested on day 5, and the transfection efficiencies of LV-TOB1 and LV-shTOB1 were confirmed by qRT-PCR, and (B-H) qRT-PCR was performed to determine the mRNA expression of IFN-γ, IL-17A, TNF-α, T-bet, RORC, Foxp3, and IL-10, respectively, in these CD4+ T cells. (I-L) The culture supernatants of these transfected CD4+ T cells were also collected for detecting the levels of IFN-γ, IL-17A, TNF-α, and IL-10, respectively, using ELISA (M-O). LP-CD4+ T cells isolated from inflamed colon tissues of A-CD patients (n = 5), A-UC patients (n = 5) and normal colon tissues of 5 patients who underwent colectomy for colon cancer, respectively, were transfected with LV-TOB1, LV-shTOB1, and LV-NC, respectively, and then cultured under stimulation with plate-bound anti-CD3 mAb (5 μg/mL) and soluble anti-CD28 mAb (2 μg/mL) for 48 hours. IFN-γ, IL-17A, and TNF-α were detected by ELISA in the culture supernatants of these transfected LP-CD4+ T cells. Statistical analysis was performed with unpaired 2-sided Student’s t tests. ∗P < .05, ∗∗P < .01, and ∗∗∗P < .001 vs LV-NC from the same group.
Figure 3
Figure 3
The generation and genotyping of Tob1–/–mice. (A) Tob1–/– mice were generated using the CRISPR/Cas9 technique. The 2 single guide RNAs targeting the WT and Tob1 sequence are underlined and highlighted in red, and the protospacer adjacent motif sequences are labeled in blue. The reading frames of WT and mutant Tob1 sequence are listed below. The 127-bp deletion in Tob1 sequence results in an early stop codon TGA. (B and C) Target loci of Tob1 were amplified using genomic DNA templates from mouse tails of WT and Tob1–/– mice. PCR products of the targeted fragment were subjected to (B) sequencing and (C) agarose gel electrophoresis, indicating the 127 missing bp in the Tob1–/– mice. (D) Protein levels of Tob1 in the colon tissues of WT littermates and Tob1–/– mice were detected by Western blotting, and β-actin was used as endogenous reference gene. (E) LPMCs and single-cell suspension of MLNs and spleens were obtained from 6- to 8-week-old WT littermates (n = 4) and Tob1–/– mice (n = 4), respectively, and then stained with fluorochrome-conjugated anti-CD3, anti-CD4, anti-CD8, and anti-B220 mAbs, respectively. The frequencies of B220+ B cells, CD3+ T cells (gated on total cells), and CD4+ and CD8+ T cells (gated on CD3+ T cells) in LPMCs, MLNs, and spleens, respectively, were analyzed by flow cytometry. Percentages of these cells in LPMCs, MLNs, and spleens were shown in the bar chart, respectively. (F) The total cells in MLN, LPMC, and spleen were calculated and are presented in the bar chart. Statistical analysis was performed with unpaired 2-sided Student’s t tests. ∗∗P < .01 vs WT control animals from the same group.
Figure 4
Figure 4
Tob1 deficiency exacerbates TNBS-induced colitis in mice. The TNBS-induced colitis model was established in WT littermates (n = 12) and Tob1–/– mice (n = 12). (A) The changes of body weight in WT littermates and Tob1–/– mice were recorded every day over the duration of this experiment. (B) The scores of disease activity index (DAI) were calculated daily after TNBS administration. (C) WT littermates and Tob1–/– mice were sacrificed on day 7 after TNBS induction, and gross morphology of colons is shown. (D) The colon length of WT littermates and Tob1–/– mice is shown in the bar chart. (E) Representative colon sections were stained with hematoxylin and eosin. Scale bars = 200 μm. (F) Pathological scores of the colon tissues were calculated and shown as indicated. (G and H) Intracellular expression of IFN-γ and IL-17A in LP-CD4+ T cells was analyzed by flow cytometry after stimulation with PMA and ionomycin for 5 hours, the percentages of IFN-γ+CD4+ and IL-17A+CD4+ T cells are shown in the bar chart. (IN) Colon tissues were collected from colitic mice and control animals, and the expression of Ifn-γ, T-bet, Tnf-α, Il-17a, Rorγt, and Il-10 mRNA was examined by qRT-PCR. Statistical analysis was performed with unpaired 2-sided Student’s t tests. ∗P < .05, ∗∗P < .01, and ∗∗∗P < .001 vs TNBS-treated WT group. Data are representative of 3 independent experiments.
Figure 5
Figure 5
Tob1 deficiency facilitates Th1 and Th17 cell differentiation in vitro. Naïve CD4+ T cells were isolated from spleens of WT littermates (n = 4) or Tob1–/– mice (n = 4) using anti-mouse CD4 magnetic beads, and cultured with plate-bound anti-CD3 mAb (5 μg/mL) and soluble anti-CD28 mAb (2 μg/mL) under Th0, Th1, and Th17 cell–polarizing conditions, respectively. (A and B) The polarizing CD4+ T cells were harvested on day 5, and intracellular expression of IFN-γ and IL-17A was analyzed by flow cytometry and qRT-PCR after stimulation with PMA and ionomycin. Percentages of IFN-γ+CD4+ and IL-17A+CD4+ T cells are shown in the bar chart. (C) Splenic CD4+ T cells of WT and Tob1–/– mice (n = 4) were labeled with CFSE (2 μM) and stimulated with plate-bound anti-CD3 (5 μg/mL) and soluble anti-CD28 (2 μg/mL) under Th0, Th1, and Th17 cell–polarizing conditions, respectively. The cell proliferation rates were then measured by flow cytometry on day 5. Statistical analysis was performed with unpaired 2-sided Student’s t tests. ∗P < .05 vs WT control animals from the same group. Data are representative of 3 independent experiments.
Figure 6
Figure 6
Tob1–/–CD45RBhighCD4+T cells induce exaggerated intestinal mucosal inflammation in Rag1–/–mice. Naïve CD25CD45RBhighCD4+ T cells were sorted from spleen of WT littermates and Tob1–/– mice (n = 5) and injected intraperitoneally into 8-week-old Rag1–/– mice (5 × 105 cells/mouse and n = 10, respectively). (A) Changes of body weight in Rag1–/– mice reconstituted intraperitoneally with WT and Tob1–/–CD45RBhighCD4+ T cells, respectively, or injected intraperitoneally with phosphate-buffered saline as negative control, were monitored weekly after T cell transfer. (B) The scores of disease activity index (DAI) were calculated daily after T cell adoptive transfer. (C and D) Mice were sacrificed on week 7 after T cell transfer, and gross morphology of colons is shown. (E and F) Pathological scores of the colon tissues were calculated and are shown as indicated, and representative colon sections were stained with hematoxylin and eosin. Scale bars = 100 μm. (G) LPMCs were isolated from the colons of Rag1–/– mice transferred with WT and Tob1–/–CD45RBhighCD4+ T cells, respectively, and intracellular expression of IFN-γ and IL-17A in LP-CD4+ T cells was analyzed by flow cytometry. (H) Percentages of IFN-γ+CD4+ and IL-17A+CD4+ T cells are shown in the bar chart. (IK) Representative images for the detection of CD4+ T cells and F4/80+ macrophages in colon tissues 7 weeks after T cell transfer in Rag1–/– mice by immunohistochemistry. Scale bar = 100 μm. (LQ) Colon tissues were collected from these recipient mice 7 weeks after T cell transfer, and the expression of Ifn-γ, T-bet, Il-17a, Rorγt, Tnf-α, and Il-10 mRNA was examined by qRT-PCR. Statistical analysis was performed with unpaired 2-sided Student’s t tests. ∗P < .05 and ∗∗P < .01 vs Rag1–/– mice transferred with WT CD45RBhighCD4+ T cells.
Figure 7
Figure 7
Id2 is downregulated in splenic CD4+cells of Tob1–/–mice. (A) Compared with WT littermates (n = 5), RNA-seq of splenic Tob1–/–CD4+ T cells showed that the mRNA levels of several anti-inflammatory genes (eg, Il12rb2, Il15ra, Ccr5, Lgals1, Id2, Atf3, Entpd1, G6pdx, Oas1g, and Trim58) were decreased in Tob1–/– mice (n = 5). (B) Luciferase reporter assays using vectors constituted with ID2 promoter or control in the presence of pGMLR-TK and TOB1-overexpressing vector or control. (C and D) Id2 expression was reduced in splenic CD4+ T cells and colon tissues from TNBS-induced colitis of Tob1–/– mice (n = 10) compared with WT littermates (n = 10). (E) Id2 expression was decreased in splenic CD4+ T cells of Tob1–/– mice. Statistical analysis was performed with unpaired 2-sided Student’s t tests. ∗P < .05, ∗∗P < .01, and ∗∗∗∗P < .0001 vs control animals.
Figure 8
Figure 8
Expression of ID2 is decreased in active IBD patients. (A) Colon biopsies were collected from patients with A-CD (n = 39), patients with R-CD (n = 19), patients with A-UC (n = 39), patients with R-UC (n = 18), and HC subjects (n = 23), respectively, and ID2 expression was analyzed by qRT-PCR. (B) Immunohistochemistry (IHC) analysis of ID2 in representative sections from normal colon of HC subjects (n = 13) and inflamed colons of patients with A-CD (n = 17) and patients with A-UC (n = 16), respectively. Scale bars = 100 μm. (C) Immunofluorescence double staining for co-localization of ID2 with TOB1 cells was shown in normal colon of HC and inflamed colon from active CD and UC patients, respectively. Scale bars = 100 μm. (D and E) ID2 expression in inflamed and unaffected colon tissues from the same patients with A-CD (n = 18) and patients with A-UC (n = 14) was examined by qRT-PCR. (F and G) Twenty-nine patients with active CD were receiving IFX treatment at weeks 0, 2, and 6, and intestinal mucosal biopsies were collected from these patients at week 14 after the first infusion. (F) Nineteen patients achieved clinical remission and (G) 10 patients failed to response to IFX therapy before and 14 weeks after the first infusion. Expression of ID2 mRNA in intestinal mucosa of these patients was analyzed by qRT-PCR. (H and I) PB-CD4+ T cells were obtained from HC subjects (n = 13), patients with A-CD (n = 11), patients with R-CD (n = 10), patients with A-UC (n = 11), and patients with R-UC (n = 9), respectively, and ID2 expression was determined by flow cytometry. (J) PB-CD4+ T cells were isolated from patients with A-CD (n = 17), patients with R-CD (n = 12), patients with A-UC (n = 17), and patients with R-UC (n = 11), and HC subjects (n = 20), respectively, and qRT-PCR was performed to determine ID2 expression in PB-CD4+ T cells. Statistical analysis was performed with paired 2-sided Student’s t tests or analysis of variance. ∗P < .05, ∗∗P < .01, ∗∗∗P < .001, ∗∗∗∗P < .0001.
Figure 9
Figure 9
Enhanced expression of ID2 in IBD CD4+T cells confines Th1/Th17 cell immune responses. PB-CD4+ T cells were harvested from patients with A-CD (n = 8), patients with A-UC (n = 8), and HC subjects (n = 8), transfected with LV-ID2, LV-shID2, and LV-NC, respectively, and then cultured under stimulation with plate-bound anti-human CD3 mAb (5 μg/mL) and soluble anti-human CD28 mAb (2 μg/mL) for 5 days. (A) The transfected CD4+ T cells were harvested on day 5, and transfection efficiencies of LV-ID2 and LV-shID2 were confirmed by qRT-PCR. (BH) qRT-PCR was performed to examine the mRNA expression of IFN-γ, IL-17A, TNF-α, T-bet, RORC, Foxp3, and IL-10 in these CD4+ T cells. (IL) The culture supernatants of these transfected CD4+ T cells were also collected for detecting the levels of IFN-γ, IL-17A, TNF-α and IL-10 using ELISA. Statistical analysis was performed with unpaired 2-sided Student’s t tests. ∗P < .05, and ∗∗P < .01 vs LV-NC from the same group.
Figure 10
Figure 10
Enhanced expression of ID2 in Tob1–/–CD4+T cells restrains Th1/Th17 cell immune responses. Splenic CD4+ T cells were harvested from Tob1–/– mice (n = 6), transfected with LV-Id2 and LV-NC, respectively, and then cultured under stimulation with plate-bound anti-CD3 mAb (5 μg/mL) and soluble anti-CD28 mAb (2 μg/mL) for 5 days. (A) The transfection efficiency of LV-Id2 was confirmed by qRT-PCR, and (B–H) the mRNA expression of Il-17a, Rorγt, Ifn-γ, T-bet, Tnf-α, Il-10, and Foxp3 in these CD4+ T cells was detected by qRT-PCR. (IL) The culture supernatants of these transfected CD4+ T cells were also collected for detecting the levels of IFN-γ, IL-17A, TNF-α, and IL-10, respectively, by ELISA. Statistical analysis was performed with unpaired 2-sided Student’s t tests. ∗P < .05, ∗∗P < .01, ∗∗∗P < .001, and ∗∗∗∗P < .0001 vs LV-NC from the same group.
Figure 11
Figure 11
Tob1 is associated with Smad4/5 to induce Id2 expression and restrain Th1/Th17 cell differentiation. (AD) Splenic CD4+ T cells of WT littermates and Tob1–/– mice (n = 6, respectively) stimulated with kartogenin (1 μM, an agonist of Smad4/5) and plate-bound anti-CD3 mAb (5 μg/mL) and soluble anti-CD28 mAb (2 μg/mL) for 5 days. (A, B) Id2 expression was upregulated in splenic CD4+ T cells of WT littermates and Tob1–/– mice. (C and D) Intracellular expression of IFN-γ and IL-17A in these CD4+ T cells was analyzed by flow cytometry. (EG) Splenic CD4+ T cells from WT littermates (n = 5) were transfected with LV-shSmad4 and LV-NC, respectively, and then cultured under stimulation with plate-bound anti-CD3 mAb (5 μg/mL) and soluble anti-CD28 mAb (2 μg/mL) for 5 days. (F and G) The expression of ID2 was detected by flow cytometry (E). The culture supernatants of these transfected CD4+ T cells were collected for detecting the levels of IL-17A and IFN-γ by using ELISA. Statistical analysis was performed with unpaired 2-sided Student’s t tests. ∗P < .05, ∗∗P < .01, and ∗∗∗P < .001.

Similar articles

Cited by

References

    1. Chang J.T. Pathophysiology of inflammatory bowel diseases. N Engl J Med. 2020;383:2652–2664. - PubMed
    1. Graham D.B., Xavier R.J. Pathway paradigms revealed from the genetics of inflammatory bowel disease. Nature. 2020;578:527–539. - PMC - PubMed
    1. Sun M., He C., Cong Y., Liu Z. Regulatory immune cells in regulation of intestinal inflammatory response to microbiota. Mucosal Immunol. 2015;8:969–978. - PMC - PubMed
    1. Maloy K.J., Powrie F. Intestinal homeostasis and its breakdown in inflammatory bowel disease. Nature. 2011;474:298–306. - PubMed
    1. Park J.H., Peyrin-Biroulet L., Eisenhut M., Shin J.I. IBD immunopathogenesis: A comprehensive review of inflammatory molecules. Autoimmun Rev. 2017;16:416–426. - PubMed

Publication types

MeSH terms