Clinical Trial
. 2022 Mar 1;28(5):893-902.
doi: 10.1158/1078-0432.CCR-21-3194.

A Randomized Phase II Study Comparing Nivolumab with Carboplatin-Pemetrexed for EGFR-Mutated NSCLC with Resistance to EGFR Tyrosine Kinase Inhibitors (WJOG8515L)

Affiliations
Clinical Trial

A Randomized Phase II Study Comparing Nivolumab with Carboplatin-Pemetrexed for EGFR-Mutated NSCLC with Resistance to EGFR Tyrosine Kinase Inhibitors (WJOG8515L)

Hidetoshi Hayashi et al. Clin Cancer Res. .

Abstract

Purpose: Although the efficacy of programmed cell death-1 (PD-1) blockade is generally poor for non-small cell lung cancer (NSCLC) with activating mutations of the epidermal growth factor receptor (EGFR) gene, EGFR tyrosine kinase inhibitors (TKIs) may improve the tumor immune microenvironment. We performed a randomized study to assess whether nivolumab improves outcome compared with chemotherapy in such patients previously treated with EGFR-TKIs.

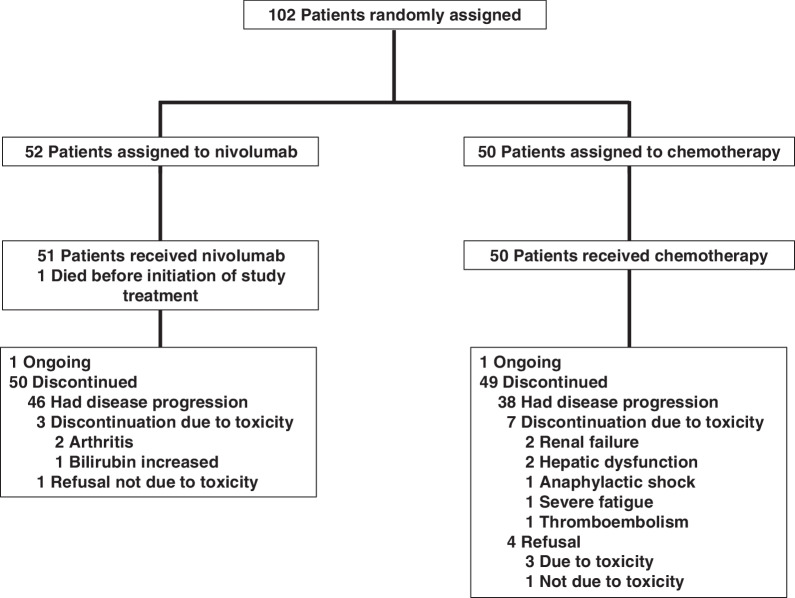
Patients and methods: Patients with EGFR-mutated NSCLC who acquired EGFR-TKI resistance not due to a secondary T790M mutation of EGFR were randomized 1:1 to nivolumab (n = 52) or carboplatin-pemetrexed (n = 50). The primary endpoint was progression-free survival (PFS).

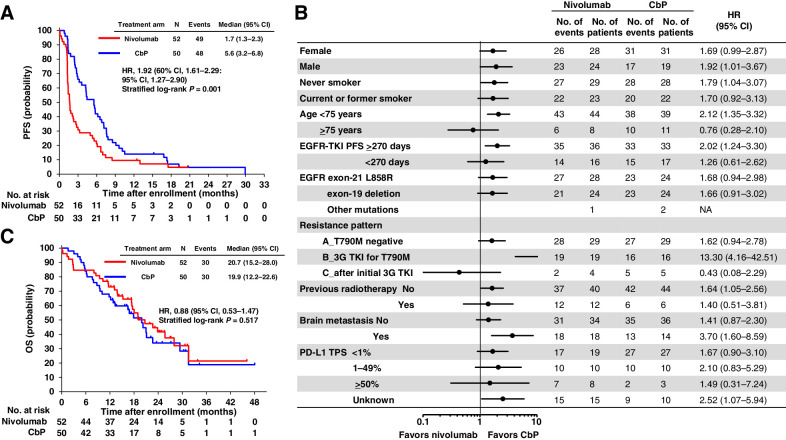
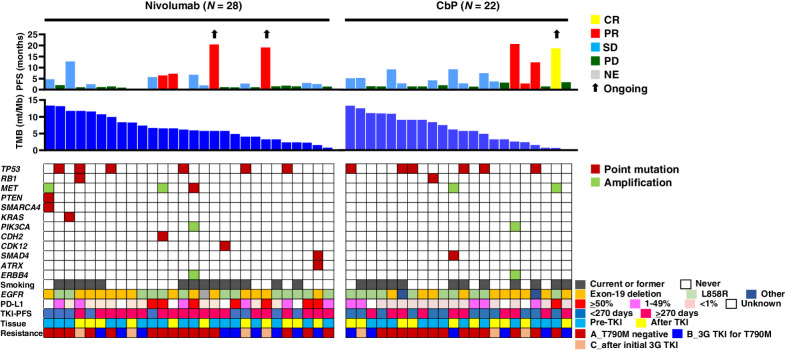
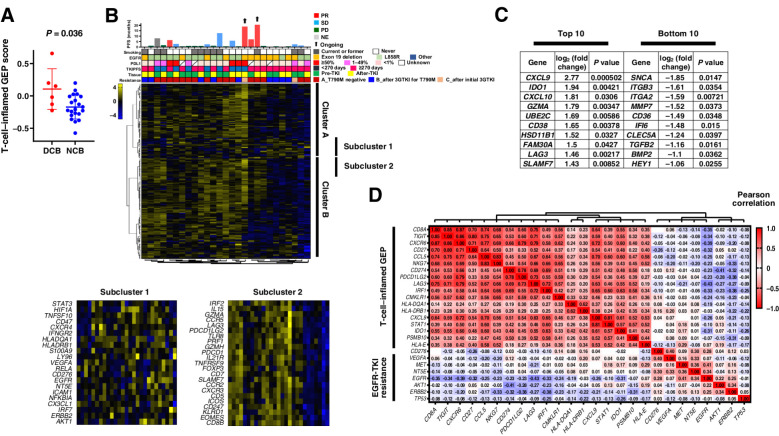
Results: Median PFS and 1-year PFS probability were 1.7 months and 9.6% for nivolumab versus 5.6 months and 14.0% for carboplatin-pemetrexed [log-rank P < 001; hazard ratio (HR) of 1.92, with a 60% confidence interval (CI) of 1.61-2.29]. Overall survival was 20.7 and 19.9 months [HR, 0.88 (95% CI, 0.53-1.47)], and response rate was 9.6% and 36.0% for nivolumab and carboplatin-pemetrexed, respectively. No subgroup including patients with a high tumor mutation burden showed a substantially longer PFS with nivolumab than with carboplatin-pemetrexed. The T-cell-inflamed gene expression profile score (0.11 vs. -0.17, P = 0.036) and expression of genes related to cytotoxic T lymphocytes or their recruitment were higher in tumors that showed a benefit from nivolumab.

Conclusions: Nivolumab did not confer a longer PFS compared with carboplatin-pemetrexed in the study patients. Gene expression profiling identified some cases with a favorable tumor immune microenvironment that was associated with nivolumab efficacy.


Figures

Figure 1. CONSORT diagram.
Figure 1.
CONSORT diagram.
Figure 2. Efficacy of nivolumab relative to that of carboplatin–pemetrexed. A, Kaplan–Meier plots for PFS of patients treated with nivolumab or carboplatin–pemetrexed (CbP). CI, confidence interval; HR, hazard ratio. B, Forest plots of the hazard ratio for nivolumab versus carboplatin-pemetrexed with regard to PFS in patient subsets. Resistance patterns A, B, and C refer to patients who developed resistance to treatment with a first- or second-generation epidermal growth factor receptor–tyrosine kinase inhibitor (EGFR-TKI) but who were negative for T790M, those with T790M-positive tumors after such treatment and who developed resistance after subsequent therapy with a third-generation EGFR-TKI (3G TKI), and those who developed resistance after initial treatment with a third-generation EGFR-TKI, respectively. PD-L1, programmed cell death–ligand 1; TPS, tumor proportion score; NA, not applicable. C, Kaplan–Meier plots for overall survival (OS) of patients treated with nivolumab or carboplatin-pemetrexed.
Figure 2.
Efficacy of nivolumab relative to that of carboplatin–pemetrexed. A, Kaplan–Meier plots for PFS of patients treated with nivolumab or carboplatin–pemetrexed (CbP). CI, confidence interval; HR, hazard ratio. B, Forest plots of the hazard ratio for nivolumab versus carboplatin-pemetrexed with regard to PFS in patient subsets. Resistance patterns A, B, and C refer to patients who developed resistance to treatment with a first- or second-generation epidermal growth factor receptor–tyrosine kinase inhibitor (EGFR-TKI) but who were negative for T790M, those with T790M-positive tumors after such treatment and who developed resistance after subsequent therapy with a third-generation EGFR-TKI (3G TKI), and those who developed resistance after initial treatment with a third-generation EGFR-TKI, respectively. PD-L1, programmed cell death–ligand 1; TPS, tumor proportion score; NA, not applicable. C, Kaplan–Meier plots for overall survival (OS) of patients treated with nivolumab or carboplatin-pemetrexed.
Figure 3. Individual treatment outcome and response for 50 patients with specimens available for analysis of tumor mutation burden (TMB) according to tumor characteristics. Progression-free survival (PFS) and best objective response (CR, complete response; PR, partial response; SD, stable disease; PD, progressive disease; NE, not evaluable) for nivolumab or carboplatin-pemetrexed (CbP) are shown in the top panel. Black arrows indicate ongoing response at data cutoff date. TMB (mutations/Mb) is shown in the middle panel. The distribution of selected gene alterations, smoking status, epidermal growth factor receptor gene (EGFR) mutation type, programmed cell death–ligand 1 (PD-L1) tumor proportion score, PFS for initial EGFR tyrosine kinase inhibitor (TKI) treatment, timing for collection of tumor tissue for analysis (before or after initial EGFR-TKI treatment), and pattern of EGFR-TKI resistance (see legend of Fig. 2 for explanation of A, B, and C) are shown in the bottom panel. 3G, third-generation.
Figure 3.
Individual treatment outcome and response for 50 patients with specimens available for analysis of tumor mutation burden (TMB) according to tumor characteristics. Progression-free survival (PFS) and best objective response (CR, complete response; PR, partial response; SD, stable disease; PD, progressive disease; NE, not evaluable) for nivolumab or carboplatin-pemetrexed (CbP) are shown in the top panel. Black arrows indicate ongoing response at data cutoff date. TMB (mutations/Mb) is shown in the middle panel. The distribution of selected gene alterations, smoking status, epidermal growth factor receptor gene (EGFR) mutation type, programmed cell death–ligand 1 (PD-L1) tumor proportion score, PFS for initial EGFR tyrosine kinase inhibitor (TKI) treatment, timing for collection of tumor tissue for analysis (before or after initial EGFR-TKI treatment), and pattern of EGFR-TKI resistance (see legend of Fig. 2 for explanation of A, B, and C) are shown in the bottom panel. 3G, third-generation.
Figure 4. Immune-related gene expression analysis of tumor specimens. A, Dot plots for the T-cell–inflamed gene expression profile (GEP) score according to nivolumab efficacy for 27 patients. The mean and standard error of the mean values are also shown, and the P value was determined with the Mann-Whitney test. DCB, durable clinical benefit, defined as a partial response or stable disease lasting >6 months; NCB, no clinical benefit. B, Heat map of immune-related gene expression for 27 patients treated with nivolumab (middle panel). Hierarchical clustering of the 27 tumors was performed according to the expression of 183 selected immune-related genes. A dendrogram was generated by clustering, resulting in the identification of several clusters, with two main clusters being designated A and B. The details of two representative subclusters (subclusters 1 and 2) of these two clusters are shown expanded in the bottom panels because of their potential importance for a biological explanation of nivolumab efficacy based on their constituent genes. The color scale represents the Z score for the expression of each individual gene, with the highest expression shown in yellow, medium in black, and lowest in blue. Progression-free survival (PFS) and best objective response for nivolumab as well as other patient characteristics are presented in the top panel as in Fig. 3. C, Lists of the top 10 and bottom 10 genes whose expression was associated with PFS for nivolumab as revealed by comparison of single-gene expression between DCB and NCB groups (Supplementary Fig. S12). D, Correlation between expression of the 18 genes constituting the T-cell–inflamed GEP and that of genes related to epidermal growth factor receptor (EGFR) tyrosine kinase inhibitor (TKI) resistance in 55 patients of the current trial. The color scale indicates Pearson correlation coefficient.
Figure 4.
Immune-related gene expression analysis of tumor specimens. A, Dot plots for the T-cell–inflamed gene expression profile (GEP) score according to nivolumab efficacy for 27 patients. The mean and standard error of the mean values are also shown, and the P value was determined with the Mann-Whitney test. DCB, durable clinical benefit, defined as a partial response or stable disease lasting >6 months; NCB, no clinical benefit. B, Heat map of immune-related gene expression for 27 patients treated with nivolumab (middle panel). Hierarchical clustering of the 27 tumors was performed according to the expression of 183 selected immune-related genes. A dendrogram was generated by clustering, resulting in the identification of several clusters, with two main clusters being designated A and B. The details of two representative subclusters (subclusters 1 and 2) of these two clusters are shown expanded in the bottom panels because of their potential importance for a biological explanation of nivolumab efficacy based on their constituent genes. The color scale represents the Z score for the expression of each individual gene, with the highest expression shown in yellow, medium in black, and lowest in blue. Progression-free survival (PFS) and best objective response for nivolumab as well as other patient characteristics are presented in the top panel as in Fig. 3. C, Lists of the top 10 and bottom 10 genes whose expression was associated with PFS for nivolumab as revealed by comparison of single-gene expression between DCB and NCB groups (Supplementary Fig. S12). D, Correlation between expression of the 18 genes constituting the T-cell–inflamed GEP and that of genes related to epidermal growth factor receptor (EGFR) tyrosine kinase inhibitor (TKI) resistance in 55 patients of the current trial. The color scale indicates Pearson correlation coefficient.

References

    1. World Health Organization. Cancer - Key Facts. Available from: https://www.who.int/news-room/fact-sheets/detail/cancer; 2021.
    1. Mitsudomi T, Yatabe Y. Mutations of the epidermal growth factor receptor gene and related genes as determinants of epidermal growth factor receptor tyrosine kinase inhibitors sensitivity in lung cancer. Cancer Sci 2007;98:1817–24. - PMC - PubMed
    1. Mitsudomi T, Morita S, Yatabe Y, Negoro S, Okamoto I, Tsurutani J, et al. . Gefitinib versus cisplatin plus docetaxel in patients with non-small-cell lung cancer harbouring mutations of the epidermal growth factor receptor (WJTOG3405): an open label, randomised phase 3 trial. Lancet Oncol 2010;11:121–8. - PubMed
    1. Maemondo M, Inoue A, Kobayashi K, Sugawara S, Oizumi S, Isobe H, et al. . Gefitinib or chemotherapy for non-small-cell lung cancer with mutated EGFR. N Engl J Med 2010;362:2380–8. - PubMed
    1. Sequist LV, Waltman BA, Dias-Santagata D, Digumarthy S, Turke AB, Fidias P, et al. . Genotypic and histological evolution of lung cancers acquiring resistance to EGFR inhibitors. Sci Transl Med 2011;3:75ra26. - PMC - PubMed

Publication types

MeSH terms