. 2021 Dec 21;118(51):e2024795118.
doi: 10.1073/pnas.2024795118.

Transcriptional network orchestrating regional patterning of cortical progenitors

Affiliations

Transcriptional network orchestrating regional patterning of cortical progenitors

Athéna R Ypsilanti et al. Proc Natl Acad Sci U S A. .

Abstract

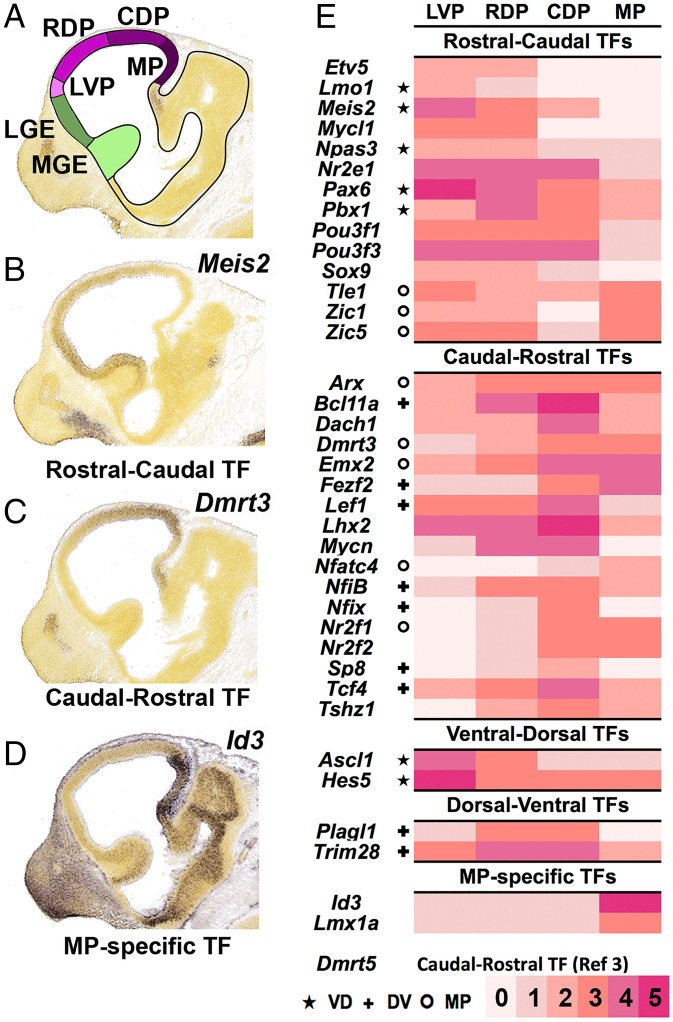
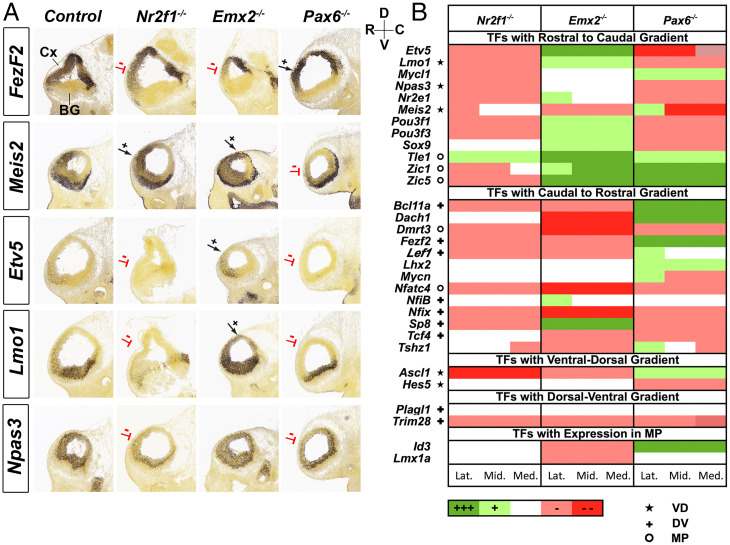
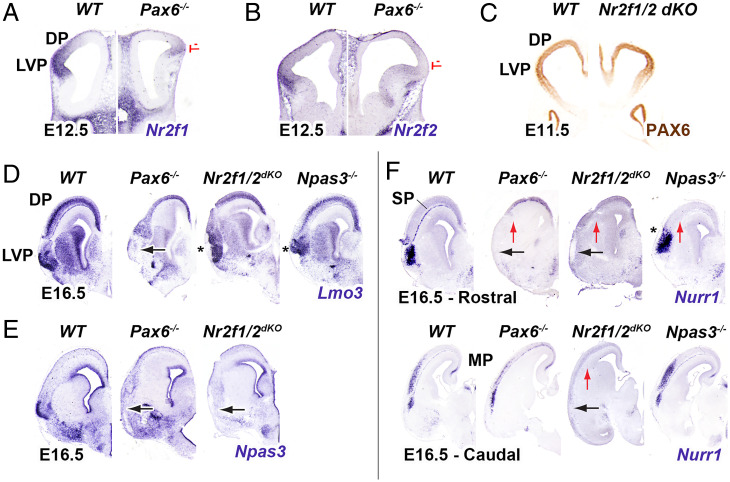
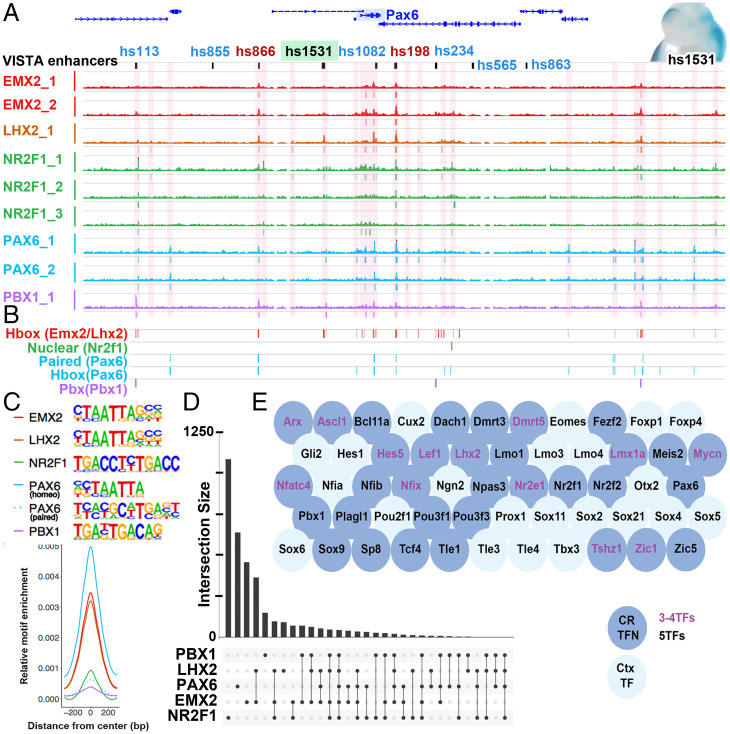
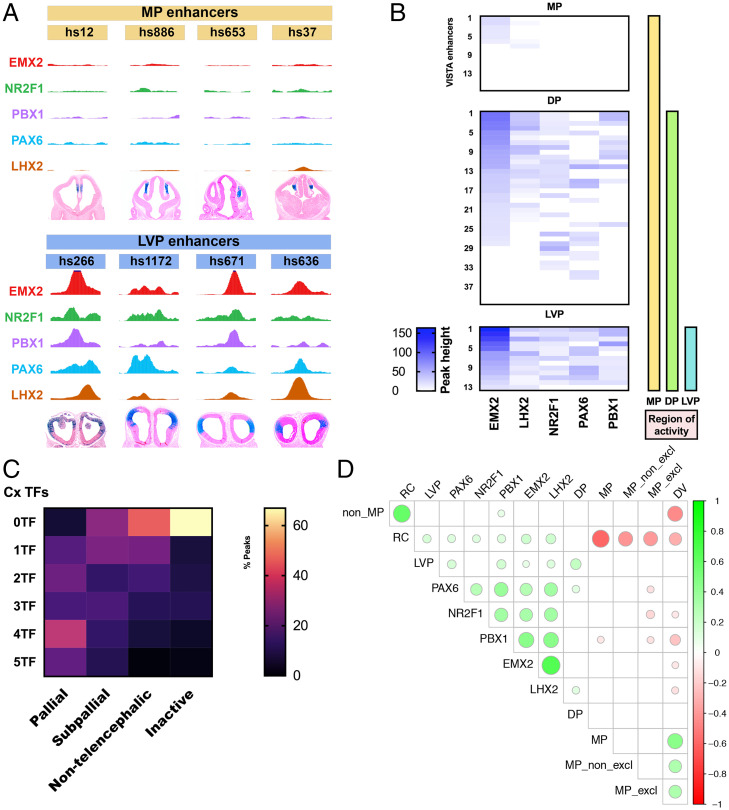
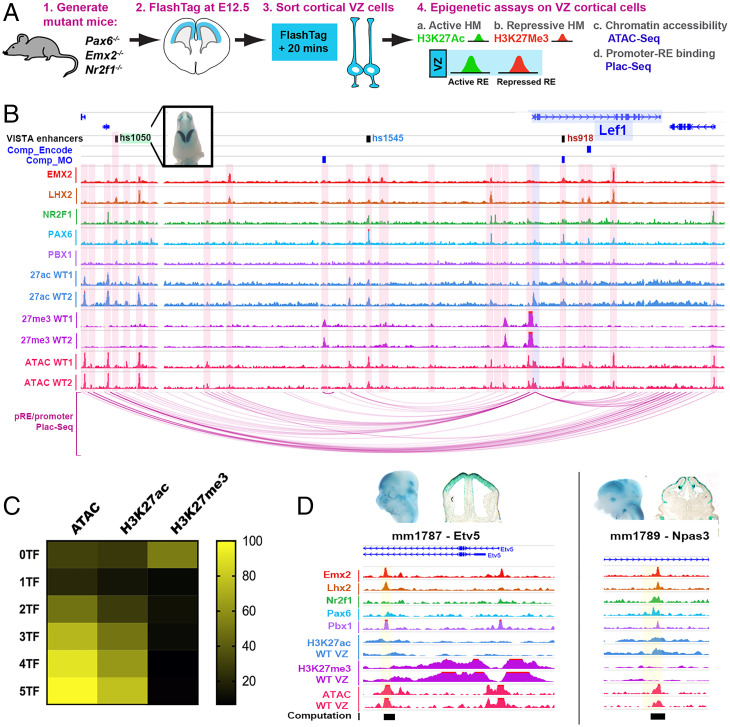
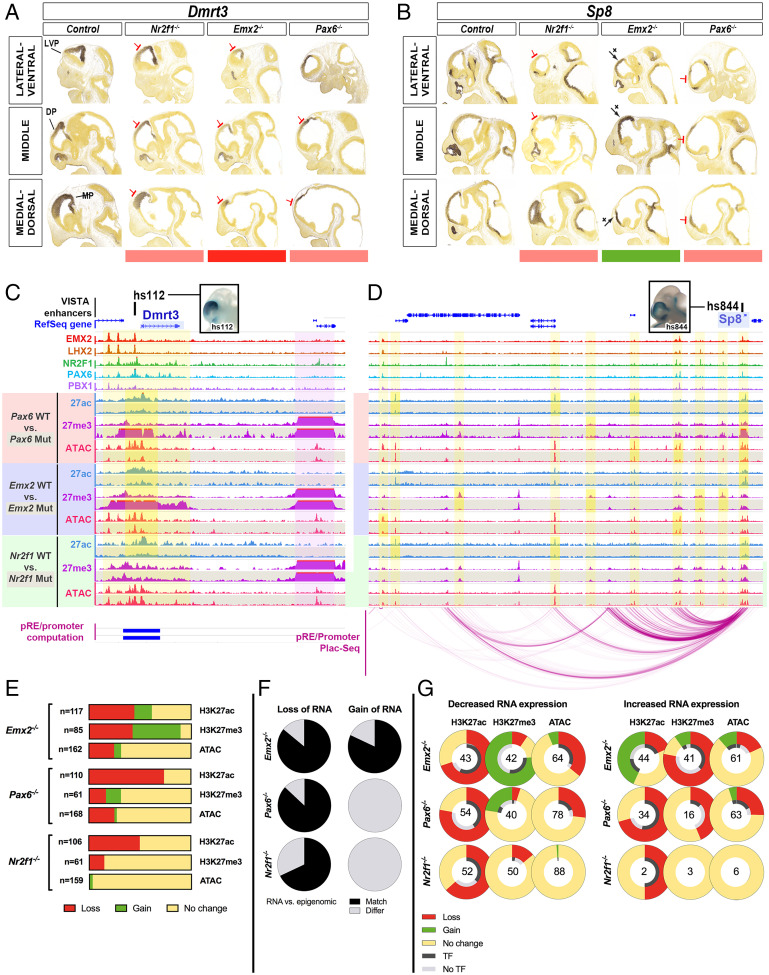
We uncovered a transcription factor (TF) network that regulates cortical regional patterning in radial glial stem cells. Screening the expression of hundreds of TFs in the developing mouse cortex identified 38 TFs that are expressed in gradients in the ventricular zone (VZ). We tested whether their cortical expression was altered in mutant mice with known patterning defects (Emx2, Nr2f1, and Pax6), which enabled us to define a cortical regionalization TF network (CRTFN). To identify genomic programming underlying this network, we performed TF ChIP-seq and chromatin-looping conformation to identify enhancer-gene interactions. To map enhancers involved in regional patterning of cortical progenitors, we performed assays for epigenomic marks and DNA accessibility in VZ cells purified from wild-type and patterning mutant mice. This integrated approach has identified a CRTFN and VZ enhancers involved in cortical regional patterning in the mouse.

Keywords: cortical patterning; epigenetics; progenitor cells; transcription factors.


Conflict of interest statement

Competing interest statement: J.L.R. is a cofounder, stockholder, and currently on the scientific board of Neurona, a company studying the potential therapeutic use of interneuron transplantation.

Figures

Fig. 1.
Fig. 1.
Annotation of TF expression in the CRTFN in the E11.5 cortex. (A) Schema of sagittal view of E11.5 mouse brain. The pallium is in four shades of purple corresponding to regional subdivisions (LVP: laterovental pallium, RVP: rostrovental pallium, CDP: caudodoral pallium, MP: medial pallium). (B–D) ISH analysis of Meis2 (B), Dmrt3 (C), and Id3 (D). (E) Heatmap of cortical expression levels (0 to 5: pink to red scale) of CRTFN TFs in the four pallial subdivisions. ★ indicates that the TF also has VD gradient. ✚ indicates that the TF also has DV gradient. o indicates that the TF also has MP expression.
Fig. 2.
Fig. 2.
Graded expression changes of CRTFN TFs in Nr2f1, Emx2, and Pax6 mutants. (A) ISH shows changes in one CR TF (Fezf2) and four RC TFs (Meis2, Etv5, Lmo1, and Npas3) in E11.5 sagittal sections of Nr2f1, Emx2, and Pax6 mutants (n = 2). Red lines denote reduced expression, whereas black arrows indicate increased expression. The RC and DV axes are depicted on the Top Right of the sections. (B) Heatmap showing changes in expression of 31 TFs in Nr2f1−/−, Emx2−/−, and Pax6−/− using a five-level qualitative scale: increased expression (dark green, +++ or light green, +); no change (white); decreased expression (light red − or dark red − −). TFs are categorized according to their gradient in WT (RC, CR, VD, or DV) or their expression in a restricted region (MP). Changes are annotated in Lateral (Lat.), Middle (Mid.), and Medial (Med.) sagittal sections. ★ indicates that the TF also has VD gradient. ✚ indicates that the TF also has DV gradient. o indicates that the TF also has MP expression.
Fig. 3.
Fig. 3.
Pax6-Nr2f1/2-Npas3 pathway promotes patterning of the rostral latero-ventral pallium and subplate. (A, B) At E12.5, Nr2f1 and Nr2f2 ISH expression is decreased in the LVP and DP of coronal sections in Pax6−/− (red lines, n = 3). (C) At E11.5, PAX6 immunohistochemistry shows no change in the Nr2f1/2 dKO (n = 2). (D–F) E16.5, ISH shows changes of LVP markers (Lmo3, Npas3 and Nurr1) in Pax6−/− (n = 3), Nr2f1/2 dKO (n = 2) and Npas3−/− (n = 3) in rostral sections. Caudal sections are also depicted for Nurr1 ISH. Black arrow: Loss of expression in the R LVP; Star (*): abnormal morphology of the R LVP; Red arrow: loss of the subplate (SP).
Fig. 4.
Fig. 4.
Combinatorial binding of EMX2, LHX2, NR2F1, PAX6, and PBX1 predicts genes in the CRTFN. (A) EMX2, LHX2, NR2F1, PAX6, and PBX1 ChIP-seq coverage at the Pax6 locus at E12.5. pREs are highlighted in pink. VISTA enhancers are also indicated in green (cortical activity [i.e., hs1531, wholemount with positive blue LacZ staining, Top Right]), in blue (noncortical activity [i.e., hs113]), and in red (no activity at E11.5 [i.e., hs198]). (B) Genomic location of the EMX2, LHX2, NR2F1, PAX6, and PBX1 primary binding motifs in the Pax6 locus. (C) Centered distribution of EMX2, LHX2, NR2F1, PAX6, and PBX1 motifs across ChIP-seq peaks. Motifs that were strongly enriched within ChIP peaks were homeobox motifs in EMX2, LHX2, PAX6, and PBX1, the paired motif in PAX6 and the nuclear receptor motif in NR2F1. Primary DNA binding sequences are shown. (D) Number of peaks for each TF alone or in combination. y axis shows number of peaks. x axis indicates single and combinatorial binding at pREs. (E) pREs with combinatorial binding of three or four (Purple letters) or five TFs (Black letters) are enriched around genomic loci for TFs from the CRTFN (blue circles, 30/35 TFs) as well as other TFs important in cortical development (light blue circles).
Fig. 5.
Fig. 5.
Combinatorial binding of EMX2, LHX2, NR2F1, PAX6, and PBX1 predicts gradients of enhancer activity in the pallium. (A) LVP enhancers (hs266, hs1172, hs671, and hs636) are enriched for ChIP-seq peaks but MP enhancers (hs12, hs886, hs653, and hs37) lack peaks. (B) Heatmap showing enrichment (peak height) of EMX2, LHX2, NR2F1, PAX6, and PBX1 binding over VISTA enhancers with MP exclusive activity (n = 16), MP + DP activity (n = 40), and MP + DP + LVP activity (n = 13) symbolized by the yellow, green, and blue vertical bars. Each row represents a distinct VISTA enhancer and the coverage of TF peaks at that locus. (C) Heatmap of combinatorial TF binding (percentage enrichment; 0 to 5 TFs) on VISTA enhancers that have pallial (n = 55), subpallial (n = 56), nontelencephalic (n = 75), and no activity (inactive; n = 121). (D) Correlalogram of computational modeling showing the different combinations of TF binding and their predictions of gradients of activity (P < 0.01). Green circles indicate correlation, and red circles indicate anticorrelation. The size of the circles is associated with the strength of the correlation/anti-correlation. For instance, RC enhancer activity is correlated with PAX6, NR2F1, PBX1, EMX2, and LHX2 TF ChIP-Seq.
Fig. 6.
Fig. 6.
pRE landscape around CRTFN TF genes in cortical progenitors. (A) Method for VZ cell purification for epigenomic experiments (Materials and Methods). (B) Coverage of TF ChIPs, VZ histone marks (active: H3K27ac; repressive: H3K27me3), and VZ ATAC-seq in the Lef1 locus at E12.5. pRE–promoter interactions are derived from PLAC-seq (purple arcs Below) and computationally (blue boxes Above, Comp_Encode and Comp_MO; Dataset S5). VISTA enhancers are also indicated (green = cortical activity, blue = noncortical activity, and red = inactive). (C) Heatmap of percentage enrichment of epigenomic marks over pREs with differential combinatorial TF binding (0 to 5 TFs). (D) Enrichment of TF and epigenomic marks over newly identified cortical enhancers near CRTFN genes: mm1787 (Etv5) and mm1789 (Npas3).
Fig. 7.
Fig. 7.
pREs show epigenetic changes in Emx2−/−, Nr2f1−/−, and Pax6−/− (A and B) ISH for Dmrt3 and Sp8 in WT, Nr2f1−/−, Emx2−/−, and Pax6−/− at E11.5. Red and green bars below indicate decrease and increase in expression. (C and D) TF ChIPs and VZ epigenomic marks (H3K27ac, H3K27me3, ATAC-seq) at Dmrt3 and Sp8 loci at E12.5 in WT, Pax6−/− (red), Emx2−/− (blue), and Nr2f1−/− (green). WT tracks (shaded white) are Above mutant tracks (shaded gray). pRE–promoter interactions are derived from PLAC-seq (purple arcs Below Sp8 locus) and computationally (blue boxes Below Dmrt3 locus). Two cortical VISTA enhancers (hs112 and hs844) are shown Above the genomic loci (black squares); pictures of embryo wholemounts show their cortical activity (blue stain). Yellow vertical bars highlight regions of differential epigenomic marks in mutants, and a purple vertical bar highlights Dmrt2, a region next to Dmrt3 that is unchanged. (E) CRTFN pREs with differential enrichment of epigenomic marks in the Emx2−/−, Pax6−/−, and Nr2f1−/− were recorded. Loss (red), Gain (green), and No change (yellow) were recorded for individual pREs and tabulated across all peaks for individual epigenomic marks. (F) Proportion of loci showing a match (black) or a mismatch (gray) between the RNA ISH analysis and the differential H3K27ac/H3K27me3 ratio in the TF locus, in Emx2−/−, Pax6−/−, and Nr2f1−/−. For Nr2f1−/−, there is not enough information to make comparisons (only one TF that shows a gain in RNA expression; that locus has two pREs). (G) pREs in TFs loci were classified as having either a decrease, an increase, or no change in RNA expression in the Emx2−/−, Pax6−/−, and Nr2f1−/−. We show the changes in epigenomic marks in the TF genes’ interactome according to whether the TF gene showed increased or decreased RNA expression. The percent change compared to WT littermates is plotted in the outer ring (Loss in red; No change in yellow; Gain in green). For pREs that changed, we assessed whether we found a TF peak at that pRE (i.e., in the case of Pax6−/−, we looked for a PAX6 ChIP peak). The proportion of differential pREs with or without the cognate TF binding ChIP-seq reads is presented in the inner ring (black for presence of the TF binding peak; gray for the absence of the TF binding peak). Numbers of differential pREs assessed for each TF gene locus are shown in the center of the rings.

Similar articles

Cited by

References

    1. Ortiz C., et al. , Molecular atlas of the adult mouse brain. Sci. Adv. 6, eabb3446 (2020). - PMC - PubMed
    1. O’Leary D. D. M., Chou S.-J., Sahara S., Area patterning of the mammalian cortex. Neuron 56, 252–269 (2007). - PubMed
    1. Arai Y., Pierani A., Development and evolution of cortical fields. Neurosci. Res. 86, 66–76 (2014). - PubMed
    1. Desmaris E., et al. , DMRT5, DMRT3, and EMX2 cooperatively repress Gsx2 at the pallium-subpallium boundary to maintain cortical identity in dorsal telencephalic progenitors. J. Neurosci. 38, 9105–9121 (2018). - PMC - PubMed
    1. Saulnier A., et al. , The doublesex homolog Dmrt5 is required for the development of the caudomedial cerebral cortex in mammals. Cereb. Cortex 23, 2552–2567 (2013). - PMC - PubMed

Publication types

MeSH terms