. 2021 Dec 21;118(51):e2105170118.
doi: 10.1073/pnas.2105170118.

Microbiome-mediated incapacitation of interferon lambda production in the oral mucosa

Affiliations

Microbiome-mediated incapacitation of interferon lambda production in the oral mucosa

Carlos J Rodriguez-Hernandez et al. Proc Natl Acad Sci U S A. .

Erratum in

Abstract

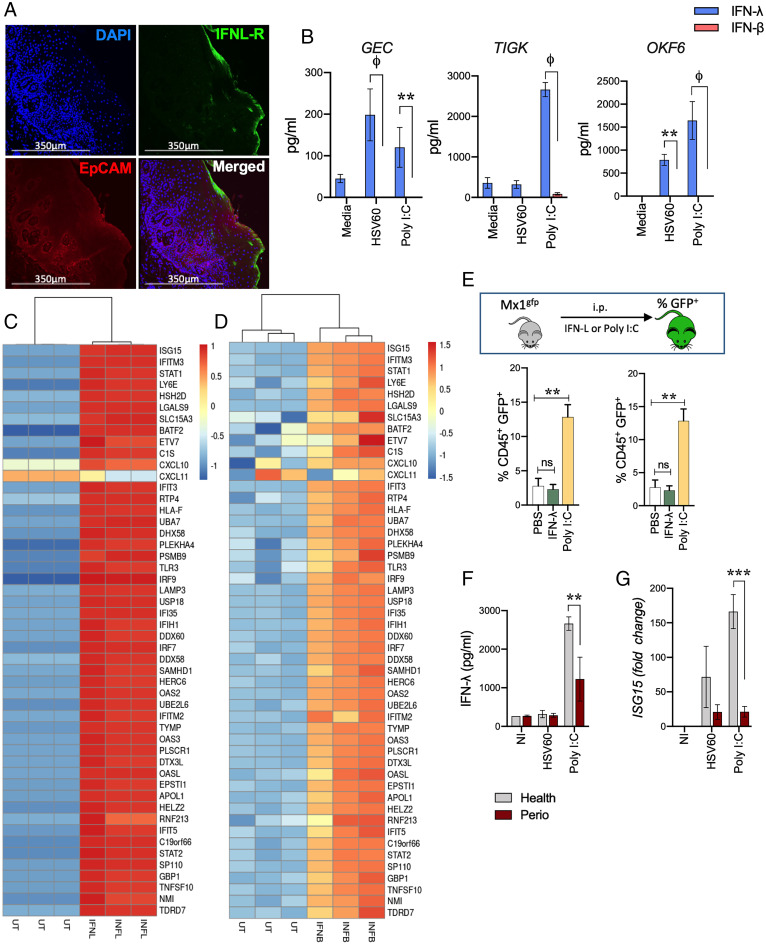
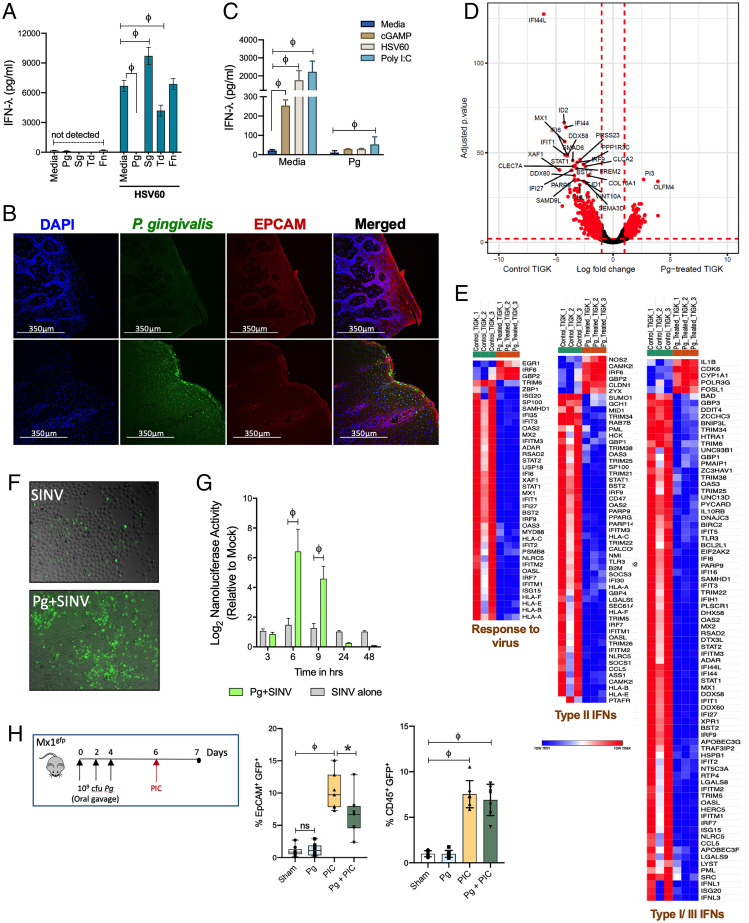
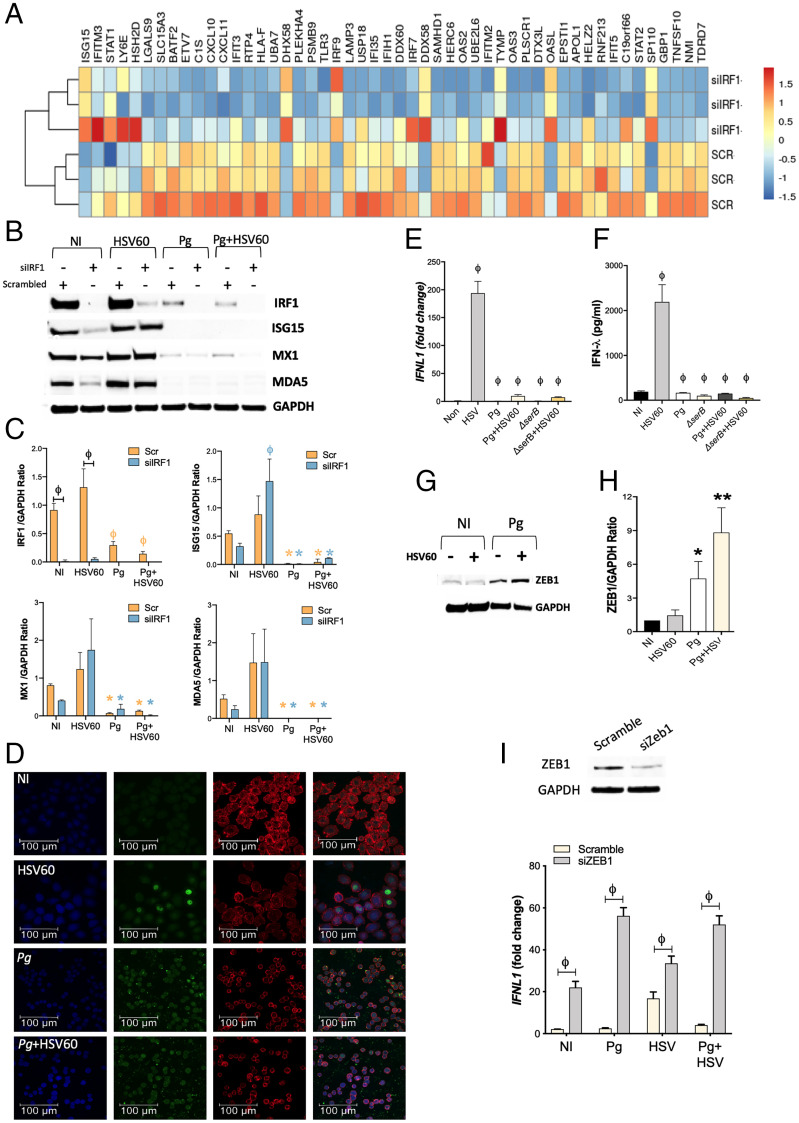
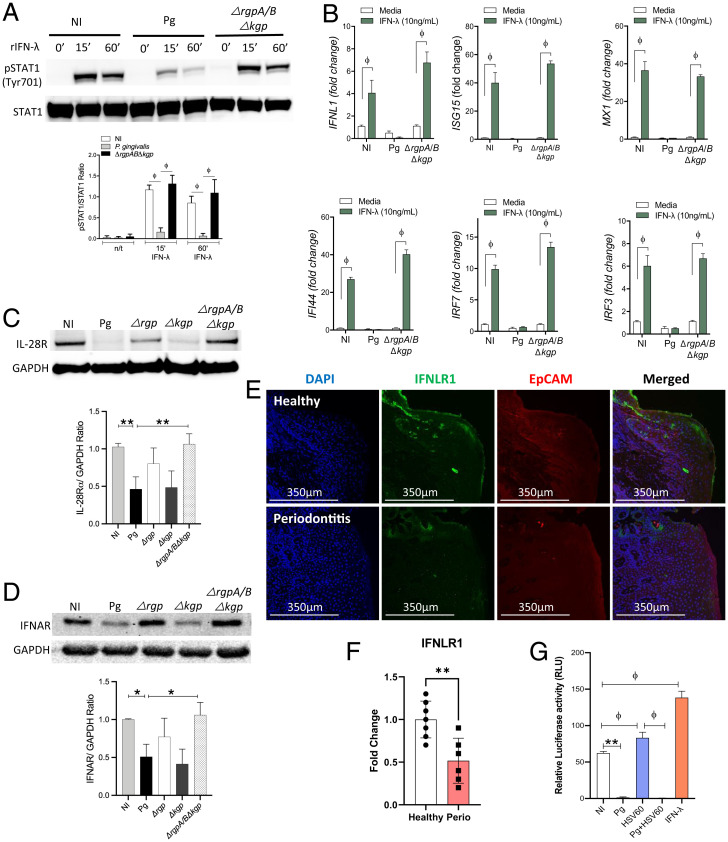
Here, we show that Porphyromonas gingivalis (Pg), an endogenous oral pathogen, dampens all aspects of interferon (IFN) signaling in a manner that is strikingly similar to IFN suppression employed by multiple viral pathogens. Pg suppressed IFN production by down-regulating several IFN regulatory factors (IRFs 1, 3, 7, and 9), proteolytically degrading STAT1 and suppressing the nuclear translocation of the ISGF3 complex, resulting in profound and systemic repression of multiple interferon-stimulated genes. Pg-induced IFN paralysis was not limited to murine models but was also observed in the oral tissues of human periodontal disease patients, where overabundance of Pg correlated with suppressed IFN generation. Mechanistically, multiple virulence factors and secreted proteases produced by Pg transcriptionally suppressed IFN promoters and also cleaved IFN receptors, making cells refractory to exogenous IFN and inducing a state of broad IFN paralysis. Thus, our data show a bacterial pathogen with equivalence to viruses in the down-regulation of host IFN signaling.

Keywords: Interferon lambda; Porphyromonas gingivalis; oral epithelial cells; periodontitis; viral infection.


Conflict of interest statement

The authors declare no competing interest.

Figures

Fig. 1.
Fig. 1.
IFN-λ is strongly expressed in gingival tissues, cell lines, and activates ISG expression in oral tissues. (A) IFNL-R expression was determined in fixed human gingival tissues from healthy donors by immunofluorescent staining. (B) Oral epithelial cells were stimulated with 5 μg/mL HSV60 or 50 μg/mL poly I:C for 24 h and IFN-λ and IFN-β levels measured in cell-free supernatants by ELISA. Data are shown as mean ± SD and statistical differences determined by two-way ANOVA with Holm–Sidak multiple comparison test (**P < 0.01; ϕP < 0.001). (C) TIGKs were treated with 20 ng/mL IFN-λ1 or (D) 0.25 ng/mL IFN-β for 24 h and analyzed by RNA-seq. Hierarchical clustering heatmap (based on log [RPKM] values) of the top 50 ISGs induced by IFN-λ1 or IFN-β compared to untreated cells are shown. Color intensity denotes level of gene expression. (E) Mx1gfp mice were intraperitoneally (i.p.) injected with 50 μg poly I:C or 4 μg IFN-λ and euthanized after 36 h. GECs (EpCAM+, CD45) and leukocytes (EpCAM, CD45+) were analyzed by flow cytometry and % GFP-positive cells (mean ± SD) determined by flow cytometry for each population from three mice per group. Statistical differences determined by one-way ANOVA with Holm–Sidak multiple comparison test (*P < 0.05; **P < 0.01). (F) IFN-λ responses to 5 μg/mL HSV60 or 50 μg/mL poly I:C were measured by ELISA in supernatants of GECs isolated from healthy donors or periodontitis patients. (G) ISG15 expression was determined by qRT-PCR, normalized to GADPH (2-ΔΔCT), and is shown as mean ± SD. Statistical differences were determined by two-way ANOVA with Holm–Sidak multiple comparison test (ϕP < 0.001).
Fig. 2.
Fig. 2.
P. gingivalis infection causes IFN paralysis, characterized by the loss of basal and inducible IFN responses and ISG expression. (A) IFN-λ responses were measured by ELISA in TIGKs challenged either with P. gingivalis (Pg), T. denticola (Td), or F. nucleatum (Fn) at MOI 100 or S. gordonii (Sg) MOI 10 for 5 h, washed once with PBS, and then stimulated with 5 μg/mL HSV60 for additional 18 h. (B) P. gingivalis colonization was determined in gingival tissues by immunofluorescence staining. (C) TIGKs were either left untreated or infected with P. gingivalis (Pg) as described above with subsequent stimulation with 50 μg/mL poly I:C (TLR3 agonist), 5 μg/mL ORN06 (TLR7 agonist), 5 μg/mL HSV60, or 25 μg/mL 2’3′-cGAMP (STING agonist) for 18 h. IFN-λ levels in cell-free supernatants are shown as mean ± SD. Statistical differences were determined by two-way ANOVA (**P < 0.01; ϕP < 0.001). (D) Volcano plot of differentially expressed transcripts between GECs infected with P. gingivalis (MOI 100) and uninfected control cells. X-axis shows log-fold change between the two conditions, with positive values showing up-regulation and negative values showing down-regulated genes. Y-axis denotes P values for corresponding genes. Significantly different genes are shown highlighted in red (P < 0.001 as determined using the DESeq package in R). (E) Gene enrichment analysis of top 300 down-regulated genes was performed as described in Materials and Methods, and hierarchical clustering heatmaps (based on RPKM values) for response to virus pathway, Type II IFNs, and Type I/III IFNs pathways are shown. Color intensity denotes level of gene expression. (F) Viral growth/dissemination was measured in mock and Pg-treated GECs infected with SINV nsP3-GFP strain at an MOI of 10 PFU per cell and cultured under normal conditions for a period of 24 h prior to GFP and brightfield microscopic imaging. Data shown are representative of three independent biological replicates. (G) Viral gene expression was assessed in mock and P. gingivalis–treated GECs infected with SINV nsP3-Nanoluc at an MOI of 10 PFU per cell and cultured in the presence of ammonium chloride to limit infection to the initial single-round entry event. At the indicated time points, the cells were harvested and the level of Nanoluc activity was assayed. Statistical differences were determined by two-way ANOVA (**P < 0.01; ϕP < 0.001). (H) Mx1gfp mice were colonized by P. gingivalis before intraperitoneal (i.p.) challenge with poly I: C. GECs (EpCAM+, CD45) and leukocytes (EpCAM, CD45+) were analyzed by flow cytometry, and %GFP-positive cells (mean ± SD) determined by flow cytometry. Each data point represents one mouse (n = 7 to 5 per group). Statistical differences determined by one-way ANOVA (*P < 0.05; **P < 0.01).
Fig. 3.
Fig. 3.
P. gingivalis incapacitates transcription factors that positively regulate IFN-λ expression, and up-regulates ZEB1, a transcriptional repressor of IFN-λ. (A) TIGKs were transfected with siIRF1 or scrambled control siRNA and differentially expressed transcripts determined by RNA-seq. Hierarchical clustering heat map (based on log RPKM values) of the top 50 ISGs differentially expressed on IRF-1 silencing. Color intensity denotes level of expression. (B) TIGKs were transfected with siIRF1 (si) or scrambled control siRNA (scr) and infected with P. gingivalis (Pg) or stimulated with 5 μg/mL HSV60 and immunoblotted for IRF-1, ISG15, MX1, MDA5, and GAPDH. (C) Band intensities of immunoblots were determined, and ratios of IRF1, ISG15, MX1, and MDA5 normalized to GAPDH from three different blots are shown (mean ± SD). Statistical differences were determined by two-way ANOVA (ϕP < 0.001; *P < 0.05). Orange and blue symbols depict comparisons between NI (not infected) scr control and siIRF1, respectively. (D) TIGKs were infected with P. gingivalis and/or stimulated with 5 μg/mL HSV60, labeled with anti–IRF-1 antibodies (green), and analyzed by confocal microscopy. Actin was labeled with phalloidin (red) and nuclei stained with DAPI (blue). Merged images are shown on the Right. Magnification (63×) of 20 z-stacks of 0.3 μm. TIGKs were infected with P. gingivalis WT (Pg) or SerB-deficient isogenic mutant (ΔserB) for 5 h, followed by 5 μg/mL HSV60 for additional 18 h. (E) Transcript levels of IFNL1 determined by qRT-PCR, normalized to GADPH (2-ΔΔCT) and are shown as mean ± SD; (F) secreted IFN-λ in cell-free supernatants determined by ELISA and shown as mean ± SD. (G) ZEB1 and GAPDH were detected by immunoblotting. (H) Band intensities were determined, and ratios of ZEB1 to GAPDH from three different blots are shown (mean ± SD). (I) GECs were transfected with siZEB1 or scrambled control siRNA. After 48 h, media was replaced, and cells were challenged with P. gingivalis (MOI 100) for 5 h and then stimulated with 5 μg/mL HSV60 for 16 h. Transcript levels of IFNL1 were determined by qRT-PCR normalized to GADPH (2-ΔΔCT) and are shown as mean ± SD. Statistical differences were determined by two-way ANOVA (ϕP < 0.001).
Fig. 4.
Fig. 4.
P. gingivalis infection reduces responsiveness to exogenous IFN-λ. TIGKs were infected with P. gingivalis WT (Pg) or gingipain-null triple mutant (ΔrgpABΔkgp) for 1 h and then stimulated with 20 ng/mL IFN-λ for indicated timepoints. (A) Phospho-STAT1 (pSTAT1) and total STAT1 expression was determined by Western blotting. Band intensities were determined, and ratios of pSTAT1 to total STAT1 from three different blots are shown (mean ± SD). Statistical differences were determined by one-way ANOVA (*P < 0.05; **P < 0.01). (B) Changes in transcript levels (mean ± SD) of ISG15, MX1, IFI44, IRF7, IRF3, and IFNL1 were determined by qRT-PCR and normalized to GAPDH (2-ΔΔCT). Data are shown as mean ± SD, and statistical differences were determined by two-way ANOVA (ϕP < 0.001). TIGKs were infected with P. gingivalis WT (Pg) or gingipain mutant strains Δkgp, ΔrgpA/B, and ΔrgpABΔkgp for 1 h, and (C) IFNL-R (IL-28R), (D) IFNAR, and GAPDH expression was determined in protein lysates by Western blotting. GAPDH was used as a loading control. Densitometry ratios for IL-28R and IFNAR from three different blots are shown as mean ± SD. Statistical differences were determined by one-way ANOVA (*P < 0.05; **P < 0.01). (E) IFNL-R (IL-28R) was detected in human gingival tissues from periodontitis patients and healthy controls. (F) Mean fluorescence intensity for IFNL-R within the EpCAM-positive region was calculated using Imaris software for seven control (healthy) donors and six periodontitis patients (perio). Statistical differences were determined by Student’s t test (**P < 0.01). (G) Dual luciferase reporter analysis of ISRE-Luc activities in GECs under various stimulation conditions. Statistical differences were determined by one-way ANOVA (ϕP < 0.05; **P < 0.01).

Similar articles

Cited by

References

    1. Lamont R. J., Hajishengallis G., Polymicrobial synergy and dysbiosis in inflammatory disease. Trends Mol. Med. 21, 172–183 (2015). - PMC - PubMed
    1. Tonoyan L., Chevalier M., Vincent-Bugnas S., Marsault R., Doglio A., Detection of Epstein-Barr virus in periodontitis: A review of methodological approaches. Microorganisms 9, E72 (2020). - PMC - PubMed
    1. Puletic M., Popovic B., Jankovic S., Brajovic G., Detection rates of periodontal bacteria and herpesviruses in different forms of periodontal disease. Microbiol. Immunol. 64, 815–824 (2020). - PubMed
    1. Christersson L. A., Fransson C. L., Dunford R. G., Zambon J. J., Subgingival distribution of periodontal pathogenic microorganisms in adult periodontitis. J. Periodontol. 63, 418–425 (1992). - PubMed
    1. Imbronito A. V., Okuda O. S., Maria de Freitas N., Moreira Lotufo R. F., Nunes F. D., Detection of herpesviruses and periodontal pathogens in subgingival plaque of patients with chronic periodontitis, generalized aggressive periodontitis, or gingivitis. J. Periodontol. 79, 2313–2321 (2008). - PubMed

Publication types