Randomized Controlled Trial
. 2021 Dec 17;12(1):7334.
doi: 10.1038/s41467-021-27562-4.

EpoR stimulates rapid cycling and larger red cells during mouse and human erythropoiesis

Affiliations
Randomized Controlled Trial

EpoR stimulates rapid cycling and larger red cells during mouse and human erythropoiesis

Daniel Hidalgo et al. Nat Commun. .

Abstract

The erythroid terminal differentiation program couples sequential cell divisions with progressive reductions in cell size. The erythropoietin receptor (EpoR) is essential for erythroblast survival, but its other functions are not well characterized. Here we use Epor-/- mouse erythroblasts endowed with survival signaling to identify novel non-redundant EpoR functions. We find that, paradoxically, EpoR signaling increases red cell size while also increasing the number and speed of erythroblast cell cycles. EpoR-regulation of cell size is independent of established red cell size regulation by iron. High erythropoietin (Epo) increases red cell size in wild-type mice and in human volunteers. The increase in mean corpuscular volume (MCV) outlasts the duration of Epo treatment and is not the result of increased reticulocyte number. Our work shows that EpoR signaling alters the relationship between cycling and cell size. Further, diagnostic interpretations of increased MCV should now include high Epo levels and hypoxic stress.


Conflict of interest statement

The authors declare no competing interests.

Figures
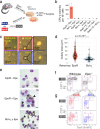
Fig. 1
Fig. 1. Abnormal ETD in the absence of EpoR signaling.
a Experimental design. E12.5 Epor−/− fetal livers were transduced with bicistronic retroviral vectors encoding either Bcl-xL or EpoR, linked by an internal ribosomal entry site (IRES) to human CD4 (hCD4) or GFP reporters. Transduced cells differentiated in vitro into red cells over the ensuing 72 h. b Epor−/− CFU-e colonies, scored 48 h following transduction with either EpoR or Bcl-xL. Epo was added to the medium where indicated. Epor−/− fetal liver cells were also transduced with retroviral vectors encoding the following: ‘empty’ vector (‘V’), constitutively active Stat5 (Stat5 1*6), or doubly transduced with both Bcl-xL and Stat5 1*6. Data pooled from 3 independent experiments. Data are means ± SD. Only CFU-e colonies of a size comparable to those of wild-type colonies were scored. c Representative colonies from an experiment as in (b). d Colony area occupied by each of 75 colonies for each genotype (EpoR-Epor−/− or Bcl-xL-Epor−/−). Data pooled from 3 independent experiments as in (b). Two-sided t test, unequal variance. e Cytospin preparations of transduced Epor−/− fetal liver cells cultured in liquid medium for 36 h, in the presence or absence of Epo as indicated. Cells were stained for hemoglobin with diaminobenzidine (brown stain, arrowheads) and counter-stained with Giemsa. Representative of 4 independent experiments. Double-headed arrows point at enucleated red cells; arrows point at pyrenocytes (extruded nuclei). The micrograph in the bottom panel is representative of cultures both in the presence or absence of Epo. f, g Flow-cytometric CD71/Ter119 profiles of freshly harvested Epor−/− and wild-type littermate fetal livers (f), and of Epor−/− fetal liver cells 18 and 36 h post transduction and culture in Epo-containing medium (g).
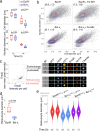
Fig. 2
Fig. 2. EpoR stimulates cell-cycle shortening in early erythroblasts in vitro and in vivo.
a The EpoR is required for CD71 upregulation. Epor−/− fetal livers were transduced with either EpoR or Bcl-xL retroviral vectors carrying the hCD4 reporter (see Supplementary Fig. 2b for experimental design). Transduced cells (hCD4+Lin) were examined for expression of CD71 and Ter119. b Time course of CD71 expression following transduction as in (a). MFI; median fluorescence intensity, relative to t = 0; n = 2 independent experiments. c Growth of Epor−/− fetal liver cells transduced with either Bcl-xL or EpoR. Viable hCD4+Lin cells were counted at the indicated times. Fe-SIH (10 μM) or deoxynucleosides (dN, 0.7 μM) were added to the medium as indicated. ‘Tfrc’ cells were doubly transduced with both Tfrc, and either Epor or Bcl-xL. Data, pooled from n = 4 independent experiments and expressed relative to cell number at t = 0, were fit with exponential curves (R2 values 0.8–0.94, least-squares fit). d Trypan blue negative cells, for the set of experiments in (c). e Cell doubling times ±95% confidence intervals, calculated from the fitting of exponential growth curves to the data in (e). f Cell-cycle shortening in early erythroblasts in vivo. Mice transgenic for the chimeric histone H2B-fluorescence-timer protein (H2B-FT) were injected with either saline or Epo (100 U) at 0 and 24 h. Bone marrow was analyzed at 36 h. H2B-FT fluoresces blue (‘B’) for 1–2 h immediately following synthesis, and matures into a red fluorescent protein (‘R’). The ratio of blue to total fluorescence (B/(B + R)) is a function of cell-cycle length. Shown are histograms of B/(B + R) in EryA erythroblasts (Ter119highCD71highFSChigh). Histogram overlays are for n = 2 mice injected with either saline or Epo. g Relative cell-cycle lengths for the 4 mice analyzed in (f), for each of the indicated erythroblast maturation stages: ProE (Ter119medCD71high), EryA (Ter119highCD71highFSChigh), EryB (Ter119highCD71highFSClow), EryC (Ter119highCD71lowFSClow). p-value is for a two-tailed paired t test, pairing Epo-injected and Saline-injected mice for each erythroblast stage (ProE and EryA/B/C). Late erythroblasts (EryC) may divide, but their cell cycle is no longer sensitive to Epo concentration.
Fig. 3
Fig. 3. EpoR regulates the speed of S phase.
a Cell-cycle analysis of Epor−/− fetal liver cells transduced with either EpoR or Bcl-xL and cultured as in Supplementary Fig. 2b. Cells were pulsed with BrdU for 30 min at t = 9 h and were immediately harvested for analysis. The fraction (%) of erythroblasts (hCD4+Lin) in S phase is indicated, as is S phase speed, measured as the intra-S phase rate of BrdU incorporation (BrdU MFI within the S phase gate). b Summary of cell-cycle status and S phase speed, as measured by intra-S phase BrdU incorporation in EpoR or Bcl-xL-transduced Epor−/− fetal liver cells. Data is pooled from 6 independent experiments similar to (a). In all cases, cells were pulsed with BrdU for 30 min prior to harvesting for analysis. Data are mean ± sem. Intra-S phase BrdU (MFI) is expressed as the ratio to BrdU MFI of Bcl-xL-transduced fetal liver cells at t = 0 in each experiment. Significance p-values are two-tailed paired t test, pairing EpoR and Bcl-xL-transduced cells for each time point across all experiments (upper panel), and for t = 9 and t = 19 h in all experiments (middle and lower panels). c Effect of the cell-permeable iron carrier, Fe-SIH (10 μM) on S phase speed. Experiment and cell-cycle analysis as in (b). Cells were harvested at t = 9 h. d, e Summary of S phase speed (d) and cell-cycle status (e) in EpoR and Bcl-xL-transduced Epor−/− fetal liver cells at t = 9 h, experimental design as in Fig. 2b, and (a) to (c) above. S phase speed is expressed relative to the speed at t = 0 in each experiment. Shown are the effects of adding Fe-SIH or dN to the medium, or of doubly transducing cells with both Bcl-xL and Tfrc. Data are mean ± sem for n = 4 independent experiments each for Fe-SIH and dN, and n = 3 for Tfrc. All experiments also had Epor−/− fetal liver cells transduced with EpoR and with Bcl-xL without additional additives or transductions. P-value is for a two-sided t test, unequal variance.
Fig. 4
Fig. 4. Smaller erythroblasts that differentiate into smaller reticulocytes in the absence of EpoR.
a Cell and nuclear diameter of hCD4+Lin erythroblasts, measured by imaging flow cytometry. Experiment as in Fig. 2b. Polystyrene beads of known diameters were used for calibration (see “Methods”, Supplementary Fig. 4a). Datapoints are population medians for individual samples, with 50,000 cells imaged per sample. Box and whiskers mark the 25th to 75th percentiles and min to max values, respectively, with the median indicated. Data pooled from 7 independent experiments, p-values are from two-tailed paired t-tests, pairing EpoR and Bcl-xL-transduced cells in each experiment. b A representative experiment as in (a), showing individual sample contour plots overlaid on scatter plots (each dot is one cell), of nuclear diameter vs. cell diameter. Red dots indicate distributions’ medians. The effect of adding Fe-SIH to the culture medium is also shown. Data are hCD4+Lin erythroblasts at 48 h post transduction. c Distinguishing erythroblasts from reticulocytes using imaging flow cytometry, with the nuclear dye Draq5. The analysis was performed on Ter119+ cells. Representative images of 3 independent experiments are shown, from cultures of Epor−/− fetal liver cells that were doubly transduced with bicistronic retroviral vectors encoding GFP and hCD4 reporters (see Supplementary Fig. 2c), at 48 h post transduction. Scale bar = 10 µm. d Reticulocyte cell diameter in cultures of EpoR-Epor−/− or Bcl-xL-Epor−/− at 48 h post transduction, identified as in (c). Data are population medians from 5 independent experiments. Box and whiskers as in (a). Two-tailed paired t-tests. e Reticulocyte diameters in cultures of Epor−/− fetal liver cells that were doubly transduced with bicistronic vectors carrying GFP and hCD4 reporters (Supplementary Fig. 2c). These vectors were either ‘empty’ (VGFP, VhCD4) or encoded either Bcl-xL or EpoR (Bcl-xLGFP, EpoRhCD4). Violin lines mark the 25th, 50th, and 75th percentile with a white circle marking the mean. Representative of two independent experiments.
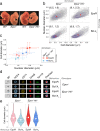
Fig. 5
Fig. 5. EpoR regulates cell size independently of HRI.
a Epor−/− and doubly deleted Epor−/−Hri−/− E12.5 embryos with wild-type littermates. b Cell and nuclear diameters in fetal livers from either Epor−/− or Epor−/−Hri−/− embryos, transduced with either EpoR or Bcl-xL, at t = 48 h post transduction. Individual sample contour plots are overlaid on scatter plots (each dot is one cell). Red dots indicate distributions’ medians. c Summary data for cell and nuclear area, for two independent experiments as in (b), each containing all 4 genotype/retrovirus combinations. Data are mean ± SD for each cell population. Each transduced population consisted of pooled fetal liver cells from either Epor−/− or Epor−/−Hri−/− embryos. Cell diameter data for all genotypes is significantly different (p = 0.0008, one-way ANOVA between population means); On the Hri−/− Epor−/− background, cell diameter is significantly different between Bcl-xL and EpoR-transduced cells (p = 0.019, one-way ANOVA from two independent experiments). d Imaging flow cytometry of representative LinhCD4+Ter119+ erythroblasts from each of the genotype/retroviral combinations at t = 48 h. Representative of at least 3 independent experiments. Scale bar = 10 µm. e Epor−/− and Epor−/−Hri−/− reticulocyte cell diameter, from cultures transduced with either EpoR or Bcl-xL. Representative of 2 experiments. Violin lines mark the 25th, 50th, and 75th percentile with a white circle marking the mean.
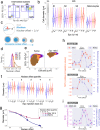
Fig. 6
Fig. 6. Red-cell size regulated by Epo concentration in mice and humans.
a, b Epo regulates erythroblast diameter. CFU-e progenitors (‘S0’) enriched from wild-type fetal livers were differentiated in vitro in a range of Epo concentrations and analyzed at 48 h. Representative of two independent experiments. a S0 cells differentiate into the S1, S2, and S3 subsets by 48 h. b Cell diameter distributions for each erythroblast subset and Epo concentration. Violin lines are 25th, 50th, and 75th percentile. White circles mark the mean. c Nuclear offset measures nuclear eccentricity, independently of cell size. It is the ratio of the delta centroid (distance between the centers of the cell and the nucleus, Δ) and cell diameter. Nuclear offset increases during erythroid morphological maturation. dg Mice were injected with saline (n = 2) or Epo (n = 2 mice with either 5 U, 20 U, or 100 U). Bone marrow analyzed at 48 h. d Nuclear offset quintiles for Ter119+ erythroblasts in saline-injected mice. e CD71/forward-scatter (FSC) histograms for the nuclear offset quintiles in (d) of Ter119+ erythroblasts. Quintile values that were determined for saline-injected mice were also applied to the Epo-injected mice. Sequential quintiles are seen to contain increasingly mature erythroblasts. f Cell diameter in each nuclear offset quintile in (e), for each Epo dose. Violin lines are 25th, 50th, and 75th percentile, white circle marks the mean. Data representative of n = 2 mice per Epo dose. g Median cell diameter and median nuclear offset values in each nuclear offset quintile, for mice injected with Epo (100 U) or Saline. Datapoints are individual mice. h Human intervention studies. Epo was administered during the period indicated. In study #1, n = 25 subjects were treated with Epo and n = 9 subjects with placebo. In study #2, n = 24 each for placebo and Epo. Data is fractional change relative to the baseline values of each participant. Additional hematological parameters and data for placebo groups are in Supplementary Figs. 14, 15 and Supplementary statistical analysis. MCV, mean corpuscular volume; Retics, reticulocyte count. i RDW_SD and reticulocyte counts for human intervention study #1 described in panel (h).
Fig. 7
Fig. 7. EpoR signaling promotes rapid cycling while maintaining cell size in early erythroblasts.
Proposed model explaining EpoR-dependent functions during ETD. EpoR expression is limited to early erythroblasts, which are sensitive to EpoR signaling. When EpoR signaling is weak or absent, as in late erythroblasts, or in early erythroblasts in the presence of low Epo, cell divisions lead to cell size reductions. In contrast, strong EpoR signaling, as seen in Epo-sensitive early erythroblasts, can override this default state, simultaneously increasing rapid cycling while maintaining cell size. As consequence, high-Epo levels increase the duration of the early ETD phase, increase the relative frequency of early erythroblasts, and also increase erythroblast cell size at every maturation stage, giving rise to larger red cells. In high Epo, red-cell size is also more heterogeneous, a result of the varying sensitivities of early erythroblasts to Epo. Erythroblasts with low sensitivity to Epo, here represented as cells expressing low levels of EpoR, receive only weak EpoR signals even in the presence of high Epo, giving rise to smaller red cells.

Similar articles

Cited by

References

    1. Kassebaum NJ, et al. A systematic analysis of global anemia burden from 1990 to 2010. Blood. 2014;123:615–624. - PMC - PubMed
    1. D’Andrea AD, Fasman GD, Lodish HF. Erythropoietin receptor and interleukin-2 receptor b chain: a new receptor family. Cell. 1989;58:1023–1024. - PubMed
    1. Stephenson JR, Axelrad AA, McLeod DL, Shreeve MM. Induction of colonies of hemoglobin-synthesizing cells by erythropoietin in vitro. Proc. Natl. Acad. Sci. USA. 1971;68:1542–1546. - PMC - PubMed
    1. Tusi BK, et al. Population snapshots predict early haematopoietic and erythroid hierarchies. Nature. 2018;555:54–60. - PMC - PubMed
    1. Wu H, Liu X, Jaenisch R, Lodish HF. Generation of committed erythroid BFU-E and CFU-E progenitors does not require erythropoietin or the erythropoietin receptor. Cell. 1995;83:59–67. - PubMed

Publication types

MeSH terms