. 2021 Dec 17;12(1):7338.
doi: 10.1038/s41467-021-27619-4.

Investigating immune and non-immune cell interactions in head and neck tumors by single-cell RNA sequencing

Affiliations

Investigating immune and non-immune cell interactions in head and neck tumors by single-cell RNA sequencing

Cornelius H L Kürten et al. Nat Commun. .

Abstract

Head and neck squamous cell carcinoma (HNSCC) is characterized by complex relations between stromal, epithelial, and immune cells within the tumor microenvironment (TME). To enable the development of more efficacious therapies, we aim to study the heterogeneity, signatures of unique cell populations, and cell-cell interactions of non-immune and immune cell populations in 6 human papillomavirus (HPV)+ and 12 HPV- HNSCC patient tumor and matched peripheral blood specimens using single-cell RNA sequencing. Using this dataset of 134,606 cells, we show cell type-specific signatures associated with inflammation and HPV status, describe the negative prognostic value of fibroblasts with elastic differentiation specifically in the HPV+ TME, predict therapeutically targetable checkpoint receptor-ligand interactions, and show that tumor-associated macrophages are dominant contributors of PD-L1 and other immune checkpoint ligands in the TME. We present a comprehensive single-cell view of cell-intrinsic mechanisms and cell-cell communication shaping the HNSCC microenvironment.


Conflict of interest statement

R.L.F: Aduro Biotech, Inc; EMD Serono; MacroGenics, Inc.; Numab Therapeutics AG; Pfizer; Sanofi Tesaro; Zymeworks, Inc (honoraria); Astra-Zeneca/MedImmune (clinical trial, research funding); Bristol-Myers Squibb (honoraria, clinical trial, research funding); Merck (honoraria, clinical trial); Novasenta (honoraria, stock, research funding); (research funding). D.A.A.V.: Stock: Novasenta, Tizona, Trishula, Oncorus, Werewolf, Apeximmune; Consultancy: Tizona, Werewolf, F-Star, Astellas, BMS, MPM, Incyte, Bicara, Apeximmune, G1 Therapeutics, Innovent Bio, Kronos Bio; Grants: BMS, Astellas, Novasenta; Patents licensed and Royalties: Astellas, BMS, Novasenta. The remaining authors declare no competing interests.

Figures
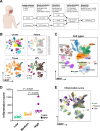
Fig. 1
Fig. 1. Workflow and cohort overview with cell-type identification, naming, and inflammation scoring.
A Fresh tumor and blood samples from HNSCC patients (n = 18 patients) were collected, dissociated, sorted, processed using a 10× Chromium controller, and then sequenced. Patient image was created using BioRender.com B UMAP dimensionality reduction of the total cohort of 134,606 cells was performed, based on visualization of relevant characteristics: patient contribution (HN01–HN18), cell clusters (0–33), tissue of origin (PBL vs. tumor), and viral-status (HPV+ vs. HPV). C UMAP plot showing identified cell types [B cells, CD4+ T cells, CD8+ T cells, dendritic cells (DC), plasmacytoid DC, endothelial cells, epithelial cells, fibroblasts, pericytes, macrophages, monocytes, natural killer (NK) cells, T regulatory (Treg) cells, mast cells]. D Inflammation scores were determined by quantifying the total leukocyte infiltrate in each tumor based on H&E staining (n = 17 patients). Tertiles were used to segregate patients into three groups based on their inflammation score: low (n = 6 patients), medium (n = 5 patients), and high (n = 6 patients). Patients with HPV+ and HPV etiologies are indicated. Center lines represent median values for each cohort. Inflammation scores were evaluated using a one-way ANOVA test. E UMAP plot showing cell contributions based on inflammation scores.
Fig. 2
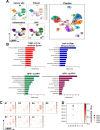
Fig. 2. Detailed characterization of CD8+ T cells and intratumoral CD8+ cell differences in tumors with low and high inflammation scores.
A Sub-clustering of 27,013 CD8+ T cells (n = 18 patients; cluster 0–13) and visualization of relevant characteristics: patient contribution (HN01–HN18), viral-status (HPV+ vs. HPV), inflammation score (low, medium, high; cells from the PBL, as well as all cells from HN03 were excluded) and CD8+ T cell sub-states (cycling, cytotoxic, naive-like, pre-dysfunctional, terminally exhausted). B Hallmark gene sets enriched (using the Computer Overlaps tool from MSigDB) in the top 100 DEGs between CD8+ T cells from high vs. low inflammation patients (and vice versa, all p < 0.01). p-values for enrichment were extrapolated from hypergeometric distribution.
Fig. 3
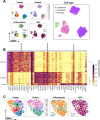
Fig. 3. Squamous epithelial cancer cells and HPV gene expression.
A Sub-clustering of 14,920 epithelial cells (n = 15 patients; cluster 0–16) and visualization of relevant characteristics: patient contribution (HN01, HN05–HN18), viral-status (HPV+ vs. HPV), cancer site (larynx, oral cavity, oropharynx) and inflammation score (low, medium, high). B Hallmark gene sets enriched (using the Computer Overlaps tool from MSigDB) in epithelial cells derived from tumors with low vs. high inflammation score, as well as HPV+ vs. HPV lesions (and vice versa, all p < 0.0001). p-values for enrichment were extrapolated from hypergeometric distribution. C UMAP visualization of transcripts of HPV16 genes (E1, E2, E5, E6, E7, L1, and L2) in epithelial cells. D HPV+ patient-specific intensity and prevalence of HPV16 gene expression. Color bar indicates normalized gene expression.
Fig. 4
Fig. 4. Overview of stromal cells with a focus on pericytes.
A Sub-clustering of 12,179 stromal cells (non-immune, non-epithelial cells; n = 15 patients; cluster 0–10) and visualization of relevant characteristics: patient contribution (HN01, HN05–HN18), viral-status (HPV+ vs. HPV), cell type (endothelial, fibroblasts, pericytes) and inflammation score (low, medium, high). B Heatmap showing top 10 genes characterizing each cluster (color scale depicts scaled gene expression). C Sub-clustering of pericytes (cluster 0–4) and visualization of relevant characteristics: patient contribution (HN01–HN18), viral-status (HPV+ vs. HPV), cell type (endothelial, fibroblasts, pericytes), and inflammation status (low, medium, high).
Fig. 5
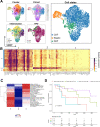
Fig. 5. Fibroblast sub-states, DEG, and impact on survival.
A Sub-clustering of 4034 fibroblasts (n = 15 patients; cluster 0–7) and visualization of relevant sample characteristics: patient contribution (HN01, HN05–HN18), HPV status (HPV+ vs. HPV), inflammation score (low, medium, high), and sub-states (cancer-associated fibroblasts, normal activated fibroblasts, and fibroblasts with elastic differentiation). B Heatmap showing top 25 genes characterizing each cluster (color scale depicts scaled gene expression). C Enriched hallmark gene sets between clusters based on results of gene set enrichment analysis (“singleseqgset” package). D Overall survival analysis of HPV+ patients from the TCGA HNSCC bulk RNAseq cohort based on gene signature scores of fibroblasts with elastic differentiation and cancer-associated fibroblasts (log rank test p = 0.0013).
Fig. 6
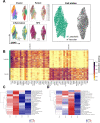
Fig. 6. Endothelial cell subsets and DEG.
A Sub-clustering of 7431 endothelial cells (n = 15 patients; cluster 0–7) and visualization of relevant sample characteristics: patient contribution (HN01, HN05–HN18), HPV status (HPV+ vs. HPV), inflammation score (low, medium, high) and types of endothelial cells (lymphatic and vascular). B Heatmap showing top 25 genes characterizing each cluster (color scale depicts scaled gene expression). Enriched hallmark gene sets between C lymphatic and D vascular endothelial cell clusters based on results of gene set enrichment analysis (“singleseqgset” package) are shown.
Fig. 7
Fig. 7. Crosstalk between various cellular constituents of the TME evaluated by potential ICR–ICL interactions.
A Average expression of immune checkpoint receptors and corresponding ligands on all cell types identified in tumors with low, medium, and high inflammation scores is summarized (n = 17 patients). CellPhoneDB package was used to predict patient-specific ICR–ICL interactions between CD8+ T cells and B CD45 endothelial cells (Endo), epithelial cells, fibroblasts (Fibro), and pericytes or C myeloid APC (DC, macrophages, and monocytes) in tumors with low and high inflammation scores. The colored scale represents the log2 mean expression of receptor–ligand pairs.
Fig. 8
Fig. 8. Macrophages are major contributors of PD-L1 to CD8+ T cells in HNSCC.
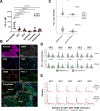
A Mean fluorescence intensity (MFI) of PD-L1 on immune (macrophages, DC1, and DC2) and non-immune (fibroblasts, epithelial, and endothelial) cell types within the HNSCC was evaluated by flow cytometry (n = 7 patients) as depicted in Supplementary Fig. 10. Datapoints represent individual patients. Center lines represent mean values and whiskers depict standard errors of means. p-values were calculated using the one-way ANOVA test. BE Multispectral immunofluorescence (mIF) staining was performed on tumor sections obtained from patients HN12, HN13, HN14, HN15, and HN18 using the conditions described in Supplementary Table 4. Three or more high-resolution images of regions of interest (ROIs) that contained a balance of tumoral (tumor bed) and peritumoral/stromal regions were acquired from each tumor section. ROIs were selected based on H&E staining in addition to mIF whole slide scans. B A representative ROI selected from patient HN12 is shown. Individual channels for pan-CK, DAPI, CD8, CD3, CD68, and PD-L1 are presented, as well as the composite image. Tumor bed is depicted by the cyan-colored border line in the composite image. C Intensity of PD-L1 expression on CD68+PD-L1+ macrophages and pan-CK+ PD-L1+ tumor cells pooled from all patient-associated ROIs is shown (n = 5 patients). Datapoints represent 41 individual ROIs colored by patient id. D Patient-specific pooled PD-L1 expression levels are shown. 43,517 cells from the 41 ROIs in C were included in the analysis. E Measured distance to CD3+CD8+CD68 T cells from CD68+PD-L1+ macrophages or pan-CK+PD-L1+ tumor cells pooled from all patient-associated ROIs is shown. Dashed lines represent the 35 μm distance used as the cutoff to measure cell-to-cell interactions between evaluated cell types. This distance represents 1–2 cell diameter distance between macrophages (20–30 μm in diameter) and lymphocytes (5–7 μm in diameter). Calculated median distances across all patients and between evaluated cell types are shown. For boxplots, center lines represent median values, box limits represent upper and lower quartiles and whiskers represent 1.5× interquartile range. One-way ANOVA test was used in A. Linear mixed-effects models were used in C and D, with cell group as a fixed effect and individual patient as a random effect. BH-FDR method was used for multiple comparison adjustment. All tests are two-sided.

References

    1. Hanahan D, Weinberg RA. Hallmarks of cancer: the next generation. Cell. 2011;144:646–674. - PubMed
    1. Iacobuzio-Donahue CA, Litchfield K, Swanton C. Intratumor heterogeneity reflects clinical disease course. Nat. Cancer. 2020;1:3–6. - PubMed
    1. Mroz EA, Rocco JW. MATH, a novel measure of intratumor genetic heterogeneity, is high in poor-outcome classes of head and neck squamous cell carcinoma. Oral. Oncol. 2013;49:211–215. - PMC - PubMed
    1. Ferris RL, et al. Nivolumab for recurrent squamous-cell carcinoma of the head and neck. N. Engl. J. Med. 2016;375:1856–1867. - PMC - PubMed
    1. Chow LQM. Head and neck cancer. N. Engl. J. Med. 2020;382:60–72. - PubMed

Publication types

MeSH terms