. 2021 Dec 17;12(1):7337.
doi: 10.1038/s41467-021-27618-5.

Sources of confidence in value-based choice

Affiliations

Sources of confidence in value-based choice

Jeroen Brus et al. Nat Commun. .

Abstract

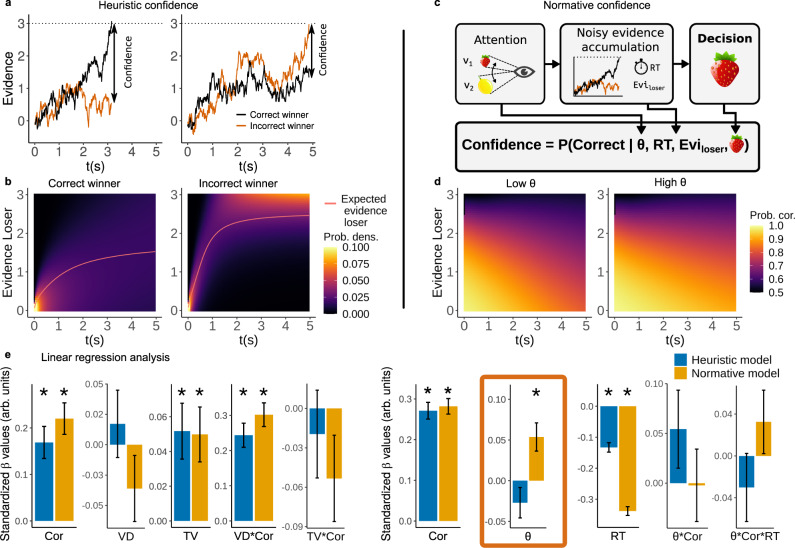
Confidence, the subjective estimate of decision quality, is a cognitive process necessary for learning from mistakes and guiding future actions. The origins of confidence judgments resulting from economic decisions remain unclear. We devise a task and computational framework that allowed us to formally tease apart the impact of various sources of confidence in value-based decisions, such as uncertainty emerging from encoding and decoding operations, as well as the interplay between gaze-shift dynamics and attentional effort. In line with canonical decision theories, trial-to-trial fluctuations in the precision of value encoding impact economic choice consistency. However, this uncertainty has no influence on confidence reports. Instead, confidence is associated with endogenous attentional effort towards choice alternatives and down-stream noise in the comparison process. These findings provide an explanation for confidence (miss)attributions in value-guided behaviour, suggesting mechanistic influences of endogenous attentional states for guiding decisions and metacognitive awareness of choice certainty.


Conflict of interest statement

The authors declare no competing interests.

Figures

Fig. 1
Fig. 1. Experiment and regression analysis of choice consistency and confidence.
a Example display of the rating and choice task. Participants rated their desirability to eat the displayed food item. Next participants were asked to indicate which of the two food items they preferred to consume. After their choice, participants were asked how confident they were about their decision. b Standardized estimates of a multiple logistic regression on choice consistency (green) show that higher value difference (VD) leads to more consistent choices (β = 0.28 ± 0.04, P < 0.001). Higher variability (Var) in the rating of the two alternatives leads to less consistent choices (β = −0.15 ± 0.05, P = 0.002). The total value (TV) of the two items had no reliable influence on choice consistency (β = 8.7 × 10−3 ± 0.05, P = 0.43). Standardized estimates of a multiple linear regression on confidence reports show that higher VD lead to more confidence (β = 0.05 ± 0.01, P < 0.001). Crucially, higher variability in the rating of the two alternatives does not have a reliable effect on confidence (β = 0.01 ± 0.02, P = 0.2). Higher TV increases confidence (β = 0.28 ± 0.06, P < 0.001). Error bars indicate the mean standard deviation of the posterior estimates. c The difference of the effect size of the influence of variability on choice consistency and confidence is significant with P < 0.01. Vertical red dashed line indicates the median, black vertical lines indicate the 95% highest density interval. d Participant’s average level of variability in the rating task had a negative influence on average choice consistency of that participant (β = −0.58 ± 0.16, P < 0.001, r = −0.53), however, this effect is not present for the same analyses performed on confidence reports (β = −0.19 ± 0.18, P = 0.15, r = −0.22), P-values are based on the highest density interval of the posterior estimates. Gray shaded areas indicate the 95% confidence bands. The difference of the effect of average variability on choice consistency and confidence ratings is significant (Δβcons−conf = −0.39 ± 0.24, P = 0.05). e Confidence as a function of absolute value difference shows the qualitative signatures of confidence reports guided by its statistical definition. Confidence as a function reaction time shows signatures reported in previous work. Confidence as a function of total value confirms the quantitative results presented in panel (b). Data are presented as mean values ± SEM. For the whole figure n = 33 independent participants. Source data are provided as a Source Data file.
Fig. 2
Fig. 2. Generative modeling of confidence: heuristic and normative.
a Illustration of how confidence reports are generated by the decision-maker according to the heuristic process: confidence is simply computed as the difference between the decision bound and the evidence of the losing accumulator at the time of decision. b Confidence can be computed via the estimation of the expected evidence of the losing accumulator. c How the observer generates confidence reports according to the normative model: confidence is generated by computing the probability that the decision is correct given the decision time and the process model parameters. d Confidence predictions generated by the normative model as a function of RTs, evidence of the loser accumulator, and attentional effort. e Linear regression analysis of confidence comparing the heuristic (blue) versus the normative (orange) model. The results originate from two separate linear regressions, on the left Confidence ~ Correct (Cor) + VD + TV + VD*Cor + TV*Cor and on the right Confidence ~ Cor + θ + RT + θ*Cor + θ*Cor*RT. We use two linear regressions to prevent problems with high correlations between explanatory variables and to separate the input variables from the variables that are generated by the decision-maker. Bars indicate the mean of the standardized β values and error bars the standard error, stars indicate significant difference from 0 with α = 0.05. Statistics are calculated using n = 33 independent participants. Only the normative model predicts that confidence should be higher for higher values of attentional effort.
Fig. 3
Fig. 3. Joint modeling, the covariance approach.
a Graphical diagram for the joint model with the covariance approach. White circular nodes represent latent variables, grey rectangular nodes represent observable variables. The variables θi, ki, and choices and reaction times feed into the generative models of confidence. b Folke et al. performed similar experiments, with the key difference that the rating task is not repeated. Furthermore, subjects were asked how much they were willing to pay for a certain food item using a standard incentive-compatible Becker–DeGroot–Marschak method. c Results from the variable normative model and model comparison. Confidence is positively related to trial-to-trial fluctuations of attentional effort and evidence gain, shown for three example subjects (for all subjects see Supplementary Figs.  7 and 8). The estimated density of correlation parameters for confidence and attentional effort and for confidence and the evidence gain is bigger than zero. In both cases ρmcmc > 0 with P < 0.001. The vertical red dashed line indicates the median, black lines indicate the 95% confidence interval. Loo model comparison of the fixed heuristic (FH), variable heuristic (VH), fixed normative (FN), and variable normative (VN) model versions show that the VN model explains the data best. The Bayes Factor (BF) is calculated between the variable normative model and all other models, for all comparisons we find an infinite BF in favor of the variable normative model. d The same as (c), but for the Folke data. e The empirically found confidence levels as a function of (from left to right) value difference, reaction time, total value, attentional effort, and the evidence gain, split for consistent and inconsistent choice. Data are presented as mean values ± SEM. g The same as in e, but for the predictions of the variable normative model. f, h The same as in (d) and (e), but for the data of Folke et al. For the Brus et al. dataset n = 33 independent participants, for Folke et al. n = 28 independent participants. Source data are provided as a Source Data file.
Fig. 4
Fig. 4. The RUM decision model.
a Sketch of the simple RUM decision model, color-coded to match the graphs. Observers infer the value of the food items by looking back and forth between choice alternatives. The subsequent comparison process is noisy. We investigate how confidence ratings influence trial-to-trial fluctuations of attentional factors and the evidence gain. b, d Comparison of parameter estimates of two alternative RUMs: a RUM with agent-specific estimates of k and θ and a RUM that allows for trial-to-trial fluctuations of k and θ. b) the median of the posterior estimate of θ of the agent-specific RUM is indicated by the horizontal blue line, the shaded grey area indicates the 95% confidence interval. The diagonal blue lines represent 100 random samples of the posterior distribution of how θ changes with confidence in the RUM allowing for trial-to-trial fluctuations. Remarkably, θ changes over its full range as a function of confidence. d) the same as b, but for k. f Left: standardized posterior estimates of the relationship between confidence and k and θ. Error bars indicate the mean posterior estimate of the standard deviation. Both βk and βθ are significantly bigger than zero with P < 0.001. Right: effect sizes of the results shown on the left. Error bars indicate the standard deviation of the posterior estimates of the mean of the effect size. Both the effect sizes of βk and βθ are significantly bigger than zero with P < 0.001. P-values are based on the highest density interval of the posterior estimates. h Left column: the empirical probabilities of choosing the upper item; up: as a function of value difference; down: as a function of the difference in dwell time. Right column: the same as left but for the predicted probabilities of choosing the upper item by the simple RUM. The trials are median split in high/low confidence. Value difference and dwell time difference are split into eight groups of equal size. Data are presented as mean values ± SEM. c, e, g, i) Same as b, d, f, h, but for the data of Folke et al. For the Brus et al. dataset n = 33 independent participants, for Folke et al. n = 28 independent participants. Source data are provided as a Source Data file.
Fig. 5
Fig. 5. The efficient coding model.
a The decision process with three distinct process stages, color-coded to match the graphs. The prior matches the distribution of subjective values v of supermarket products. When choosing between two items, subjects look repeatedly at them, spending unequal time on the two options. The subjective values are internally encoded, the corresponding likelihood function p(v^v) is constrained by the prior p(v) via efficient coding. Lastly, noise that occurs after the decoding is taken into account. b Standardized posterior estimates of the relationship between confidence and variance in the encoding process (βσenc), the variance in the comparison process (βσcomp), and attentional factors (βθ). (βσenc) is not significantly different from 0 (P = 0.39), both (βσcomp) and (βθ) are significantly bigger than zero with P < 0.001. The effect size of (βσenc) is not significantly different from 0. Both the effect sizes of (βσcomp) and (βθ) are significantly bigger than zero with P < 0.001. Error bars indicate the mean posterior estimate of the standard deviation. P-values are based on the highest density interval of the posterior estimates. c Left column: the empirical probabilities of choosing the upper item; up: as a function of value difference; down: as a function of the difference in dwell time. Right column: the same as left but for the predicted probabilities by the efficient coding model. The trials are median split in high/low confidence. Value difference and dwell time difference are split into eight groups of equal size. Data are presented as mean values ± SEM. Source data are provided as a Source Data file. d Comparison of parameter estimates of two alternative efficient coding models: a model with agent-specific estimates of σenc and a model that allows for trial-to-trial fluctuations of σenc. The median of the posterior estimate of σenc of the agent-specific model is indicated by the horizontal green line, the shaded grey area indicates the 95% confidence interval. The diagonal green lines represent 100 random samples of the posterior distribution of how σenc changes with confidence in the model allowing for trial-to-trial fluctuations. e, f Same as (e) but for σcomp and θ. g Comparison of the effect sizes of the posterior estimates of σenc and σcomp. Vertical red dashed line indicates the median, black lines indicate the 95% confidence interval. h Comparison of the posterior estimates of the intercept of θ in the efficient coding model and the RUM. i Comparison of the posterior estimates of the slope of θ in the efficient coding model and the RUM. For the whole figure n = 33 independent participants.

Similar articles

Cited by

References

    1. Bang D, et al. Confidence matching in group decision-making. Nat. Hum. Behav. 2017;1:1–7.
    1. M. G. Edelson, R. Polania, C. C. Ruff, E. Fehr, and T. A. Hare. Computational and neurobiological foundations of leadership decisions. Science10.1126/science.aat0036 (2018). - PubMed
    1. Camerer C, Lovallo D. Overconfidence and excess entry: an experimental approach. Am. Econ. Rev. 1999;89:306–318.
    1. Folke T, Jacobsen C, Fleming SM, De Martino B. Explicit representation of confidence informs future value-based decisions. Nat. Hum. Behav. 2017;1:17–19.
    1. Kiani R, Corthell L, Shadlen MN. Choice certainty is informed by both evidence and decision time. Neuron. 2014;84:1329–1342. - PMC - PubMed

Publication types