. 2021 Dec 17;12(1):7333.
doi: 10.1038/s41467-021-27452-9.

A targetable LIFR-NF-κB-LCN2 axis controls liver tumorigenesis and vulnerability to ferroptosis

Affiliations

A targetable LIFR-NF-κB-LCN2 axis controls liver tumorigenesis and vulnerability to ferroptosis

Fan Yao et al. Nat Commun. .

Abstract

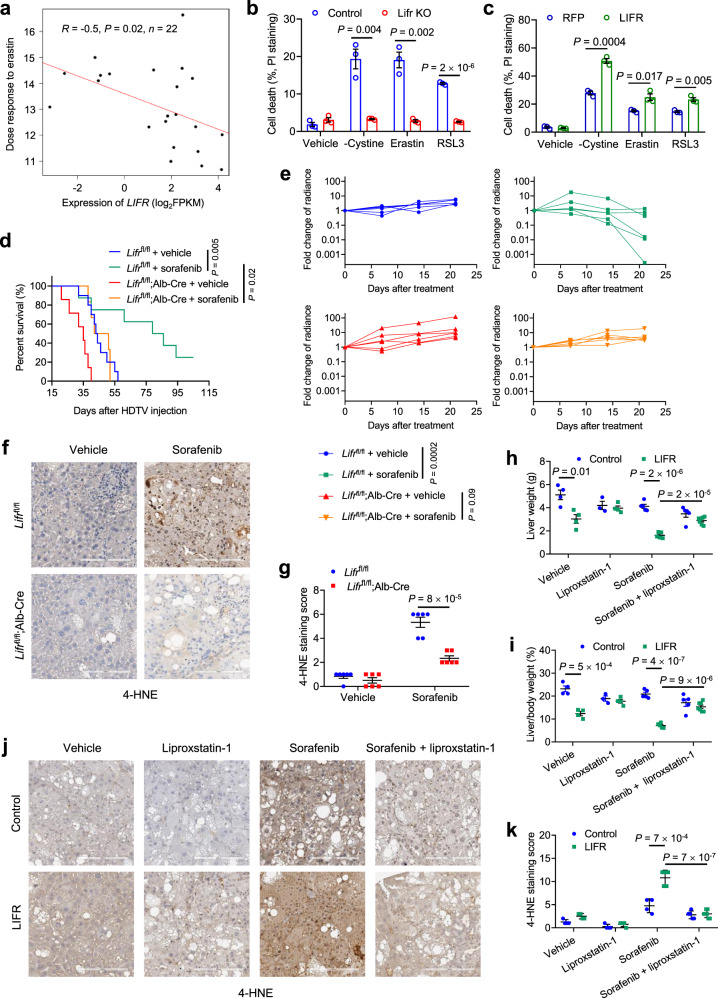
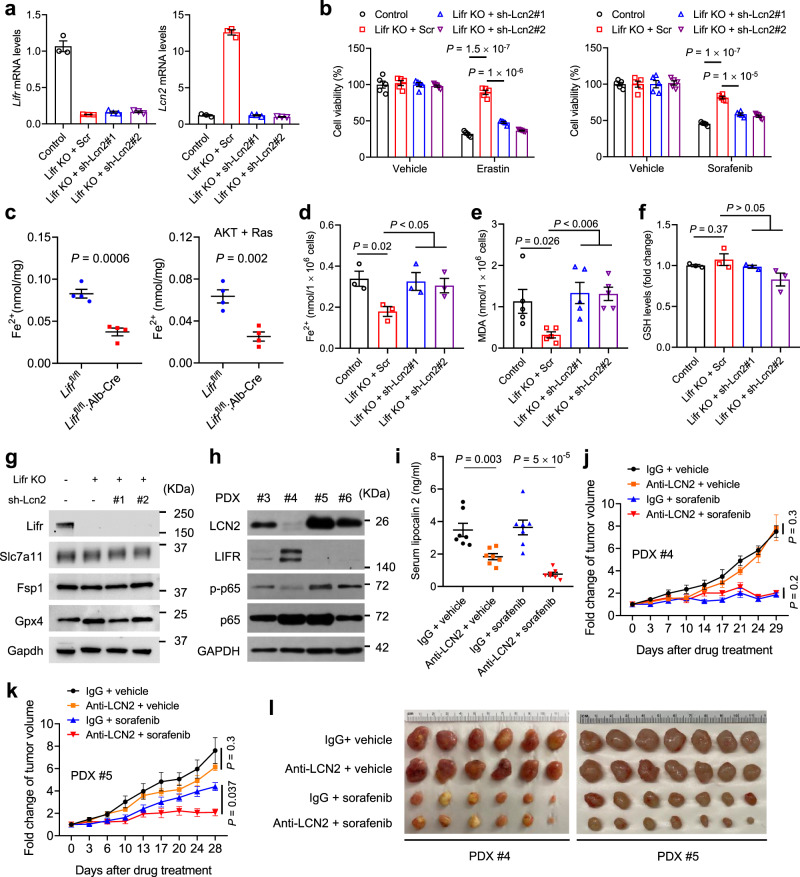
The growing knowledge of ferroptosis has suggested the role and therapeutic potential of ferroptosis in cancer, but has not been translated into effective therapy. Liver cancer, primarily hepatocellular carcinoma (HCC), is highly lethal with limited treatment options. LIFR is frequently downregulated in HCC. Here, by studying hepatocyte-specific and inducible Lifr-knockout mice, we show that loss of Lifr promotes liver tumorigenesis and confers resistance to drug-induced ferroptosis. Mechanistically, loss of LIFR activates NF-κB signaling through SHP1, leading to upregulation of the iron-sequestering cytokine LCN2, which depletes iron and renders insensitivity to ferroptosis inducers. Notably, an LCN2-neutralizing antibody enhances the ferroptosis-inducing and anticancer effects of sorafenib on HCC patient-derived xenograft tumors with low LIFR expression and high LCN2 expression. Thus, anti-LCN2 therapy is a promising way to improve liver cancer treatment by targeting ferroptosis.


Conflict of interest statement

The authors declare no competing interests.

Figures

Fig. 1
Fig. 1. Loss of Lifr promotes liver cancer.
a, b Unpaired (a, n = 50 patients for normal livers; n = 374 patients for liver tumors) and paired (b, n = 50 patients) comparison of LIFR mRNA levels, based on TCGA data. The dashed and dotted lines in a are the medians and the quartiles, respectively. Statistical significance was determined by a two-tailed unpaired (a) or paired (b) t-test. c qPCR of LIFR in human liver tumors (n = 37). Statistical significance was determined by a two-tailed unpaired t-test. d Immunoblotting of Lifr and Gapdh in liver tumors (T) and adjacent normal tissues (N) from DEN-treated C57BL/6 mice. e, f qPCR (e) and immunoblotting (f) of Lifr in livers of 3-month-old Lifrfl/fl and Lifrfl/fl;Alb-Cre mice. n = 3 samples per mouse; n = 3 mice per group. g Images of livers in 2-year-old Lifrfl/fl and Lifrfl/fl;Alb-Cre mice. Arrows indicate macroscopic tumors. h Images and H&E staining of livers in DEN-treated 7-month-old Lifrfl/fl and Lifrfl/fl;Alb-Cre mice. Scale bars, 100 μm. i Kaplan−Meier curves of overall survival of DEN-treated Lifrfl/fl (n = 14) and Lifrfl/fl;Alb-Cre (n = 8) mice. Statistical significance was determined by a log-rank test. j, k Images (j) and H&E staining (k) of livers from Lifrfl/fl and Lifrfl/fl;Alb-Cre mice, 29 days after hydrodynamic injection of plasmids expressing the Sleeping Beauty transposase, β-catenin, and YAP. Scale bars, 300 μm. l, m Liver weight (l) and liver-to-body weight ratio (m) of the mice described in j. n = 7 mice. n Gross images and H&E staining of livers from Lifrfl/fl and Lifrfl/fl;Cre-ERT2 mice, 28 days after hydrodynamic injection of plasmids expressing the Sleeping Beauty transposase, myrAKT, and RasV12. From day 7, all mice received 5-day tamoxifen treatment. Scale bars, 300 μm. oq Number of liver nodules (n = 7 mice; o), liver weight (n = 6 mice; p), and liver-to-body weight ratio (n = 6 mice; q) of the mice described in n. Statistical significance in l, m, and oq was determined by a two-tailed unpaired t-test. Error bars are s.e.m. Source data are provided as a Source Data file.
Fig. 2
Fig. 2. LIFR confers sensitivity to ferroptosis.
a Correlation between LIFR expression and erastin sensitivity, based on the liver cancer cell lines (n = 22) from CTRP. Dose responses are normalized area under curve values. The linear relationship was determined by a two-tailed Pearson correlation analysis. b, c Lifr-knockout (b) and LIFR-overexpressing (c) PHM cells were treated with DMSO (vehicle), cystine starvation, erastin (10 μM), or RSL3 (0.1 μM) for 24 h. Cell death was measured by PI staining. n = 3 wells. d Kaplan−Meier curves of overall survival of Lifrfl/fl and Lifrfl/fl;Alb-Cre mice that received sorafenib treatment 7 days after hydrodynamic injection of plasmids expressing the Sleeping Beauty transposase, myrAKT-IRES-luciferase, and RasV12. Sorafenib was administered 6 days a week. Statistical significance was determined by a log-rank test. n = 6 mice. e Photon flux of Lifrfl/fl and Lifrfl/fl;Alb-Cre mice that received sorafenib treatment 7 days after hydrodynamic injection of plasmids expressing the Sleeping Beauty transposase, myrAKT-IRES-luciferase, and RasV12. Sorafenib was administered 6 days a week. Statistical significance was determined by a two-tailed unpaired t-test. n = 6 mice. f, g Immunohistochemical staining (f) and quantification (g) of 4-HNE in livers of the mice described in e. n = 6 mice. Scale bars, 200 μm. h, i Liver weight (h) and liver-to-body weight ratio (i) of C57BL/6 mice that received control adenovirus or LIFR-expressing adenovirus 3 days and 17 days after hydrodynamic injection of plasmids expressing the Sleeping Beauty transposase, myrAKT, and RasV12. One week after plasmid injection, mice received 30 mg kg−1 sorafenib and/or 10 mg kg−1 liproxstatin-1, 6 days a week for 4 weeks. n = 4, 4, 3, 4, 5, 5, 5, and 7 mice from left to right. j, k Immunohistochemical staining (j) and quantification (k) of 4-HNE in livers of the mice described in h. n = 4, 4, 4, 4, 4, 5, 5, and 7 mice from left to right. Scale bars, 200 μm. Statistical significance in b, c, gi, and k was determined by a two-tailed unpaired t-test. Error bars are s.e.m. Source data are provided as a Source Data file.
Fig. 3
Fig. 3. LIFR negatively regulates NF-κB signaling and LCN2 in the liver.
a Volcano plot of genes upregulated (red) or downregulated (blue) in Lifrfl/fl;Alb-Cre mice (n = 3) relative to Lifrfl/fl mice (n = 2). Statistical analysis of RNA-seq data was performed using Cuffdiff and P values are false discovery rate (FDR)-adjusted. b Cytokine arrays of the conditioned medium of Lifr-knockout PHM cells. Boxed: the top five upregulated (red) and downregulated (blue) cytokines. c qPCR of Lcn2 in Lifr-knockout PHM cells. n = 3 samples. d ELISA of lipocalin 2 in the conditioned medium of Lifr-knockout PHM cells. n = 5, 4, and 5 wells from left to right. e ELISA of lipocalin 2 in the serum of 3-month-old Lifrfl/fl and Lifrfl/fl;Alb-Cre mice. n = 4 mice. f Pathway analysis of Lifr-knockout PHM cells with or without LIFR add-back. g, h Immunoblotting of p-p65, p65, and LIFR in LIFR-knockdown (g) and LIFR-overexpressing (h) Mahlavu cells. i, j Pathway analysis of livers of Lifrfl/fl and Lifrfl/fl;Alb-Cre mice that received hydrodynamic injection of plasmids expressing the Sleeping Beauty transposase and oncogenes (i: β-catenin + YAP; j: myrAKT + RasV12). k, l qPCR of Lcn2 in livers described in i and j, respectively. n = 3 samples per mouse; n = 2 mice per group. m, n Immunohistochemical staining (m) and quantification (n) of Lcn2 in livers described in i and j, respectively. n = 6 mice. o Immunoblotting of Lifr, p-p65, p65, p-Stat3, Stat3, and Gapdh in livers of Lifrfl/fl and Lifrfl/fl;Cre-ERT2 mice, 28 days after hydrodynamic injection of plasmids expressing the Sleeping Beauty transposase, myrAKT, and RasV12. From day 7, all mice received 5-day tamoxifen treatment. p, q Immunohistochemical staining (p) and quantification (q) of Lcn2 in livers of the mice that received control or LIFR-expressing adenovirus 3 days and 17 days after hydrodynamic injection of plasmids expressing the Sleeping Beauty transposase, myrAKT, and RasV12. Scale bars, 200 μm. n = 4 mice. Statistical significance in ce, n, and q was determined by a two-tailed unpaired t-test. Error bars are s.e.m. Source data are provided as a Source Data file.
Fig. 4
Fig. 4. Loss of LIFR activates NF-κB signaling through SHP1, leading to upregulation of LCN2.
a HEK293T cells were transfected with HA-FLAG-SHP1 and SFB-tagged GFP or LIFR. LIFR-SFB protein was pulled down with S-protein beads, followed by immunoblotting with antibodies against FLAG and HA. b HEK293T cells were transfected with MYC-SHP2 and SFB-tagged GFP or LIFR. LIFR-SFB protein was pulled down with S-protein beads, followed by immunoblotting with antibodies against FLAG and MYC. c HEK293T SFB-GFP and SFB-LIFR stable cell lines were infected with the scrambled (Scr) or sh-SHP1 lentivirus, followed by transfection with a K63-specific mutant of His-Xpress-ubiquitin (Ub). 48 h later, cells were subjected to pulldown with nickel beads and immunoblotting with antibodies against TRAF6 and Xpress. d Control and LIFR-overexpressing PLC/PRF/5 cells were transduced with SHP1 shRNA and immunoblotted with the indicated antibodies. e Control (Scr) and LIFR-knockdown HEK293T cells were transfected with FLAG-TRAF6. 48 h later, cells were immunoprecipitated with a FLAG-specific antibody and immunoblotted with antibodies against LIFR, SHP1, and FLAG. f, g qPCR of LCN2, LIFR, and RELA in HEK293T (f) and PLC/PRF/5 (g) cells transduced with LIFR shRNA alone or in combination with p65 shRNA. n = 3 technical replicates. h qPCR of Lcn2, Lifr, and RelA in control and Lifr-knockout PHM cells transduced with the scrambled shRNA (Scr) or p65 shRNA. n = 3 technical replicates. i, j Immunohistochemical staining (i) and quantification (j) of Lcn2 in livers from Lifrfl/fl (F/F) and Lifrfl/fl;Alb-Cre (LKO) mice, 57 days after hydrodynamic injection of plasmids expressing the Sleeping Beauty transposase, myrAKT, RasV12, and shRNA (sh-p65, sh-Lcn2, or scrambled). n = 10, 8, 10, and 12 mice from left to right. Scale bars, 200 μm. k, l Liver weight (k) and liver-to-body weight ratio (l) of the mice described in i and j. n = 10, 8, 10, and 12 mice from left to right. m H&E staining of livers described in i and j. Scale bars, 300 μm. Statistical significance in fh and jl was determined by a two-tailed unpaired t-test. Error bars are s.e.m. Source data are provided as a Source Data file.
Fig. 5
Fig. 5. LIFR and SHP1 positively regulate ferroptosis while LCN2 negatively regulates ferroptosis.
a-d LIFR-knockdown (a, b) or SHP1-knockdown (c, d) HT1080 cells were treated with 10 μM erastin for 0, 5, or 10 h. a, c: staining of 7-aminoactinomycin (7-AAD) and annexin V. b, d: the percentage of annexin V and 7-AAD double-negative population. e The percentage of annexin V and 7-AAD double-negative population in LIFR-knockdown HT1080 cells treated with 0.5 μM RSL3 for 12 h, 50 μM FIN56 for 6 h, or 10 μM FINO2 for 24 h. Supplementary Figure 6e shows representative flow cytometry plots. f The percentage of annexin V and 7-AAD double-negative population in SHP1-knockdown HT1080 cells treated with 0.5 μM RSL3 for 12 h, 50 μM FIN56 for 6 h, or 10 μM FINO2 for 24 h. Supplementary Figure 6f shows representative flow cytometry plots. g The percentage of annexin V and 7-AAD double-negative population in LCN2-knockdown HT1080 cells treated with 10 μM erastin for 0, 4, or 8 h, alone or in combination with liproxstatin-1 (lip-1, 10 μM) or DFO (100 μM). Supplementary Figure 7b shows representative flow cytometry plots. h The percentage of annexin V and 7-AAD double-negative population in LCN2-knockdown HT1080 cells treated with 0.5 μM RSL3 for 10 h, 50 μM FIN56 for 3 h, or 10 μM FINO2 for 12 h, alone or in combination with liproxstatin-1 (lip-1, 10 μM) or DFO (100 μM). Supplementary Fig. 7c shows representative flow cytometry plots. i, j Lipid peroxidation levels in LIFR-knockdown (i) and SHP1-knockdown (j) HT1080 cells treated with 10 μM erastin for 3 h or 0.5 μM RSL3 for 4 h. k Lipid peroxidation levels in LCN2-knockdown HT1080 cells treated with 10 μM erastin for 3 h or 0.5 μM RSL3 for 4 h, alone or in combination with liproxstatin-1 (10 μM) or DFO (100 μM). Lipid peroxidation levels were gauged by C11-BODIPY staining in ik. Statistical significance in b and dk was determined by a two-tailed unpaired t-test. Error bars are s.e.m. n = 3 samples per group. Source data are provided as a Source Data file.
Fig. 6
Fig. 6. LCN2 mediates ferroptosis resistance and is a therapeutic target for enhancing sorafenib efficacy.
a qPCR of Lifr and Lcn2 in Lifr-knockout PHM cells transduced with the scrambled (Scr) or Lcn2 shRNA. n = 3 samples. b Lifr-knockout PHM cells were transduced with Lcn2 shRNA and treated with 10 µM erastin or 20 µM sorafenib. Cell viability was determined by a CCK8 assay. n = 5 wells. c Fe2+ levels in liver tissues of Lifrfl/fl and Lifrfl/fl;Alb-Cre mice in the absence or presence of hydrodynamic injection of plasmids expressing the Sleeping Beauty transposase, myrAKT, and RasV12. n = 4 mice. d Fe2+ levels in control and Lifr-knockout PHM cells transduced with the scrambled (Scr) or Lcn2 shRNA. n = 3 wells. e Malondialdehyde (MDA) levels in control and Lifr-knockout PHM cells transduced with the scrambled (Scr) or Lcn2 shRNA. n = 5 wells. f Glutathione (GSH) levels in control and Lifr-knockout PHM cells transduced with the scrambled (Scr) or Lcn2 shRNA. n = 3 wells. g Immunoblotting of Lifr, Slc7a11, Fsp1, Gpx4, and Gapdh in control and Lifr-knockout PHM cells transduced with the scrambled (Scr) or Lcn2 shRNA. h Immunoblotting of LCN2, LIFR, p-p65, p65, and GAPDH in tumors generated from four PDX lines of HCC. i ELISA of lipocalin 2 in the serum collected from NSG mice bearing PDX line #5. Mice were treated with anti-LCN2 and sorafenib, alone or in combination. n = 7 mice. j, k Growth curves of tumors in NSG mice bearing PDX line #4 (j) or #5 (k). When tumors grew to 50–150 mm3, mice were treated with 100 μg anti-LCN2 and 30 mg kg−1 sorafenib, alone or in combination. The treatments were given 6 days a week for 4 weeks. Statistical significance was determined by a two-way ANOVA. n = 6 mice in j and n = 7 mice in k. l Endpoint tumor images of the mice described in j and k. Statistical significance in bf and i was determined by a two-tailed unpaired t-test. Error bars are s.e.m. Source data are provided as a Source Data file.
Fig. 7
Fig. 7. An LCN2-neutralizing antibody enhances the ferroptosis-inducing effect of sorafenib on HCC patient-derived xenograft tumors with low LIFR expression and high LCN2 expression.
a, b Quantification of immunohistochemical staining (IHC, see images in Supplementary Fig. 9a) of MDA (a) and 4-HNE (b) in tumor tissues from NSG mice bearing PDX line #5. Mice were treated with anti-LCN2 and sorafenib, alone or in combination. n = 7 mice. Statistical significance was determined by a one-way ANOVA (to compare the means among three or more groups) and a two-tailed unpaired t-test (to compare the means between two groups). Error bars are s.e.m. c, d Transmission electron microscopy images of tumor tissues from NSG mice bearing PDX line #5 (c) or #4 (d). Mice were treated with anti-LCN2 and sorafenib, alone or in combination. Blue arrows indicate normal mitochondria. Red arrows indicate shrunken mitochondria with heavily condensed membrane, and pink arrows indicate mitochondria with increased membrane density, but to a lesser extent than those indicated by red arrows. Scale bars, 500 nm. e Model for the role of a LIFR−NF-κB−LCN2 axis in liver tumorigenesis and ferroptosis. Source data are provided as a Source Data file.

References

    1. Jemal, A. et al. Annual report to the nation on the status of cancer, 1975−2014, featuring survival. J. Natl Cancer Inst.109, djx030 (2017). - PMC - PubMed
    1. Villanueva A. Hepatocellular Carcinoma. N. Engl. J. Med. 2019;380:1450–1462. - PubMed
    1. Roayaie S, et al. The role of hepatic resection in the treatment of hepatocellular cancer. Hepatology. 2015;62:440–451. - PubMed
    1. Mazzaferro V, et al. Liver transplantation for the treatment of small hepatocellular carcinomas in patients with cirrhosis. N. Engl. J. Med. 1996;334:693–699. - PubMed
    1. Schulze K, Nault JC, Villanueva A. Genetic profiling of hepatocellular carcinoma using next-generation sequencing. J. Hepatol. 2016;65:1031–1042. - PubMed

Publication types

MeSH terms