. 2021 Dec 17;12(1):7336.
doi: 10.1038/s41467-021-27607-8.

Heterocellular OSM-OSMR signalling reprograms fibroblasts to promote pancreatic cancer growth and metastasis

Affiliations

Heterocellular OSM-OSMR signalling reprograms fibroblasts to promote pancreatic cancer growth and metastasis

Brian Y Lee et al. Nat Commun. .

Abstract

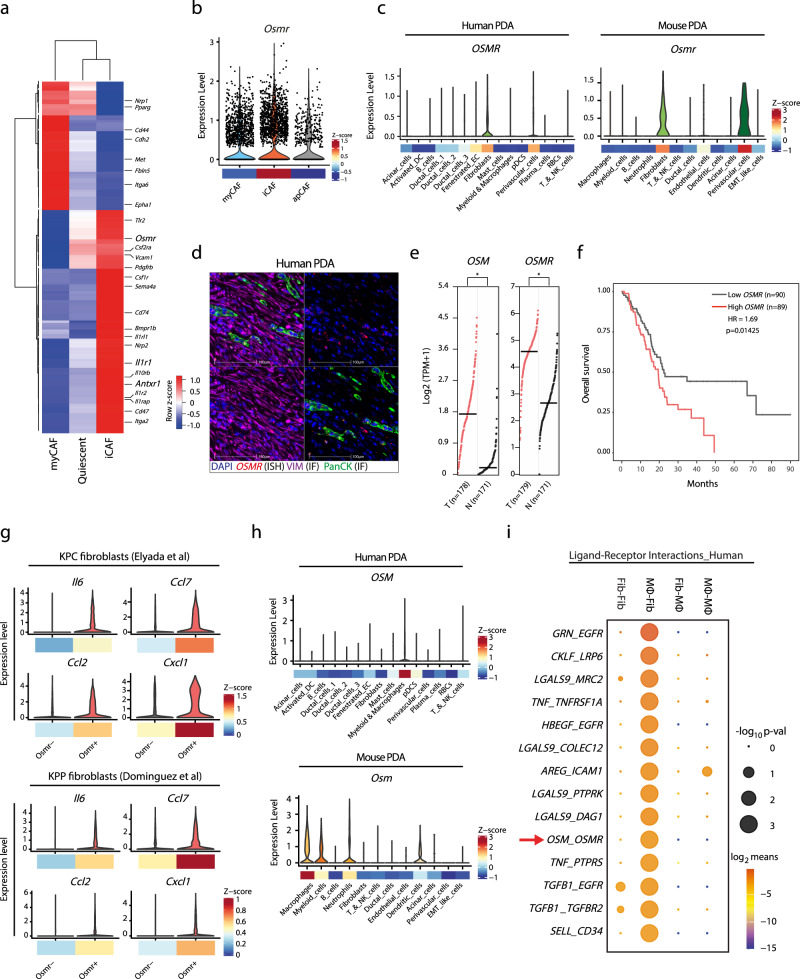
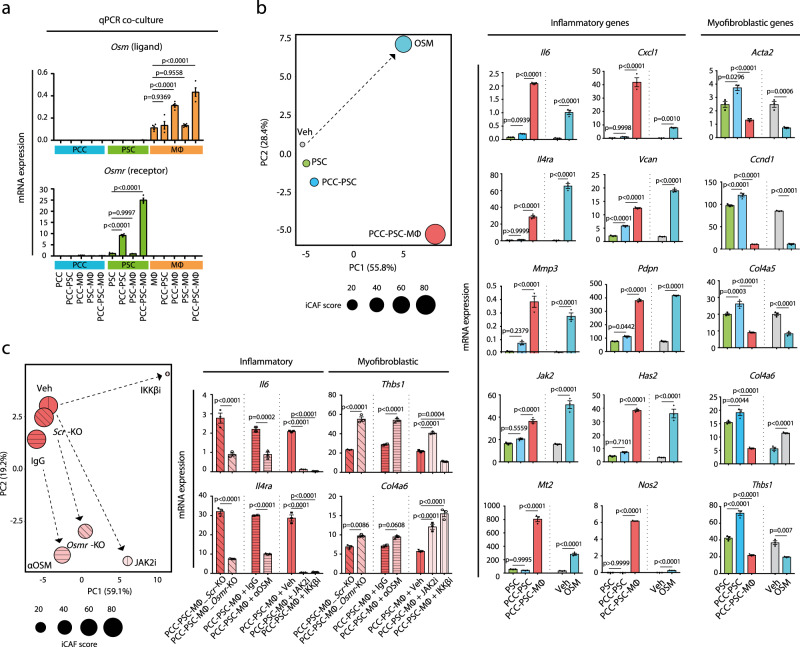
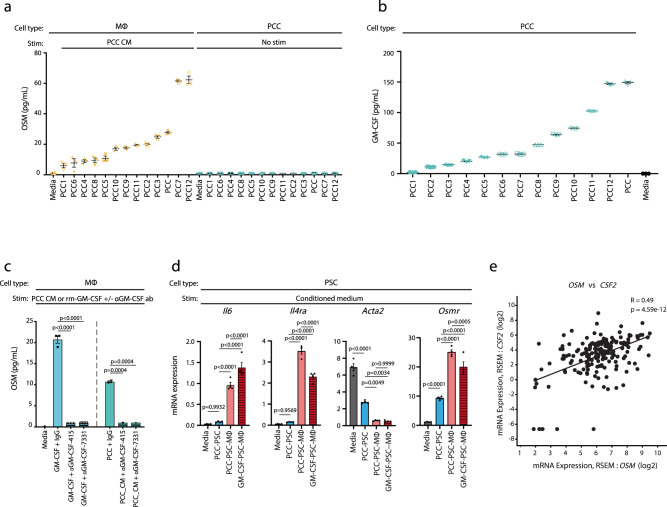
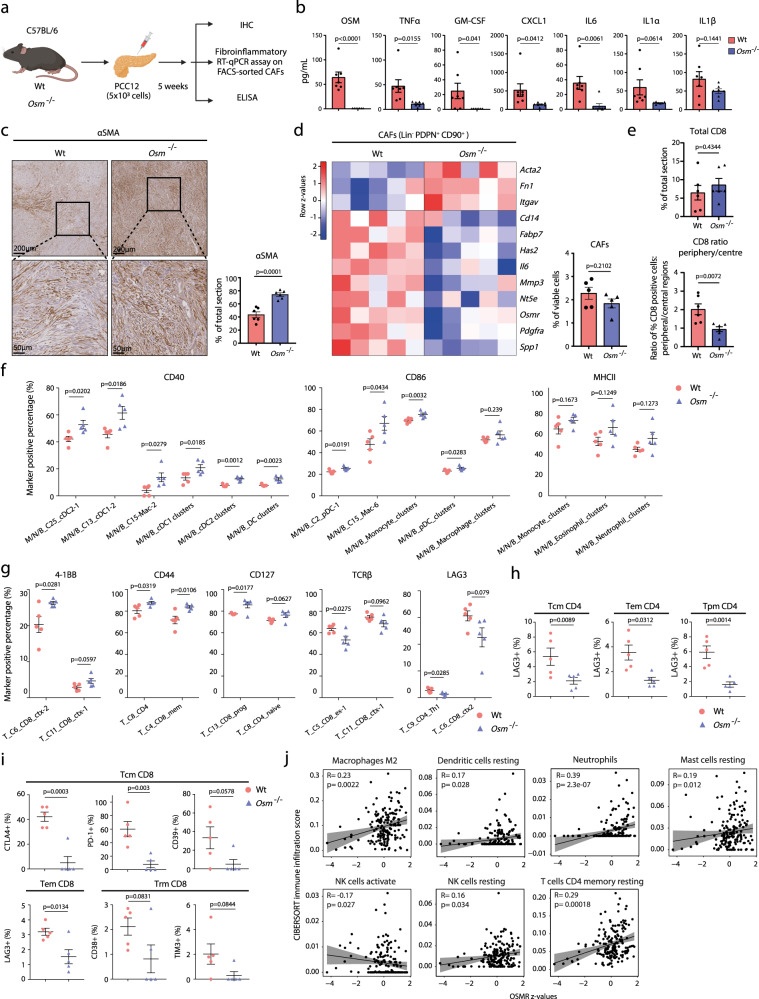
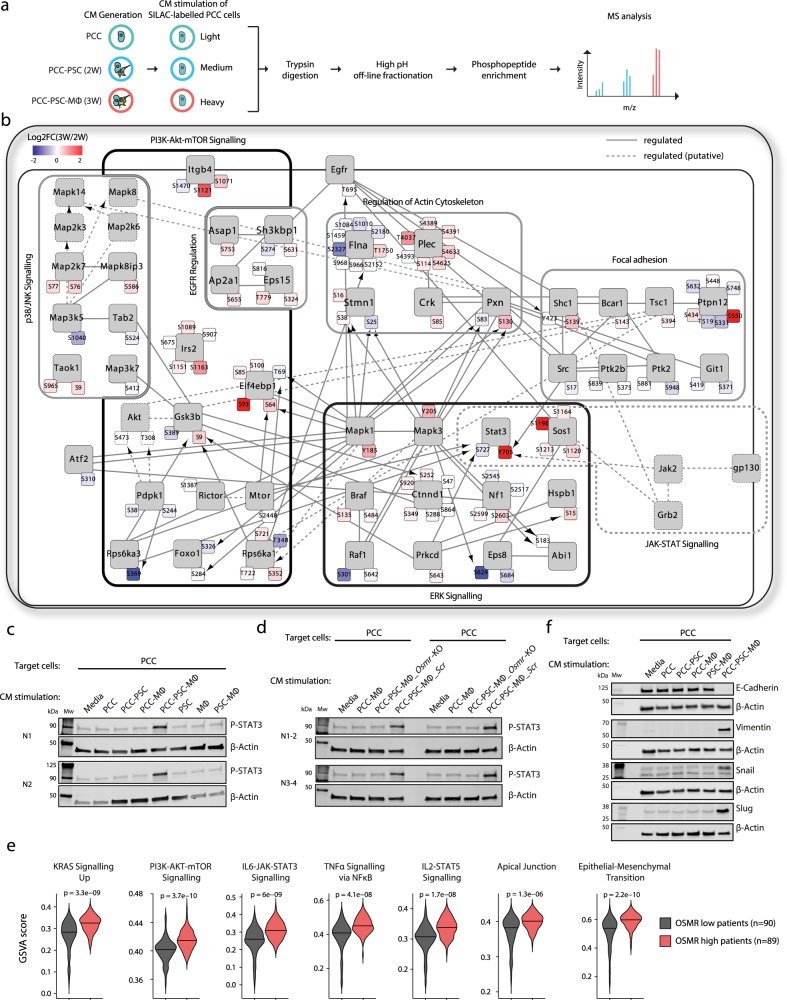
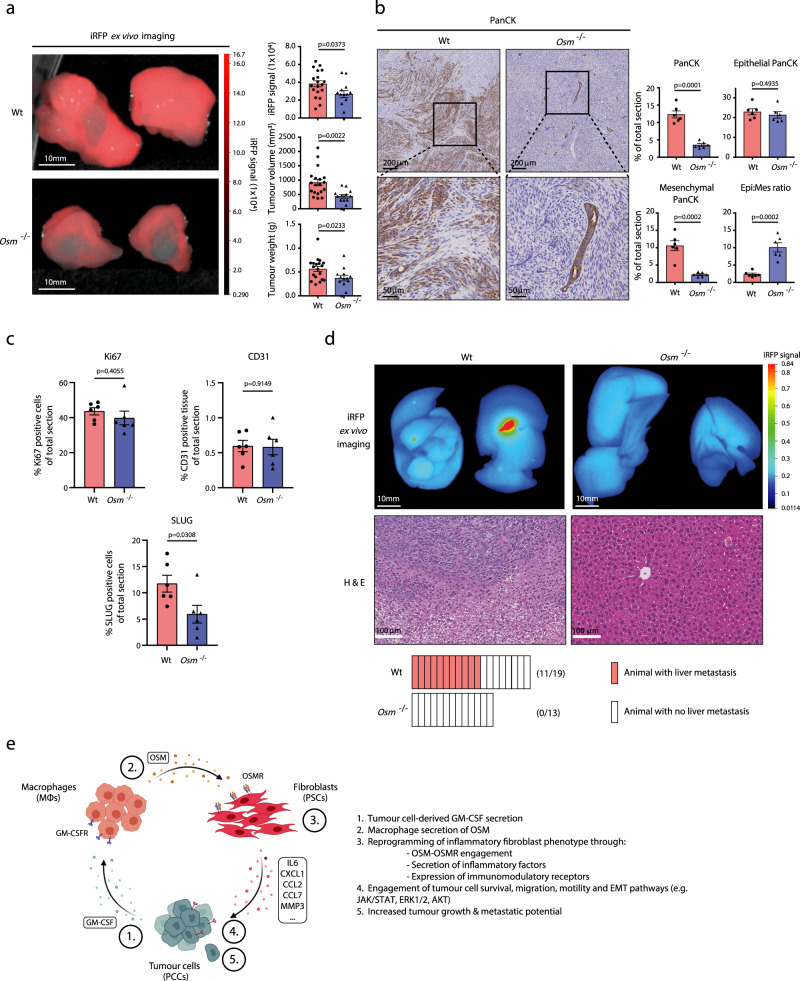
Pancreatic ductal adenocarcinoma (PDA) is a lethal malignancy with a complex microenvironment. Dichotomous tumour-promoting and -restrictive roles have been ascribed to the tumour microenvironment, however the effects of individual stromal subsets remain incompletely characterised. Here, we describe how heterocellular Oncostatin M (OSM) - Oncostatin M Receptor (OSMR) signalling reprograms fibroblasts, regulates tumour growth and metastasis. Macrophage-secreted OSM stimulates inflammatory gene expression in cancer-associated fibroblasts (CAFs), which in turn induce a pro-tumourigenic environment and engage tumour cell survival and migratory signalling pathways. Tumour cells implanted in Osm-deficient (Osm-/-) mice display an epithelial-dominated morphology, reduced tumour growth and do not metastasise. Moreover, the tumour microenvironment of Osm-/- animals exhibit increased abundance of α smooth muscle actin positive myofibroblasts and a shift in myeloid and T cell phenotypes, consistent with a more immunogenic environment. Taken together, these data demonstrate how OSM-OSMR signalling coordinates heterocellular interactions to drive a pro-tumourigenic environment in PDA.


Conflict of interest statement

The authors declare no competing interests. J.X. is currently an employee of GlaxoSmithKline and B.L. is currently an employee of AstraZeneca, but all the work carried out by J.X. and B.L. were performed during their time at CRUK Manchester Institute, the University of Manchester.

Figures

Fig. 1
Fig. 1. OSMR expression is associated with tumour-promoting inflammation and poor outcome in PDA.
a Heatmap displaying relative expression levels of membrane receptors of stellate cells adopting a quiescent, inflammatory cancer-associated fibroblasts (iCAF), or myofibroblastic CAF (myCAF) phenotype (dataset: GSE93313). b Violin plot of normalised Osmr expression levels in myCAF, iCAF, and apCAFs in murine PDA (dataset: GSE129455) with mean expression z-scores shown below. c Violin plots of normalised OSMR/Osmr expression levels for individual cell types in human (left) and murine (right) PDA (top) and mean expression z-scores shown below (datasets: GSE129455, phs001840.v1.p1). d Representative in situ mRNA hybridisation (ISH) of OSMR multiplexed with immunofluorescence of VIM and PanCK in human PDA (n = 3). 20× magnification. Upper left quadrant, full overlay; upper right, OSMR; lower left, OSMR with VIM; lower right, OSMR with PanCK. Scale bar = 100 μm. e OSM (left) and OSMR (right) expression in human PDA (TCGA PanCancer PAAD dataset, n = 178) and normal pancreatic tissue (GTEx, n = 171). Mantel–Cox test. T tumour, N normal, TPM transcripts per million. f Kaplan–Meier survival curves showing overall survival of 179 PDA patients from TCGA PanCancer PAAD dataset. Patients were stratified by high (Top 50%, n = 89) and low (bottom 50%, n = 90) OSMR expression levels. Analysis by log-rank test and cox-proportional hazard regression. HR hazard ratio. g Violin plots of inflammatory gene expression in Osmrpos and Osmrneg CAFs in murine PDA tumours (datasets: GSE129455, MTAB-8483) with mean expression z-scores shown below. h Violin plots of normalised OSM/Osm expression across cell types of human (top) and murine (bottom) PDA (datasets: GSE129455, phs001840.v1.p1). Mean expression z-scores shown. i Top 14 predicted interactions between macrophage-derived ligands and fibroblast expressed receptors using CellPhoneDB receptor–ligand interaction statistical analysis (p-values < 0.05). Also see Supplementary Fig. 1. Source data are provided as a Source Data file.
Fig. 2
Fig. 2. Macrophage–tumour cell interactions induce inflammatory fibroblasts in vitro.
a Heatmap showing relative levels of soluble signals quantified by LUMINEX, clustered with unsupervised hierarchical clustering (n = 3 per culture condition). b Heatmap of relative expression levels of soluble signals measured by RT-qPCR, clustered with unsupervised hierarchical clustering (n = 4 per culture condition). c Volcano plot showing differentially regulated genes (DEGs) of PSCs isolated from PCC–PSC (n = 4) and PCC–PSC–MØ (n = 4) co-cultures. 3 W: PCC–PSC–MØ co-culture. 2 W: PCC–PSC co-culture. FC fold change. d Gene set enrichment analysis (GSEA) of RNAseq data from (c). NES normalised enrichment score, FDR false discovery rate. e RT-qPCR assay of selected myofibroblastic and inflammatory genes of PSCs stimulated with conditioned medium from 2 or 3 W co-cultures using different isolations of PCCs (PCC, PCC4 and PCC11). Left: Changes in expression state visualised by principle component analysis (PCA) across experimental conditions (n = 4). Right: Representative mRNA expression of inflammatory (Il6, Il4ra and Cxcl1) and myofibroblastic (Acta2) genes. Results displayed as mean ± SEM, n = 4, one-way ANOVA Tukey test. f RT-qPCR of selected myofibroblastic and inflammatory genes in PSCs stimulated with conditioned medium from 1, 2 or 3 W co-cultures of PCC, PSC and bone marrow-derived MØs. Left: Changes in expression state visualised by PCA plot across experimental conditions (n = 4). Right: Representative mRNA expression of inflammatory (Il6, Il4ra and Cxcl1) and myofibroblastic (Acta2) genes. Results displayed as mean ± SEM, n = 4, one-way ANOVA Tukey test. g Mass cytometry analysis of PSCs in mono- (n = 3) and co-culture with PCC (n = 3) or PCC and MØs (n = 3). Self-organising map clustering (FlowSOM) of PSCs in mono- and co-cultures displayed as t-Distributed Stochastic Neighbour Embedding (tSNE). h Mass cytometry analysis of PSCs from 3 W PCC–PSC–MØ co-culture. Number of macrophages plated in 3 W co-culture was titrated down and PDPN, CD73 and Integrin α5 expression levels shown as biaxial plots. Also see Supplementary Fig. 2. Source data are provided as a Source Data file.
Fig. 3
Fig. 3. Heterocellular OSM–OSMR signalling induces inflammatory fibroblasts.
a Cell-type-specific mRNA expression of Osm and Osmr across different culture conditions in vitro. Results displayed as mean ± SEM, n = 4, one-way ANOVA Tukey test. b RT-qPCR assay of myofibroblastic and inflammatory genes. PSCs were treated with recombinant OSM, conditioned medium or vehicle control, and gene expression analysis was performed. Left: Changes in expression state visualised by PCA. iCAF score is a sum of mean z-values of 15 selected inflammatory genes. Right: Representative mRNA expression of inflammatory and myofibroblastic genes of PSCs treated as indicated. Results displayed as mean ± SEM, n = 3, one-way ANOVA Tukey test. c RT-qPCR analysis of myofibroblastic and inflammatory genes in PSCs following pharmacological inhibitors and CRISPR–Cas9-medidated Osmr knockout (Osmr-KO) in PSCs. For inhibitor perturbation, PSCs were stimulated with conditioned medium supplemented with vehicle control, IKKβ inhibitor (TPCA-1, 1 µM), JAK2 inhibitor (AZD1480, 2.5 µM), control IgG antibody (2.5 ng/mL) or neutralising OSM antibody (αOSM, 2.5 ng/mL). For Osmr knockout, scrambled (Scr) control and Osmr-KO fibroblasts were stimulated with PCC–PSC–MØ conditioned medium and gene expression was analysed by RT-qPCR. Left: Changes in expression state visualised by a PCA plot. iCAF score is a sum of mean z-values of 15 selected inflammatory genes. Right: Representative mRNA expression of inflammatory (Il6 and Il4ra) and myofibroblastic (Thbs1 and Col4a6) genes of PSCs treated as indicated. Results displayed as mean ± SEM, n = 3, one-way ANOVA Tukey test. Also see Supplementary Fig. 3. Source data are provided as a Source Data file.
Fig. 4
Fig. 4. Tumour cell-secreted GM-CSF increases macrophage secretion of OSM.
a Quantification of OSM levels in conditioned medium from bone-marrow-derived MØs stimulated with conditioned medium from PCC lines. Results displayed as mean ± SEM, n = 3. CM conditioned medium. b Quantification of GM-CSF levels in conditioned medium of PCC cell lines. Results displayed as mean ± SEM, n = 3. c Quantification of OSM levels in conditioned medium of bone-marrow-derived MØs stimulated with either recombinant murine GM-CSF (rm-GM-CSF) or PCC conditioned medium in the presence of neutralising GM-CSF antibodies (αGM-CSF-415, 1 µg/mL and αGM-CSF-7331, 1 µg/mL) or control. Results displayed as mean ± SEM (n = 3), one-way ANOVA Tukey test. d RT-qPCR assay of selected genes in PSCs stimulated with conditioned medium from 2 W (PCC–PSC) or 3 W co-cultures (PCC–PSCs–bone marrow-derived MØs) where recombinant murine GM-CSF substitutes for PCCs in the 3 W culture. Results displayed as mean ± SEM (n = 4), one-way ANOVA Tukey test. e Scatter plot of OSM (x-axis) and CSF2 (y-axis) expression levels in PDA patients (TCGA PAAD dataset, n = 179, two-tailed Spearman correlation test). RSEM RNA-seq by expectation-maximisation. Also see Supplementary Fig. 4. Source data are provided as a Source Data file.
Fig. 5
Fig. 5. OSM supports the formation of an immunosuppressive microenvironment.
a Experimental workflow of in vivo experiments. b Protein levels of indicated soluble signals in wildtype (n = 7) and Osm−/ (n = 7) tumours, measured by ELISA. Results displayed as mean ± SEM, two-tailed student t test. c Immunohistochemical analysis of αSMA in wildtype and Osm−/ tumour sections. Left: Representative αSMA staining. Right: Quantification of αSMApos staining of tumour sections of wildtype (n = 6) and Osm−/− (n = 6) animals. Results displayed as mean ± SEM, two-tailed student t test. d RT-qPCR gene expression analysis of FACS-isolated CAFs from wildtype (n = 5) and Osm−/− (n = 5) tumours displayed as a heatmap (left). Number of isolated CAFs shown as bar plot (right). Results displayed as mean ± SEM, two-tailed student t test. e Immunohistochemical analysis of CD8 in wildtype (n = 6) and Osm−/− (n = 6) animals. Upper: Total CD8pos staining. Lower: Ratio of peripheral/central CD8pos staining using the mean CD8pos stain from four representative peripheral regions and four representative central regions per tumour. Results displayed as mean ± SEM, two-tailed student t test. f Mass cytometry analysis quantifying abundance of antigen presenting cells (APCs) expressing co-stimulatory markers in wildtype (n = 5) and Osm−/− (n = 5) tumours. Results displayed as mean ± SEM. Unpaired two-tail student t test. g Mass cytometry analysis of CD45+/CD3+ T cells expressing indicated markers in wildtype (n = 5) and Osm−/− (n = 5) tumours. Results displayed as mean ± SEM, two-tailed student t test. h, i Mass cytometry analysis of memory T cells expressing indicated exhaustion/dysfunction markers in wildtype (n = 5) and Osm−/− (n = 5) tumours. Results displayed as mean ± SEM, two-tailed student t test. Tcm central memory, Tem effector memory, Trm resident memory. j Spearman correlation analysis between infiltration of indicated immune cells (determined by CIBERSORT) and OSMR expression levels in PDA patients from TCGA PanCancer PAAD dataset (n = 179). 95% confidence interval as shaded area. Also see Supplementary Figs. S5 and S6. Source data are provided as a Source Data file.
Fig. 6
Fig. 6. PCC–PSC–MØ interactions reshape tumour cell signalling.
a Experimental workflow outlining SILAC-based phosphoproteomics analysis of stroma-regulated tumour cell signalling. “Light” (L), “Medium” (M) and “Heavy” (H) labelled PCCs were stimulated (5 min) with PCC or PCC–PSC or PCC–PSC–MØ conditioned medium, respectively (n = 5). Pooled L/M/H peptides (in a 1:1:1 ratio) were fractionated, phospho-peptides enriched and analysed by LC–MS/MS. b PhosphoPath phospho-network analysis summarising PCC–PSC–MØ-regulated tumour cell signalling, relative to PCC–PSC-regulated signals (p < 0.05, Fisher exact test with Benjamini–Hochberg multiple testing correction). Arrows indicate kinase-substrate relationships and blunt-ended edges indicate protein–protein interactions. c Western blots of phosho-STAT3 levels in PCCs treated with conditioned medium from 1, 2 or 3 W co-cultures (n = 2). d Western blots of phosho-STAT3 levels in PCCs treated with conditioned medium from 2 W or 3 W co-cultures containing either Osmr-KO or Scr-PSCs (n = 4). e Single-sample gene set enrichment analysis (ssGSEA) of PDA patients from TCGA PanCancer PAAD dataset (n = 179). Patients were stratified into OSMRhigh (n = 89) and OSMRlow (n = 90) groups. f Representative western blot of EMT markers in PCCs treated with conditioned medium from 1, 2, or 3 W co-cultures; E-cadherin, Vimentin, SNAIL, and SLUG (n = 3). Also see Supplementary Fig. 7. Source data are provided as a Source Data file.
Fig. 7
Fig. 7. OSM drives tumour growth and metastasis in vivo.
a Left: Representative iRFP imaging of resected pancreatic tumours from orthotopically transplanted immune-competent wildtype (Wt) (n = 19) and Osm−/− (n = 13) mice. Right: Quantification of iRFP signal intensity, tumour volume and tumour weight. Results displayed as mean ± SEM (Wt, n = 19 and Osm−/− n = 13), two-tailed student t test. b Left: Representative Pan-Cytokeratin (PanCK) staining of wildtype and Osm−/− tumour sections. Right: Quantification of total PanCKpos staining, mesenchymal PanCKpos staining, and epithelial PanCKpos staining following morphology analysis, and the epithelial–mesenchymal PanCKpos ratio in tumour sections from wildtype (n = 6) and Osm−/− (n = 6) mice. A shift of PanCKpos cells from a mixed mesenchymal and epithelial morphology in wildtype tumours to a more epithelial-dominant morphology in Osm−/− animals. Results displayed as mean ± SEM, two-tailed student t test. c Quantification of total Ki67,pos CD31pos, and SLUGpos immunohistochemical staining of tumour sections from wildtype (n = 6) and Osm−/− (n = 6) mice. Results displayed as mean ± SEM, two-tailed student t test. d Upper: Representative iRFP in vivo imaging (top) and haematoxylin and eosin staining (bottom) of resected livers from wildtype and Osm−/− mice. Lower: Quantification of iRFPpos liver metastasis incidents in wildtype (n = 11/19) and Osm−/− (n = 0/13) animals. e Model outlining heterocellular OSM–OSMR signalling between pancreatic cancer cells, fibroblasts and macrophages. Pancreatic cancer cell secretion of GM-CSF induces macrophage secretion of OSM, which reprograms fibroblasts to an inflammatory phenotype, in turn accentuating tumour growth and metastasis. Also see Supplementary Fig. 8. Source data are provided as a Source Data file.

References

    1. Biankin AV, et al. Pancreatic cancer genomes reveal aberrations in axon guidance pathway genes. Nature. 2012;491:399–405. - PMC - PubMed
    1. Helms, E., Onate, M. K. & Sherman, M. H. Fibroblast heterogeneity in the pancreatic tumor microenvironment. Cancer Discov. 10.1158/2159-8290.CD-19-1353 (2020). - PMC - PubMed
    1. Algül H, Treiber M, Lesina M, Schmid RM. Mechanisms of disease: chronic inflammation and cancer in the pancreas—a potential role for pancreatic stellate cells? Nat. Clin. Pract. Gastroenterol. Hepatol. 2007;4:454–462. - PubMed
    1. Clark CE, et al. Dynamics of the immune reaction to pancreatic cancer from inception to invasion. Cancer Res. 2007;67:9518–9527. - PubMed
    1. Bayne LJ, et al. Tumor-derived granulocyte-macrophage colony-stimulating factor regulates myeloid inflammation and T cell immunity in pancreatic cancer. Cancer Cell. 2012;21:822–835. - PMC - PubMed

Publication types

MeSH terms

Substances