. 2022 May;227(4):1227-1245.
doi: 10.1007/s00429-021-02427-0. Epub 2021 Dec 17.

The retrocalcarine sulcus maps different retinotopic representations in macaques and humans

Affiliations

The retrocalcarine sulcus maps different retinotopic representations in macaques and humans

Michael J Arcaro et al. Brain Struct Funct. 2022 May.

Abstract

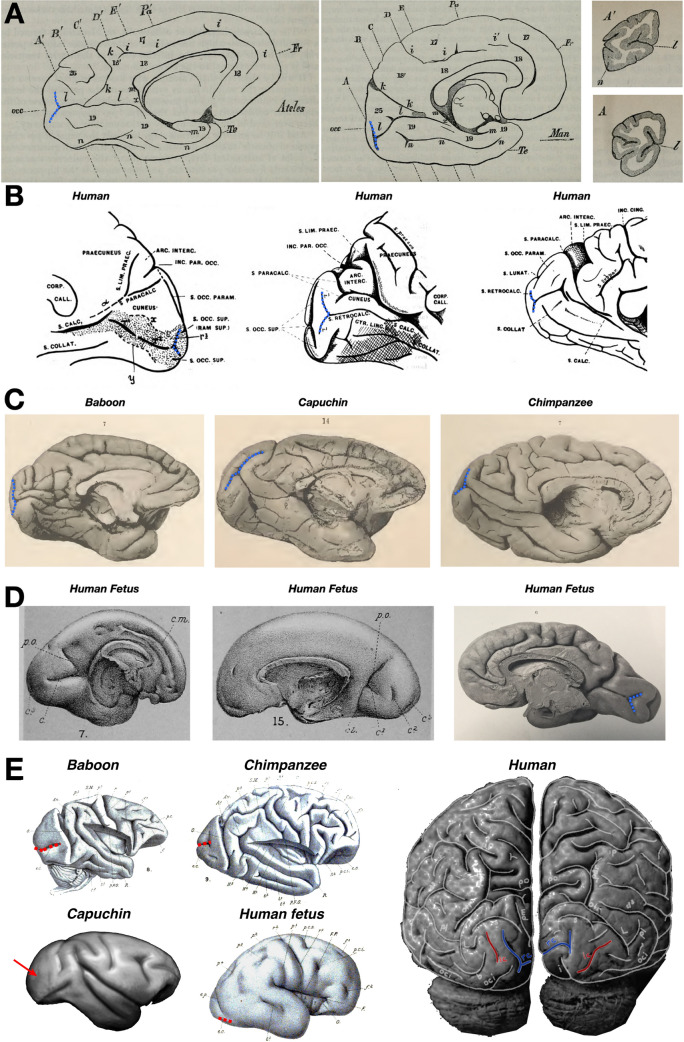
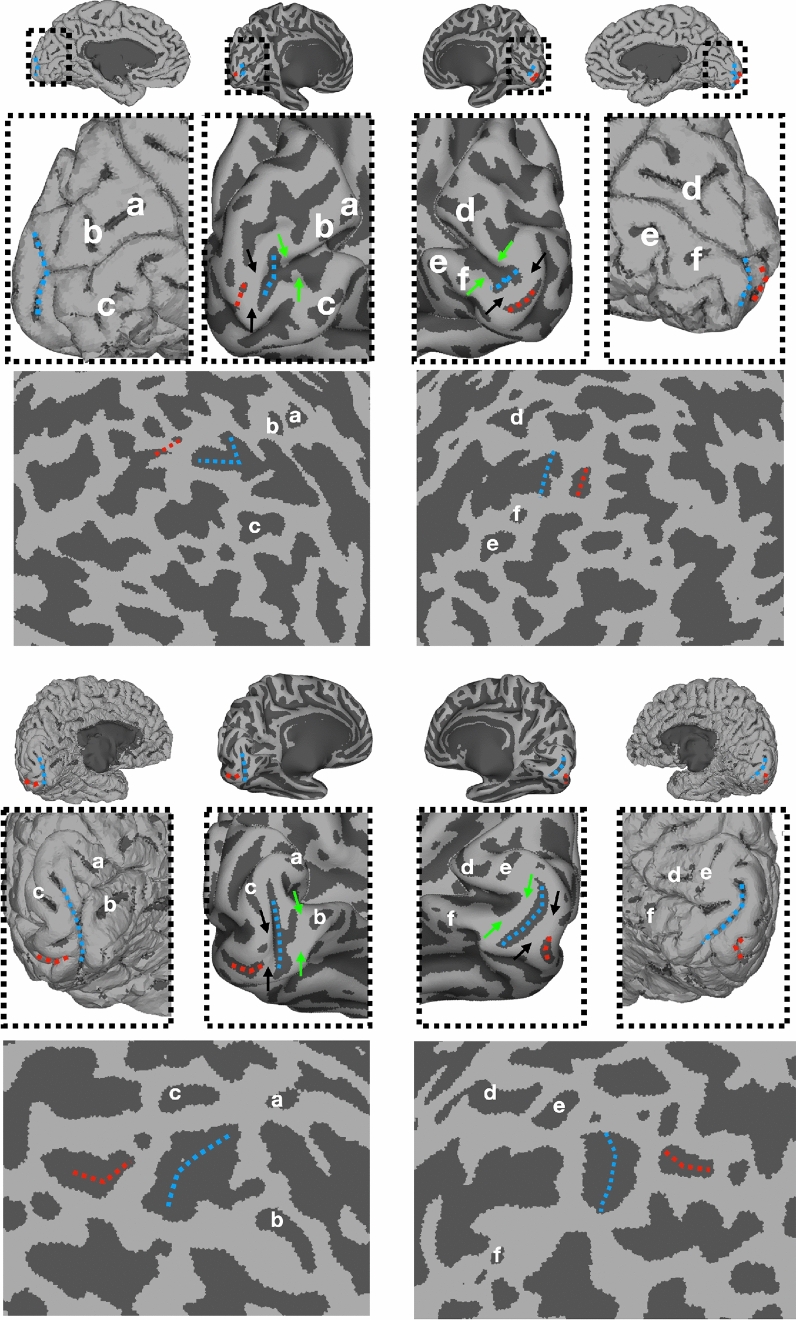
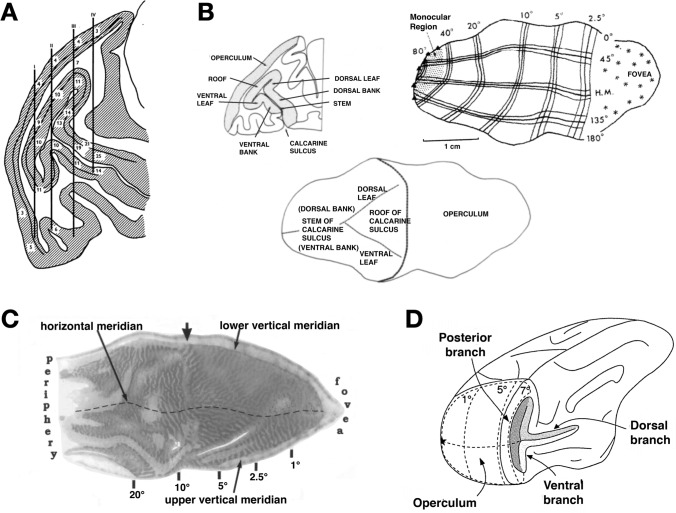
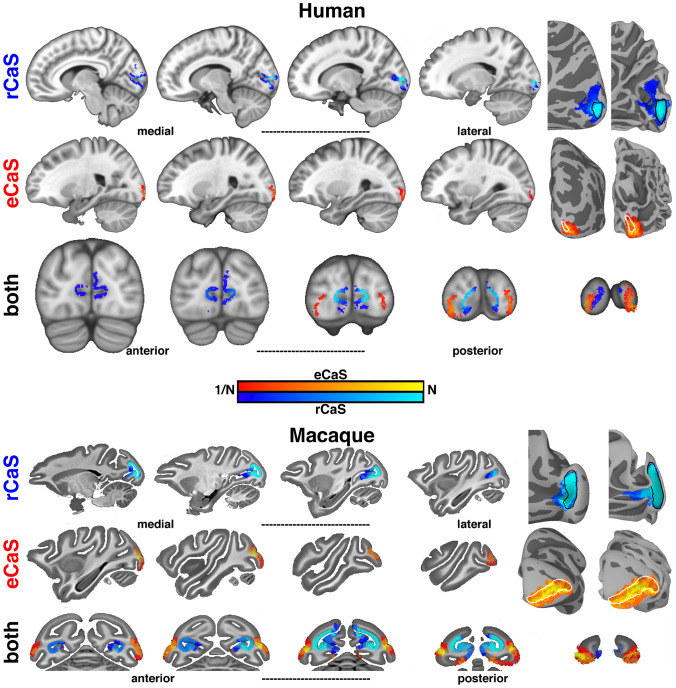
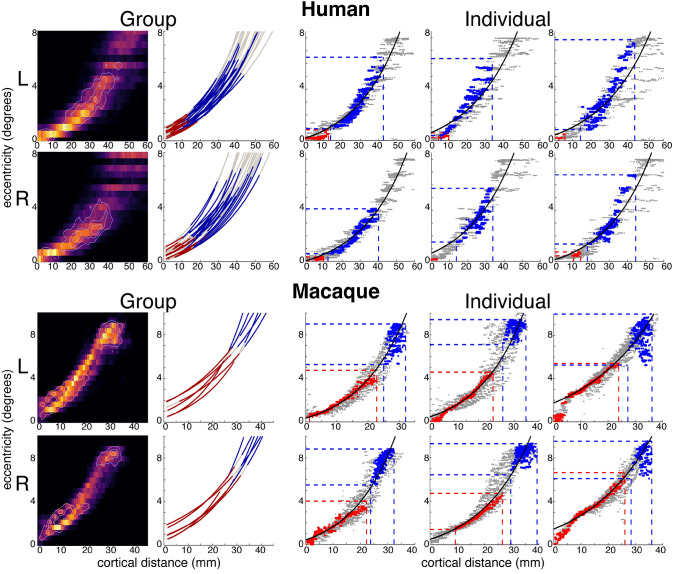
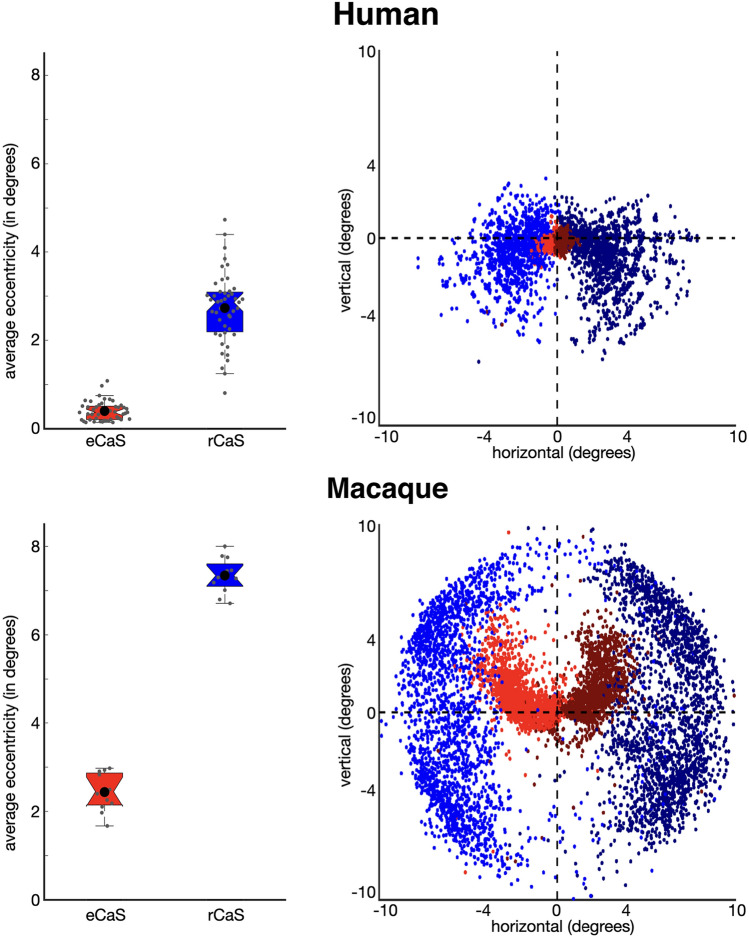
Primate cerebral cortex is highly convoluted with much of the cortical surface buried in sulcal folds. The origins of cortical folding and its functional relevance have been a major focus of systems and cognitive neuroscience, especially when considering stereotyped patterns of cortical folding that are shared across individuals within a primate species and across multiple species. However, foundational questions regarding organizing principles shared across species remain unanswered. Taking a cross-species comparative approach with a careful consideration of historical observations, we investigate cortical folding relative to primary visual cortex (area V1). We identify two macroanatomical structures-the retrocalcarine and external calcarine sulci-in 24 humans and 6 macaque monkeys. We show that within species, these sulci are identifiable in all individuals, fall on a similar part of the V1 retinotopic map, and thus, serve as anatomical landmarks predictive of functional organization. Yet, across species, the underlying eccentricity representations corresponding to these macroanatomical structures differ strikingly across humans and macaques. Thus, the correspondence between retinotopic representation and cortical folding for an evolutionarily old structure like V1 is species-specific and suggests potential differences in developmental and experiential constraints across primates.

Keywords: Calcarine sulcus; Comparative neuroanatomy; Human; Macaque; Striate cortex; Vision.


Conflict of interest statement

The authors declare that they have no conflict of interest.

Figures

Fig. 1
Fig. 1
The retrocalcarine sulcus (rCaS) in the primate occipital cortex and in utero. A In the first labeling of the calcarine sulcus (CaS; l in each image) in 1861, Sir Thomas Huxley referred to the fact that there was a bifurcation (dotted blue line) in the posterior extent toward the occipital pole in both spider monkeys (Ateles; left) and humans (middle). Right: Coronal sections from Ateles (top; A’) and humans (bottom; A) in which the bifurcated portion of the posterior calcarine sulcus was described by Huxley. Images adapted from Huxley (1861). B Shortly after Huxley’s seminal observations, several labels were proposed for this posterior bifurcation of the CaS. For example, in a series of papers, Smith referred to this sulcus with several names such as sulcus retrocalcarinus verticalis (Smith 1902), the retrocalcarine sulcus (Smith 1904a), the sulcus occipitalis intrastriatus mesialis (retrocalcarinus) (Smith 1904b), or simply as r3 as depicted in the two leftmost images. Images adapted from Smith (1904a). C The rCaS (dotted blue line) is identifiable in several species included in the classic atlas by Retzius (1906). Left to right: baboon, capuchin, and chimpanzee. Images adapted from Retzius (1906). D Left and middle: drawings of two separate brains from early (left) or the middle (middle) of the 5th month of development. Cunningham referred to the rCaS as the posterior calcarine sulcus (c3 in the images). Images Adapted from Cunningham (1892). Right: A photograph of a human fetal brain from Retzius (1896). The rCaS (dotted blue) is easily identifiable, as is the external calcarine (eCaS; unlabeled), which is posterior to the rCaS. Images adapted from Retzius (1896). E The eCaS (dotted red line) is identifiable in several primate species in the atlas by Cunningham (1892) including baboons, chimpanzees, and humans. The external calcarine has not been identified in Capuchins, though a dimple is commonly found on the lateral surface in the approximate location where the external calcarine is found in Old World Monkeys (red arrow). The lack of a clear external calcarine, but presence of the retrocalcarine, in Capuchin monkeys indicates that these sulci emerged over different evolutionary timescales. Posterior view of adult human brain (Connolly 1950) shows the locations of both external and retrocalcarine sulci in red and blue lines, respectively
Fig. 2
Fig. 2
The rCaS is difficult to identify in flattened and inflated cortical surface visualizations. Medial views of the pial, partially inflated, and spherical surfaces from the left and right hemispheres of two example participants. HCP IDs: 690152 (top) and 145834 (bottom) randomly chosen from the 181 human participants included in the HCP 7 T Retinotopy Dataset (HCP7TRET; Benson et al. 2018). The labeling of sulci a-c and d-f in the left and right hemispheres, respectively, is aimed to guide the reader in identifying corresponding sulci across views. While the rCaS (dotted blue) is clearly visible on the pial surface, the flattening process often distorts the clear bifurcated morphology of the rCaS, which makes it hard to discriminate from the rest of the calcarine or the external calcarine sulci (red dotted lines). Arrows on partially inflated surfaces indicate previously identified “rungs,” or annectant gyri, across the calcarine by Schira and colleagues (2012) in which each rung has a predictable relationship with eccentricity. For example, the black arrows just anterior to the eCaS predict about 0.5° and the green arrows just anterior to the rCaS predict about 5° according to Schira and colleagues, which is consistent with our data (Figs. 5, 6 and 7)
Fig. 3
Fig. 3
Mushrooms, roofs, leaves, hinges, and branches: eccentricity and the rCaS in non-human primates. A A drawing from Daniel and Whittredge (1961) of a baboon’s brain. Needle tracks (vertical black lines) are depicted relative to cortical locations that reflect the preferred neuronal firing to spots of light at a particular radial distance from the fixation point (numbers). The authors refer to the rCaS as a “mushroom” in which they write: “In sagittal section the calcarine cortex has the shape of a mushroom, with a ‘head’ and a ‘stem’. In sections further from the midline the 'head' gets smaller, and the most lateral sections show a ‘stem’ only, frequently cut obliquely (P1. 1; Text-Figs. 2, 3 And 7)” (pp. 207). B Left: outline of a parasagittal section from a macaque brain showing different parts of the rCaS (roof, ventral leaf, and dorsal leaf; Van Essen et al. 1984). The authors write, “Calcarine cortex has the configuration of a mushroom lying on its side, with a “stem” and a “head” each consisting of two sheets of cortex. The stem, to the left of the map, has dorsal and ventral banks joined along the fundus of the calcarine sulcus. The head of the mushroom has a “roof” and two “leaves” joined to the roof along separate branches of the Y-shaped fundus” (pp. 432). Right, bottom: drawings of flattened versions of V1 with labeled eccentricity values relative to the three pieces of the rCaS. Images adapted from Van Essen et al. (1984). C A flattened version of macaque V1 stained with cytochrome oxidase and labeled with eccentricity values, in which the arrow denotes the “hinge” of the operculum, which represents ~ 8°. The authors write: “The arrow denotes the “hinge,” where the operculum folds into the calcarine fissure at the midline” (p. 7230). Image adapted from Horton and Hocking (1996). D A drawing of a macaque brain, slightly rotated and labeled with eccentricity values in which 7° is just posterior to the rCaS, which consists of what is labeled as “posterior branch,” as well as the most posterior components of the “dorsal branch” and “ventral branch.” Image from Galletti et al. (2001)
Fig. 4
Fig. 4
Anatomical localization of the rCaS and eCaS in human and macaque. (Left) Sagittal and coronal slices of group overlap maps for rCaS (blue) and eCaS (red) for (top) humans and (bottom) macaques. Group overlap maps range from most (bright colors) to least (dark colors) overlap. Sagittal and coronal human slices are spaced every 3 mm and 4 mm, respectively. Sagittal and coronal macaque slices are spaced every 2.5 mm. (Right) Group overlap maps for rCaS and eCaS shown on inflated and pial cortical surface views of human (fsaverage; top; Fischl et al. 1999a, b) and macaque (NMT; bottom; Seidlitz et al. 2018) template surfaces. Outlines of the rCaS (black solid line) and eCaS (white solid line) defined from the folding patterns of the template surfaces for both species are shown for inflated and folded views. Colormap ranges from 1/n to n individuals
Fig. 5
Fig. 5
The rCaS and eCaS relative to V1 in humans and macaques. Outlines of template-defined rCaS (black solid line) and eCaS (white solid line) and individual-defined rCaS (dark pink solid line) and eCaS (light pink solid line) on cortical surface curvature, polar angle, and eccentricity maps in humans (top) and macaques (bottom). Group averaged (left) and individual participant (right: 144226 and M1 for human and macaque, respectively) data are shown. White dotted lines illustrate the borders between visual areas V1 and V2. To help relate the lateral and medial viewpoints of the macaque surfaces, green and yellow asterisks mark corresponding locations in V1. Zoomed out views are shown for each hemisphere with black boxes corresponding to the region shown in the cropped images. See Supplementary Fig. 3 for more example participants
Fig. 6
Fig. 6
Eccentricity representations of rCaS and eCaS as a function of cortical distance in humans and macaques. The location of eCaS and rCaS in relation to the cortical magnification of V1 are shown for (left) group and (right) individual participants in (top) humans and (bottom) macaques. (Left) Group aggregated 2D histograms and exponential curve fits to eccentricity as a function of cortical distance from the foveal confluence of V1. For histograms, isocontour lines are shown for both eCaS and rCaS at 99, 75, 50, and 25% levels of their respective maximums. For exponential curve fits, the average r-squared for individual fits was 0.89 (± 0.02) and 0.95 (± 0.02) for humans and macaques, respectively. While the curve fits do not capture all aspects of the data, they provide an accurate illustration of the relationship between eccentricity and cortical distance for both eCaS and rCaS. The range of eccentricity and cortical distances covered by the rCaS (blue line) and eCaS (red line) are shown relative to the rest of V1 (grey line). (Right) Scatterplots of eccentricity representations in relation to cortical distance from the fovea of V1 within the rCaS (blue), the eCaS (red), and the rest of V1 (grey) for three individuals (left to right: 100610, 102816, 114823 and M1, M2, M3 for humans and monkeys, respectively). Black lines illustrate the curve fits across the entire V1. The range of eccentricity and cortical distances covered by the rCaS and eCaS are illustrated by red and blue dashed lines, respectively. See Supplementary Fig. 5 for additional example individuals
Fig. 7
Fig. 7
Visual field coverage of rCaS and eCaS in humans and macaques. (Left) The mean eccentricity representation within the rCaS (blue) and eCaS (red) for individuals (grey circles) and group averages (black circles) in humans (top) and macaques (bottom). (Right) Visual field coverage in Cartesian space of each surface node within the rCaS and eCaS across all participants

References

    1. Amunts K, Malikovic A, Mohlberg H, et al. Brodmann’s areas 17 and 18 brought into stereotaxic space-where and how variable? Neuroimage. 2000;11:66–84. doi: 10.1006/nimg.1999.0516. - DOI - PubMed
    1. Andelin AK, Olavarria JF, Fine I, et al. The effect of onset age of visual deprivation on visual cortex surface area across-species. Cereb Cortex. 2019;29:4321–4333. doi: 10.1093/cercor/bhy315. - DOI - PMC - PubMed
    1. Arcaro MJ, Kastner S. Topographic organization of areas V3 and V4 and its relation to supra-areal organization of the primate visual system. Vis Neurosci. 2015;32(e015):1–15. - PMC - PubMed
    1. Arcaro MJ, Livingstone MS. Retinotopic organization of scene areas in macaque inferior temporal cortex. J Neurosci. 2017;37:7373–7389. doi: 10.1523/JNEUROSCI.0569-17.2017. - DOI - PMC - PubMed
    1. Arcaro MJ, Livingstone MS. A hierarchical, retinotopic proto-organization of the primate visual system at birth. Elife. 2017;6(e26196):1–24. - PMC - PubMed