

Sensorimotor integration within the primary motor cortex by selective nerve fascicle stimulation
- PMID: 34921406
- PMCID: PMC9305922
- DOI: 10.1113/JP282259
Sensorimotor integration within the primary motor cortex by selective nerve fascicle stimulation
Abstract
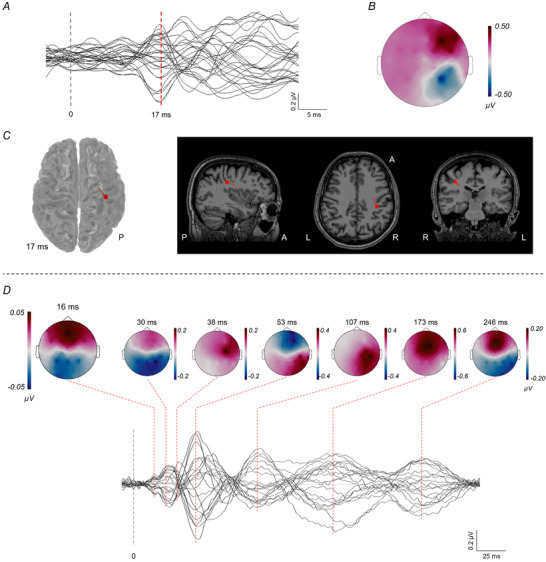
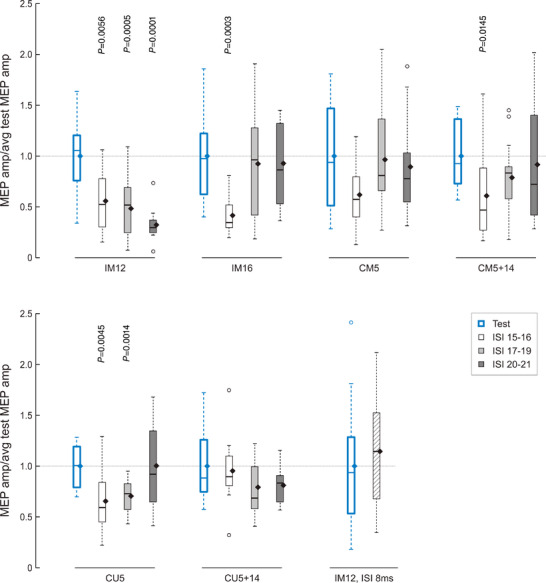
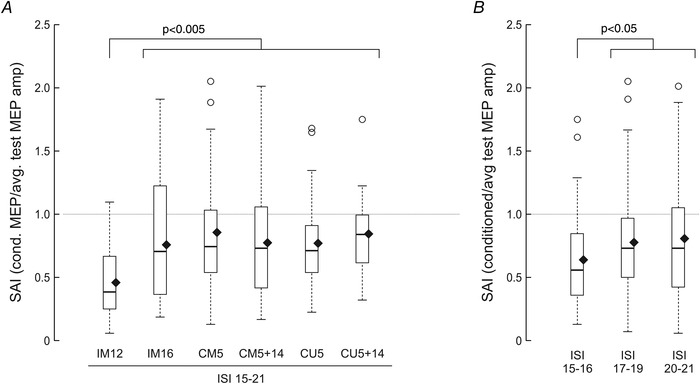
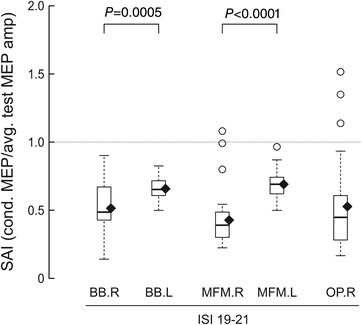
The integration of sensory inputs in the motor cortex is crucial for dexterous movement. We recently demonstrated that a closed-loop control based on the feedback provided through intraneural multichannel electrodes implanted in the median and ulnar nerves of a participant with upper limb amputation improved manipulation skills and increased prosthesis embodiment. Here we assessed, in the same participant, whether and how selective intraneural sensory stimulation also elicits a measurable cortical activation and affects sensorimotor cortical circuits. After estimating the activation of the primary somatosensory cortex evoked by intraneural stimulation, sensorimotor integration was investigated by testing the inhibition of primary motor cortex (M1) output to transcranial magnetic stimulation, after both intraneural and perineural stimulation. Selective sensory intraneural stimulation evoked a low-amplitude, 16 ms-latency, parietal response in the same area of the earliest component evoked by whole-nerve stimulation, compatible with fast-conducting afferent fibre activation. For the first time, we show that the same intraneural stimulation was also capable of decreasing M1 output, at the same time range of the short-latency afferent inhibition effect of whole-nerve superficial stimulation. The inhibition generated by the stimulation of channels activating only sensory fibres was stronger than that due to intraneural or perineural stimulation of channels activating mixed fibres. We demonstrate in a human subject that the cortical sensorimotor integration inhibiting M1 output previously described after the experimental whole-nerve stimulation is present also with a more ecological selective sensory fibre stimulation. KEY POINTS: Cortical integration of sensory inputs is crucial for dexterous movement. Short-latency somatosensory afferent inhibition of motor cortical output is typically produced by peripheral whole-nerve stimulation. We exploited intraneural multichannel electrodes used to provide sensory feedback for prosthesis control to assess whether and how selective intraneural sensory stimulation affects sensorimotor cortical circuits in humans. Activation of the primary somatosensory cortex (S1) was explored by recording scalp somatosensory evoked potentials. Sensorimotor integration was tested by measuring the inhibitory effect of the afferent stimulation on the output of the primary motor cortex (M1) generated by transcranial magnetic stimulation. We demonstrate in humans that selective intraneural sensory stimulation elicits a measurable activation of S1 and that it inhibits the output of M1 at the same time range of whole-nerve superficial stimulation.
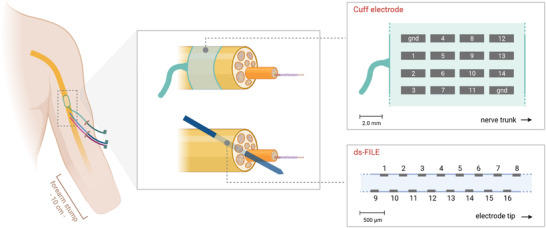
Keywords: evoked potentials; intraneural double-sided filament electrodes (ds-FILE); short-latency afferent inhibition; somatosensory peripheral stimulation; transcranial magnetic stimulation (TMS).
© 2021 The Authors. The Journal of Physiology published by John Wiley & Sons Ltd on behalf of The Physiological Society.
Figures
Similar articles
-
Role of cutaneous and proprioceptive inputs in sensorimotor integration and plasticity occurring in the facial primary motor cortex.J Physiol. 2020 Feb;598(4):839-851. doi: 10.1113/JP278877. Epub 2020 Feb 3. J Physiol. 2020. PMID: 31876950
-
Modified ischaemic nerve block of the forearm: use for the induction of cortical plasticity in distal hand muscles.J Physiol. 2019 Jul;597(13):3457-3471. doi: 10.1113/JP277639. Epub 2019 Jun 6. J Physiol. 2019. PMID: 31111966
-
Modulating motor cortex plasticity via cortical and peripheral somatosensory stimulation.J Neurophysiol. 2025 Jun 1;133(6):1955-1966. doi: 10.1152/jn.00600.2024. Epub 2025 May 7. J Neurophysiol. 2025. PMID: 40331752
-
Potentials evoked in human and monkey cerebral cortex by stimulation of the median nerve. A review of scalp and intracranial recordings.Brain. 1991 Dec;114 ( Pt 6):2465-503. doi: 10.1093/brain/114.6.2465. Brain. 1991. PMID: 1782527 Review.
-
Sensorimotor integration in movement disorders.Mov Disord. 2003 Mar;18(3):231-240. doi: 10.1002/mds.10327. Mov Disord. 2003. PMID: 12621626 Review.
Cited by
-
Stimulation with acoustic white noise enhances motor excitability and sensorimotor integration.Sci Rep. 2022 Jul 30;12(1):13108. doi: 10.1038/s41598-022-17055-9. Sci Rep. 2022. PMID: 35907889 Free PMC article.
-
From rubber hands to neuroprosthetics: Neural correlates of embodiment.Neurosci Biobehav Rev. 2023 Oct;153:105351. doi: 10.1016/j.neubiorev.2023.105351. Epub 2023 Aug 6. Neurosci Biobehav Rev. 2023. PMID: 37544389 Free PMC article. Review.
-
A Sensory Feedback Neural Stimulator Prototype for Both Implantable and Wearable Applications.Micromachines (Basel). 2024 Mar 30;15(4):480. doi: 10.3390/mi15040480. Micromachines (Basel). 2024. PMID: 38675291 Free PMC article.
-
An Open-Source Joystick Platform for Investigating Forelimb Motor Control, Auditory-Motor Integration, and Value-Based Decision-Making in Head-Fixed Mice.eNeuro. 2025 Apr 28;12(4):ENEURO.0038-25.2025. doi: 10.1523/ENEURO.0038-25.2025. Print 2025 Apr. eNeuro. 2025. PMID: 40295100 Free PMC article.
-
Artificial referred sensation in upper and lower limb prosthesis users: a systematic review.J Neural Eng. 2022 Sep 8;19(5):10.1088/1741-2552/ac8c38. doi: 10.1088/1741-2552/ac8c38. J Neural Eng. 2022. PMID: 36001115 Free PMC article.
References
-
- Allison T (1982). Scalp and cortical recordings of initial somatosensory cortex activity to median nerve stimulation in man. Ann N Y Acad Sci 388, 671–678. - PubMed
-
- Bagić AI, Knowlton RC, Rose DF, Ebersole JS & ACMEGS Clinical Practice Guideline (CPG) Committee (2011). American clinical magnetoencephalography society clinical practice guideline 1: recording and analysis of spontaneous cerebral activity. J Clin Neurophysiol 28, 348–354. - PubMed
-
- Benussi A, Grassi M, Palluzzi F, Koch G, Di Lazzaro V, Nardone R, Cantoni V, Dell'Era V, Premi E, Martorana A, di Lorenzo F, Bonnì S, Ranieri F, Capone F, Musumeci G, Cotelli MS, Padovani A & Borroni B (2020). Classification accuracy of transcranial magnetic stimulation for the diagnosis of neurodegenerative dementias. Ann Neurol 87, 394–404. - PubMed
Publication types
MeSH terms
Grants and funding
LinkOut - more resources
Full Text Sources