. 2022 Feb;232(1):1-14.
doi: 10.1007/s00427-021-00683-y. Epub 2021 Dec 18.

Dynamic changes in the association between maternal mRNAs and endoplasmic reticulum during ascidian early embryogenesis

Affiliations

Dynamic changes in the association between maternal mRNAs and endoplasmic reticulum during ascidian early embryogenesis

Toshiyuki Goto et al. Dev Genes Evol. 2022 Feb.

Abstract

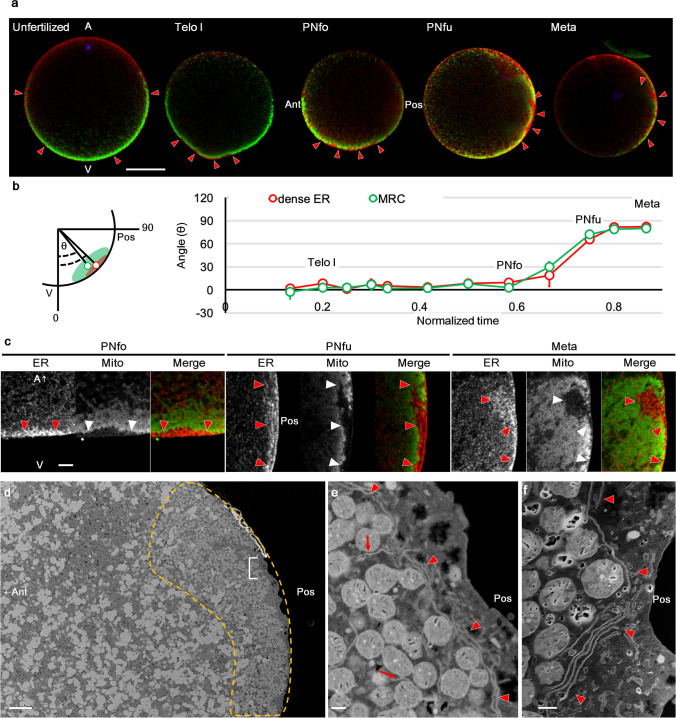
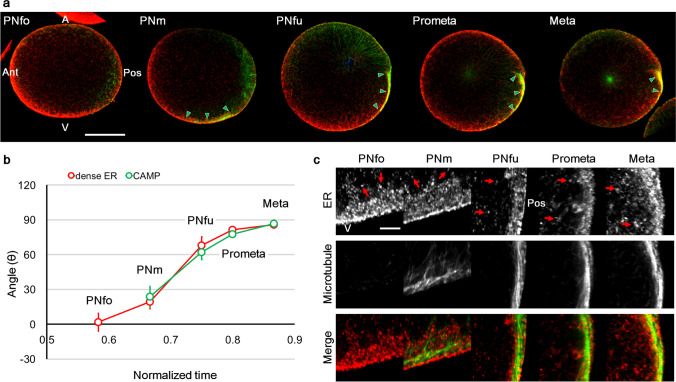
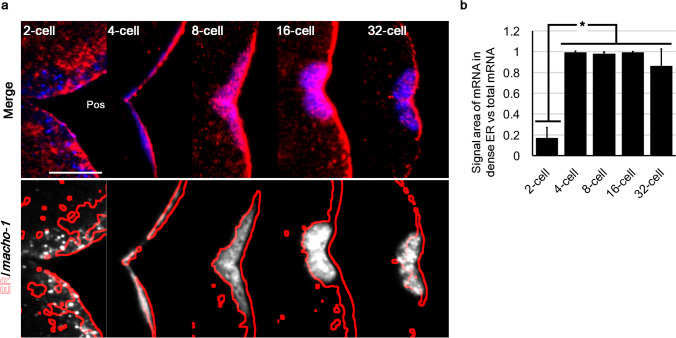
Axis formation is one of the most important events occurring at the beginning of animal development. In the ascidian egg, the antero-posterior axis is established at this time owing to a dynamic cytoplasmic movement called cytoplasmic and cortical reorganisation. During this movement, mitochondria, endoplasmic reticulum (ER), and maternal mRNAs (postplasmic/PEM RNAs) are translocated to the future posterior side. Although accumulating evidence indicates the crucial roles played by the asymmetrical localisation of these organelles and the translational regulation of postplasmic/PEM RNAs, the organisation of ER has not been described in sufficient detail to date owing to technical difficulties. In this study, we developed three different multiple staining protocols for visualising the ER in combination with mitochondria, microtubules, or mRNAs in whole-mount specimens. We defined the internally expanded "dense ER" using these protocols and described cisterna-like structures of the dense ER using focused ion beam-scanning electron microscopy. Most importantly, we described the dynamic changes in the colocalisation of postplasmic/PEM mRNAs and dense ER; for example, macho-1 mRNA was detached and excluded from the dense ER during the second phase of ooplasmic movements. These detailed descriptions of the association between maternal mRNA and ER can provide clues for understanding the translational regulation mechanisms underlying axis determination during ascidian early embryogenesis.

Keywords: Axis determination; Cytoskeleton; ER translocation; Maternal mRNA; Translational regulation.


Figures

Fig. 1
Fig. 1
The structure and translocation of ER during the second phase of movement. a Mid-plane optical sections of DiIC18 (red)-injected living eggs from 45 to 55 mpf (mm:ss). This period corresponds to the period from PNfu to Meta. White arrows and red arrowheads indicate the pronucleus (PN) and dense ER, respectively. Animal pole (A) is up. Anterior pole (Ant) is left; posterior pole (Pos) is right. b The 3D model of approximately two-third of vegetal hemisphere was rendered from optical sections of DiIC18 (red)-injected living eggs at approximately the PNfu stage (from 45:00 to 47:44 after fertilisation). The posterior half of the vegetal views is represented here. The dense ER moved posteriorly. V, vegetal pole; Pos↑, posterior side. Six independent experiments were carried out. In each experiment, appropriately oriented egg was selected from more than 50 DiIC18-injected living eggs. Scale bar: 50 µm
Fig. 2
Fig. 2
Discrete distribution of ER and mitochondria during the first cell cycle. a Our triple-staining protocol for nucleus (blue), ER (red), and mitochondria (green) was applied to the unfertilised eggs (unfertilised) and eggs of Telo, PNfo, PNfu, and Meta. A single optical section of the mid-plane is shown. Animal pole (A) is up. The antero (Ant)-posterior (Pos) axis becomes evident from PNfo stage owing to the position of the sperm aster. Red arrowheads indicate dense ER regions. Scale bar: 50 µm. b The movement of dense ER (red) and mitochondria-rich cytoplasm (MRC; green) from the vegetal pole (V) to the posterior pole (Pos) were quantitatively measured, as shown in the schema. The angles (θ) between the centre of the dense ER or MRC (red or green circles, respectively) and animal-vegetal axis were measured and represented as a line graph. Error bars represent SD (n = 3). c High-magnification images of dense ER regions at PNfo, PNfu, and Meta stages (as indicated on the top). The ER, mitochondria, and merged fluorescence channels are separately shown (as indicated on the top). Dense ER regions correspond to mitochondria-free regions (white arrowheads). Notably, the dense ER at PNfu displays a striped pattern. Approximately ten confocal images were acquired in each stage of cell cycle progression from five independent experiments. Scale bar: 5 µm. d Focused ion beam-scanning electron microscope (FIB-SEM) image of posterior pole region at the PNfu stage with myoplasmic region (yellow broken line), comprising MRC and dense ER regions (red arrowheads). Scale bar: 6 µm. e, f Enlarged images of dense ER (E; indicated by “[” in d, f; another specimen) show the cisterna-like structure, which is a stacked ER sheet (red arrowheads). Dense ER is almost mitochondria-free. Loosely extended ER (red arrow) can be observed in the MRC region. More than 40 eggs were observed in wide-field view, then appropriately oriented three FIB-SEM images were acquired. Scale bars: 0.6 µm
Fig. 3
Fig. 3
Colocalisation of ER and cortical array of microtubules in posterior-vegetal region (CAMP) during second phase of movement. a Another novel triple-staining protocol for nucleus (blue), ER (red), and microtubules (MT: green) was applied to the eggs during PNfo, PNm, PNfu, Prometa, and Meta. A single optical section of the mid-plane is shown. In this method, although the border of dens ER and loosely extended ER was not obvious in the lower magnification images because of the relatively bright staining of entire ER, it was identifiable in the high-magnification image of thin optical section. CAMP (green arrowheads) was observed from PNm stage within the dense ER region. Scale bar: 50 µm. b The movement of dense ER and CAMP was quantitatively analysed as described in Fig. 2. The angles (θ) between the centre of the dense ER or CAMP (red or green circles, respectively) and animal-vegetal axis were measured and represented as a line graph. Error bars represent SD (n = 3). c High-magnification images of CAMP at PNfo, PNm, PNfu, Prometa, and Meta (as shown on the top). ER, microtubules, and merged fluorescence channels are indicated on the left side. Approximately 30 confocal images were acquired in each stage of cell cycle progression from five independent experiments. Scale bar: 5 µm. Animal pole (A) is up and posterior pole (Pos) is at the right in all photographs. Anterior pole (Ant) and vegetal pole (V) are indicated in a few photos
Fig. 4
Fig. 4
Comparison of two fluorescence in situ hybridisation protocols. Conventional and our methods of in situ hybridisation were compared with two different probes, macho-1 and vasa, under the same conditions: tyramide-fluorescent detection system and confocal microscopy with same image acquisition settings. Posteriorly localised signals were detected with both probes (blue: light blue arrowheads). These eggs were fixed in metaphase in first mitosis. Optical sections of the mid-plane are shown. Animal pole (A) is up and posterior pole (Pos) is at the right in all photographs. Anterior pole (Ant) and vegetal pole (V) are also indicated. The outline of the egg detected by ImageJ is indicated by a red line. Compared to the conventional method, our method achieved high signal intensity with the macho-1 probe and a marked reduction of the cytoplasmic background with the vasa probe. Approximately ten confocal images were acquired from three independent experiments. Scale bars: 50 µm (entire egg image) and 10 µm (enlarged image)
Fig. 5
Fig. 5
Spatio-temporal pattern of dense ER and postplasmic/PEM RNAs. a, b Double immunostaining of ER (red) and MRC (green) and in situ hybridisation of maternal mRNAs (blue; macho-1 (a) and vasa (b)) were performed on the same embryo during the first cell cycle (developmental stages are indicated on the top; unfertilised, Telo I, PNfo, PNfu, and Meta). The optical sections of the mid-plane are shown. Animal pole (A) is up and vegetal pole (V) is down in all photographs. As the antero-posterior axis becomes evident from PNfo stage, posterior pole (Pos) is at the right from this stage onward. Upper tier: merged images of entire egg (no label) and enlarged dense ER region (enlarged). The nucleus (white in the merged images) was counterstained with 4′,6-diamidino-2-phenylindole dihydrochloride. Middle and lower tiers: mitochondria (Mito), ER, and in situ hybridisation (macho-1 and vasa) fluorescence channels of each enlarged image are separately represented (as indicate in the upper-left corner). Outlines of the densely stained ER region (red lines) were superimposed on in situ hybridisation signals (ER/macho-1 and ER/vasa). Most of the macho-1 signals overlapped with the dense ER region in the unfertilised egg and Telo I stage (yellow arrowheads); however, they were excluded from the dense ER region and extruded into MRC region after the PNfo stage (light blue arrowheads). In contrast, vasa signals were detected evenly in the entire cytoplasm and gradually localised to the posterior side; however, they were sparse in the dense ER region. Scale bars: 50 µm (entire egg image) and 10 µm (enlarged image). c, e Localisation patterns of maternal mRNAs (blue) at the 32-cell stage were co-stained for ER (red) and mitochondria (green) using our new method. Enlarged images of the CAB (arrowheads) show blotchy staining of ER (red) and mRNA signals (blue) of macho-1 (c) and vasa (e) within the CAB. Scale bars: 50 µm (left image) and 10 µm (right image). d, f Colocalisation between maternal mRNAs and dense ER was quantitatively evaluated by calculating the ratio of the signal area of the macho-1 (d) or vasa (f) mRNA within the dense ER region to the total area of mRNAs. Statistical significance was calculated by one-way ANOVA followed by the Tukey–Kramer test. Significant differences are represented by symbols (NS no significant difference, *p < 0.05, or **p < 0.01). Error bars represent SD (n = 3 with macho-1, n = 4 with vasa)
Fig. 6
Fig. 6
Spatio-temporal pattern of macho-1 during the cleavage stages. a Embryos from 2- to 32-cell stages were stained for ER (red) and macho-1 (blue) by our new method and counterstained with DAPI. The cell cycle of 2-cell stage was interphase and those of 4-cell stage onward were metaphase. Enlarged images of the CAB-forming regions are shown (merge). Outlines of the densely stained ER region (red lines) were superimposed on macho-1 signals (white: ER/macho-1). Scale bar: 10 µm. b Colocalisation between macho-1 and dense ER was quantitatively evaluated by calculating the ratio of the signal area of the macho-1 within the dense ER region to the total area of mRNA. Statistical significance was calculated by one-way ANOVA followed by the Tukey–Kramer test. Significant differences are represented by an asterisk (p < 0.05). Error bars represent SD (n = 5)

Similar articles

Cited by

References

    1. Bole DG, Dowin R, Doriaux M, Jamieson JD. Immunocytochemical localization of BiP to the rough endoplasmic reticulum: evidence for protein sorting by selective retention. J Histochem Cytochem. 1989;37:1817–1823. doi: 10.1177/37.12.2685110. - DOI - PubMed
    1. Chenevert J, Pruliere G, Ishii H, et al. Purification of mitochondrial proteins HSP60 and ATP synthase from ascidian eggs: implications for antibody specificity. PLoS ONE. 2013;8:e52996. doi: 10.1371/journal.pone.0052996. - DOI - PMC - PubMed
    1. Chiba S, Miki Y, Ashida K, et al. Interactions between cytoskeletal components during myoplasm rearrangement in ascidian eggs. Dev Growth Differ. 1999;41:265–272. doi: 10.1046/j.1440-169X.1999.413433.x. - DOI - PubMed
    1. Conklin EG. The organization and cell lineage of the ascidian egg. J Acad Nat Sci Phila. 1905;13:1–119.
    1. Estrada P, Kim J, Coleman J, et al. Myo4p and She3p are required for cortical ER inheritance in Saccharomyces cerevisiae. J Cell Biol. 2003;163:1255–1266. doi: 10.1083/jcb.200304030. - DOI - PMC - PubMed