. 2021 Dec 18;79(1):47.
doi: 10.1007/s00018-021-04053-9.

Mahogunin Ring Finger 1 regulates pigmentation by controlling the pH of melanosomes in melanocytes and melanoma cells

Affiliations

Mahogunin Ring Finger 1 regulates pigmentation by controlling the pH of melanosomes in melanocytes and melanoma cells

Julia Sirés-Campos et al. Cell Mol Life Sci. .

Abstract

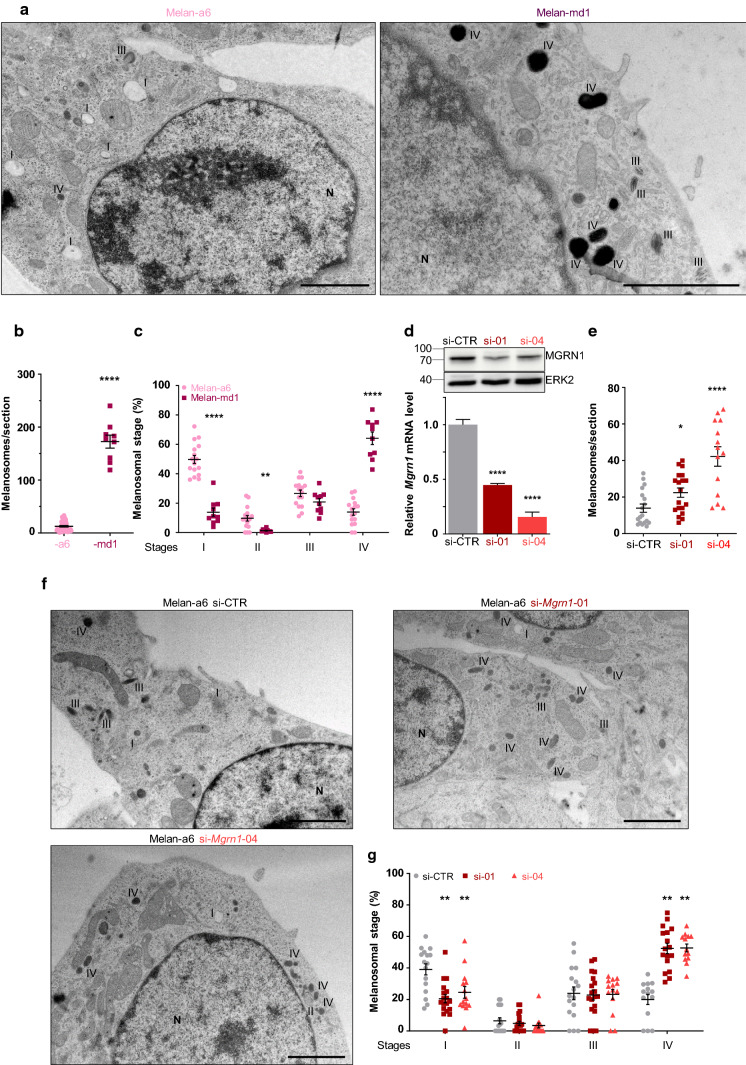
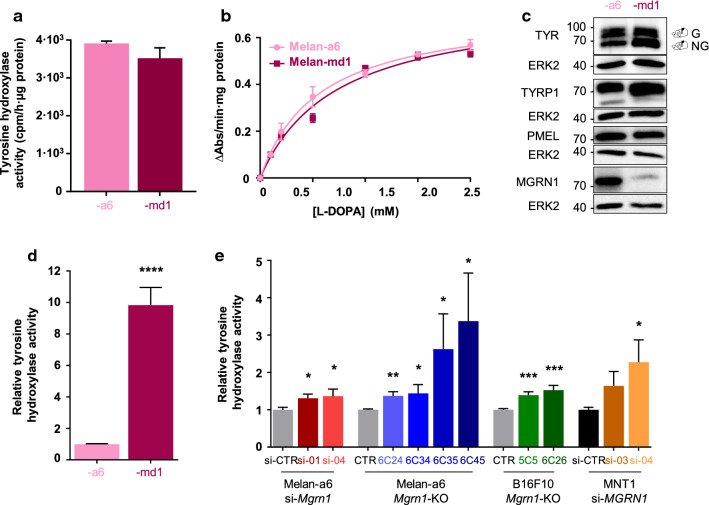
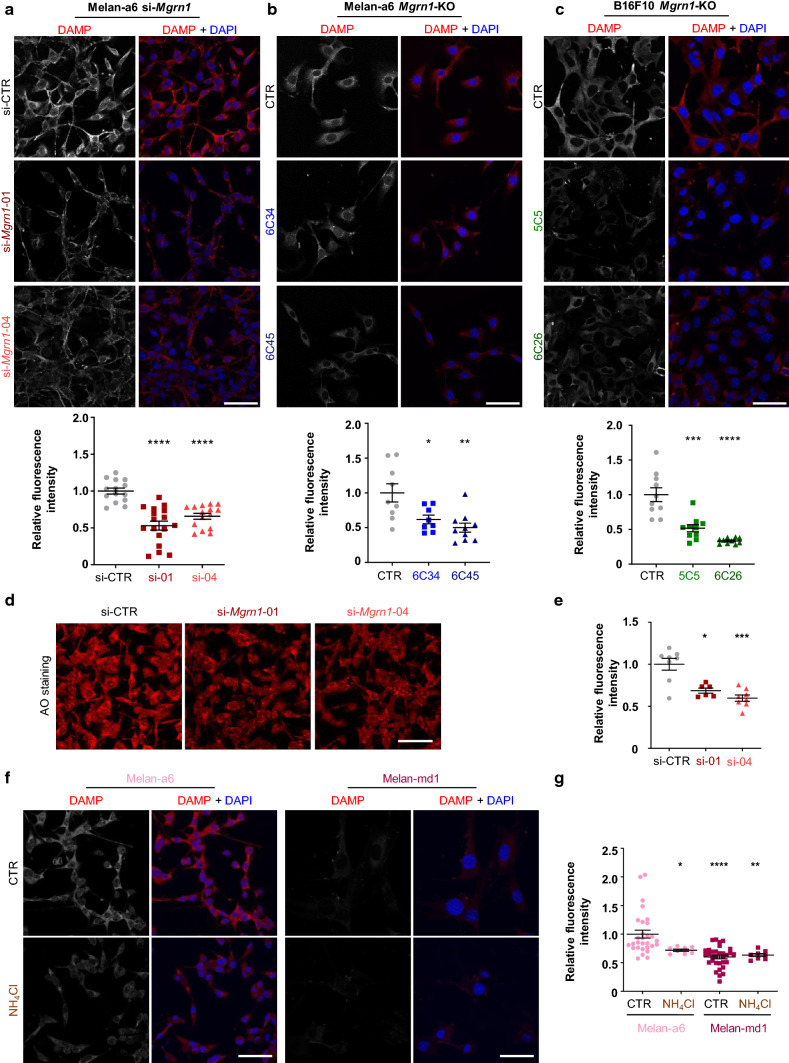
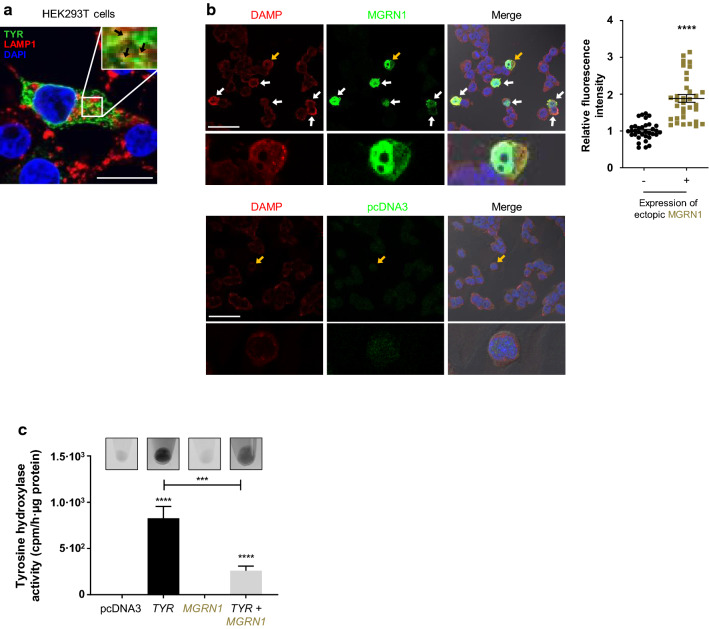
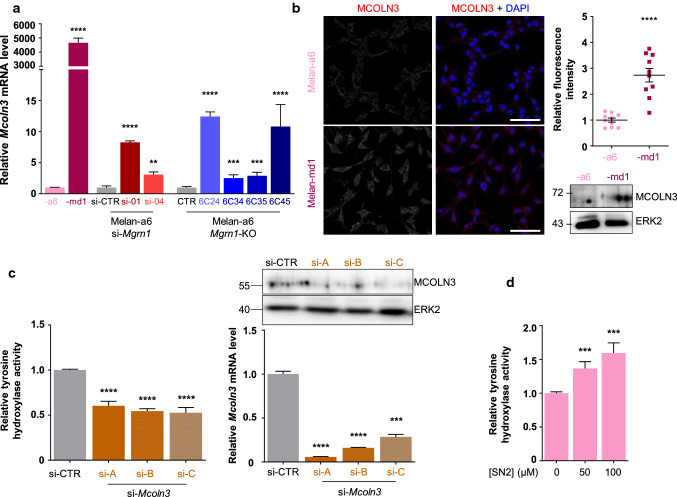
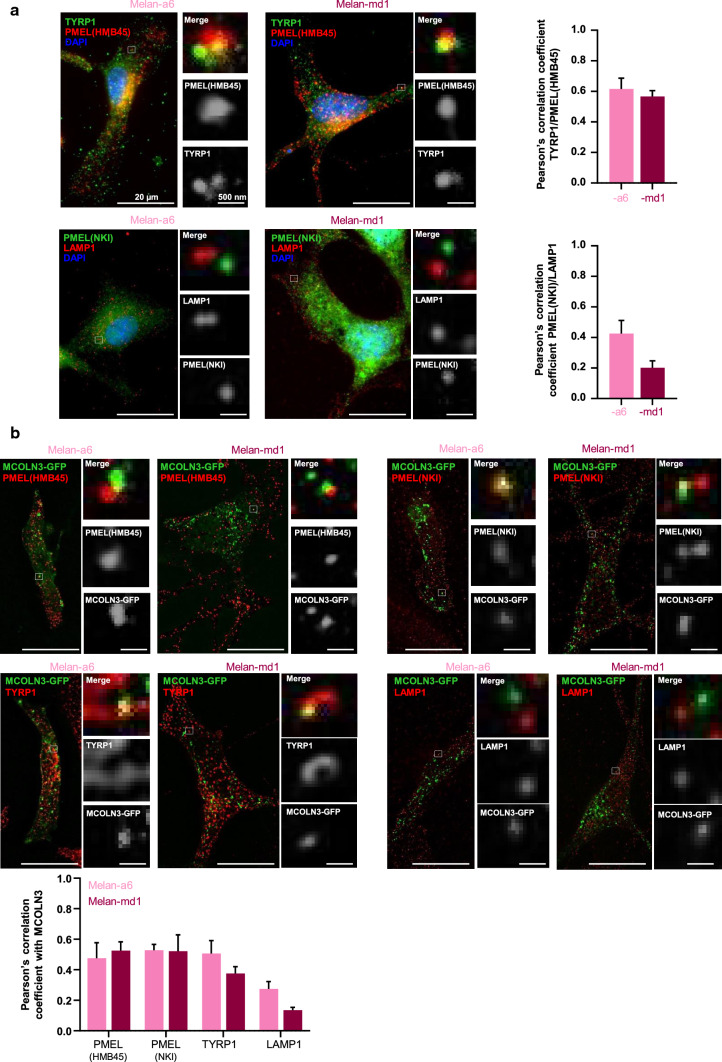
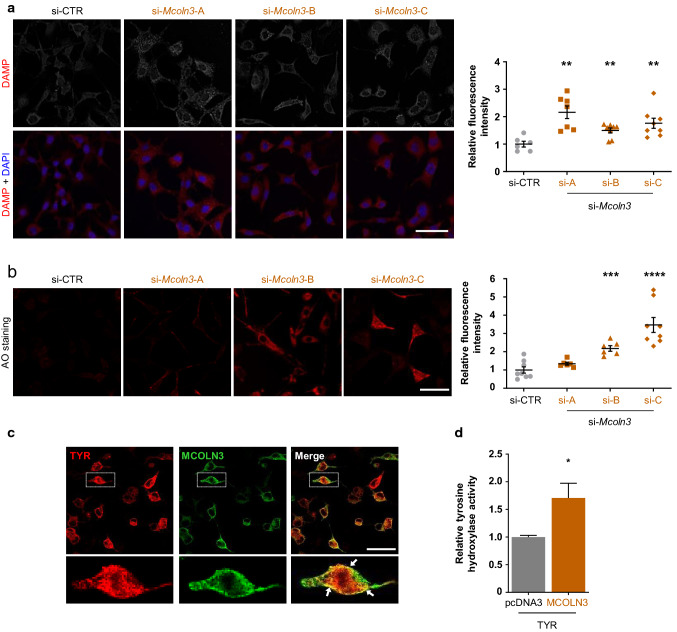
Mahogunin Ring Finger 1 (MGRN1) is an E3-ubiquitin ligase absent in dark-furred mahoganoid mice. We investigated the mechanisms of hyperpigmentation in Mgrn1-null melan-md1 melanocytes, Mgrn1-KO cells obtained by CRISPR-Cas9-mediated knockdown of Mgrn1 in melan-a6 melanocytes, and melan-a6 cells depleted of MGRN1 by siRNA treatment. Mgrn1-deficient melanocytes showed higher melanin content associated with increased melanosome abundance and higher fraction of melanosomes in highly melanized maturation stages III-IV. Expression, post-translational processing and enzymatic activity of the rate-limiting melanogenic enzyme tyrosinase measured in cell-free extracts were comparable in control and MGRN1-depleted cells. However, tyrosinase activity measured in situ in live cells and expression of genes associated with regulation of pH increased upon MGRN1 repression. Using pH-sensitive fluorescent probes, we found that downregulation of MGRN1 expression in melanocytes and melanoma cells increased the pH of acidic organelles, including melanosomes, strongly suggesting a previously unknown role of MGRN1 in the regulation of melanosomal pH. Among the pH regulatory genes upregulated by Mgrn1 knockdown, we identified those encoding several subunits of the vacuolar adenosine triphosphatase V-ATPase (mostly Atp6v0d2) and a calcium channel of the transient receptor potential channel family, Mucolipin 3 (Mcoln3). Manipulation of expression of the Mcoln3 gene showed that overexpression of Mcoln3 played a significant role in neutralization of the pH of acidic organelles and activation of tyrosinase in MGRN1-depleted cells. Therefore, lack of MGRN1 led to cell-autonomous stimulation of pigment production in melanocytes mostly by increasing tyrosinase specific activity through neutralization of the melanosomal pH in a MCOLN3-dependent manner.

Keywords: Lysosome-related organelles; Mahogunin Ring Finger 1 (MGRN1); Melanin; Melanosomal pH; Mucolipin 3 (MCOLN3); Tyrosinase.


Conflict of interest statement

The authors declare no conflict of interest.

Figures

Fig. 1
Fig. 1
Ultrastructural analysis of MGRN1-deprived mouse melanocytes. a Electron microscopy analysis of ultrathin sections of epon embedded control melan-a6 melanocytes and Mgrn1-null melan-md1 cells. b Quantification of total number of melanosomes on EM sections (n ≥ 10). c Distribution of melanosomes in the four maturation stages. The melanosomes in at least 10 independent sections were classified in stages I–IV according to their morphology and melanin content, as shown in panel a. Stage III and IV melanosomes were distinguished by the lower degree of melanization and the occurrence of identifiable fibrils not completely obliterated by melanin deposits in stage III melanosomes as opposed to the homogeneously dense appearance of stage IV organelles. The graph shows the percentage of organelles in each stage relative to the total number of melanosomes. d Depletion of MGRN1 in melan-a6 cells using two individual siRNAs (si-01 and si-04). The upper Western blot shows the abundance of the MGRN1 protein in cells treated with a control siRNA (siCTR) or with Mgrn1-specific siRNAs, with ERK2 as a control for comparable loading. The lower bar graph depicts the relative expression of Mgrn1 mRNA in melan-a6 cells treated with control and Mgrn1-directed siRNA, estimated by qPCR (n = 6). e Quantification of total number of melanosomes on EM sections of melan-a6 cells treated with control or Mgrn1-directed siRNA as in panel d (n ≥ 14). f 60-nm electron micrographs of melan-a6 cells treated with control siRNA (siCTR) or with two different Mgrn1-directed siRNAs. g Distribution of melanosomes in the four maturation stages in siCTR or Mgrn1-siRNA-treated melan-a6 cells (n ≥ 14), estimated as in panel c. N nucleus. Scale bar: 2 µm
Fig. 2
Fig. 2
Tyrosinase activity in control and Mgrn1-depleted cells. a Tyrosine hydroxylase activity in cell-free extracts from mouse melan-a6 and -md1 melanocytes (n ≥ 8). Data were expressed as cpm/h/μg protein. b Michaelis–Menten plot for DOPA oxidase activity in cell-free extracts from melan-a6 and -md1 cells (n = 3). c Representative immunoblots of melanosomal proteins (TYR, TYRP1, PMEL17 and MGRN1 in melan-a6 and -md1 melanocytes. ERK2 was used as loading control. d Tyrosine hydroxylase activity measured in live cells and normalized to total protein in melan-a6 and -md1 melanocytes (n ≥ 8). e Changes in tyrosine hydroxylase activity in live cells upon abrogation of Mgrn1 expression by CRISPR-Cas9 (Mgrn1-KO melan-a6 cells, n = 8 and B16F10 mouse melanoma cells, n = 10), or upon downregulation of MGRN1 in melan-a6 and MNT-1 cells by treatment with two different specific siRNAs (n ≥ 4). Data are expressed as relative activity respect to the corresponding controls.
Fig. 3
Fig. 3
Analysis of the pH of acidic organelles using DAMP-DNP (DAMP) and Acridine Orange (AO). ac Confocal micrographs of different cell types probed for 30 min with DAMP-DNP and stained for DNP (red) and nuclei (DAPI staining, blue). The histogram below each set of images corresponds to the quantification of the fluorescence intensity of DAMP-DNP staining, normalized to control. a Melan-a6 cells treated with control siRNA (siCTR) or Mgrn1-directed siRNA-01 or -04 (n ≥ 15). b Control (CTR) and CRISPR/Cas9 Mgrn1-KO clones of melan-a6 melanocytes (6C34 and 6C45 clones) (n ≥ 8). c CRISPR/Cas9 control (CTR) and Mgrn1-KO clones of B16F10 mouse melanoma cells (5C5 and 6C26 clones) (n ≥ 10). d Confocal microscopy images of AO-stained melan-a6 cells treated with control siRNA (siCTR) or Mgrn1-siRNA-01 or -04 before incubation with AO. e Quantification of the fluorescence intensity of AO-stained cells (n ≥ 6). Data are normalized by cell number in each image and referred to the control. f DAMP staining of control and NH4Cl-treated melan-a6 and melan-md1 melanocytes. Nuclei were stained with DAPI and are shown in the merged images. g Relative fluorescence intensity of DAMP staining in control and NH4Cl-treated cells (n ≥ 8, data normalized by cell number cell. Scale bar: 50 µm.
Fig. 4
Fig. 4
Changes in TYR activity ectopically expressed in HEK293T cells and in the pH of acidic organelles, upon forced expression of MGRN1. a Confocal microscopy images of HEK293T cells transfected to express TYR and immunostained for TYR (green) and endogenous LAMP1 (red). Black arrows in the 2.5 × magnified box show co-localization of both proteins (Pearson’s correlation coefficient: 58.3% ± 1.9). Scale bar: 20 µm. b Confocal images of HEK293T cells transfected with Mgrn1-GFP (upper rows) or with empty vector (lower rows) and stained for acidic organelles with DAMP (red). MGRN1 is shown in green. Arrows highlight MGRN1-expressing cells. Note that these cells displayed the highest intensity of DAMP staining. Scale bar: 50 µm. The enlarged images below each micrograph correspond to the cell indicated with a yellow arrow. The histogram shows the quantification of the relative fluorescence intensity of DAMP in cells expressing MGRN1, as compared with cells that do not express the exogenous protein at detectable levels (n = 34). c Tyrosine hydroxylase activity in live HEK293T cells transfected with empty vector (pcDNA3), or with TYR and MGRN1 expression constructs alone or in combination (n ≥ 8). Data were expressed as cpm/h/μg protein. Representative pictures of the corresponding cell pellets are shown above each bar of the graph.
Fig. 5
Fig. 5
Induction of MCOLN3 expression upon downregulation of MGRN1. a RT-PCR analysis of Mcoln3 expression in melan-a6 and md1 melanocytes, Mgrn1-KO melanocytes derived from melan-a6 cells by CRISPR-Cas9 (clones 6C24, 6c34, 6c36 and 6c45) and in melan-a6 cells treated with Mgrn1-directed siRNAs 01 and 04. In all cases, relative Mcoln3 mRNA levels in MGRN1-deprived cells respect to the corresponding controls are shown (n ≥ 3). b Expression of MCOLN3 protein in melan-a6 or -md1 melanocytes. Confocal microscopy images of cells immunostained for endogenous MCOLN3 (left), histogram corresponding to the quantification of the fluorescence intensity of MCOLN3 staining normalized by number of cells (middle, n = 10), and representative immunoblots for endogenous MCOLN3 expression. ERK2 was used as loading control. c Effect of downregulation of MCOLN3 on TYR activity of melan-md1 cells. Melan-md1 melanocytes were treated with 3 different Mcoln3-directed siRNAs, then tyrosine hydroxylase activity was measured in vivo. The bar graph on the left shows the residual TYR activity in MCOLN3-depleted cells (si-A, -B and -C), relative to controls treated with a scrambled siRNA (siCTR). On the right, the upper Western blot shows the abundance of the MCOLN3 protein in cells treated with a control siRNA (siCTR) or with Mcoln3-specific siRNAs, with ERK2 as a control for comparable loading. The lower bar graph depicts the residual Mcoln3 mRNA levels in these cells as estimated by RT-PCR. d Tyrosine hydroxylase activity in live melan-a6 cells treated with the indicated concentrations of the MCOLN3 channel agonist SN2 (n ≥ 10).
Fig. 6
Fig. 6
Subcellular localization of MCOLN3 in melanocytes. Confocal microscopy images of melan-a6 and -md1 cells. a Images of non-transfected cells labeled for endogenous TYRP1, HMB45 and NKI. The endogenous level of LAMP1 was used as negative control; b Cells transfected with an MCOLN3-GFP construct and stained for TYRP1, HMB45, NKI and LAMP1. Pearson’s correlation coefficient between two channels was quantified using ImageJ Fiji from one frame of the cell acquisition.
Fig. 7
Fig. 7
Regulation of the pH of acidic organelles in melanocytic cells by MCOLN3. a Organelle acidification in melan-md1 cells upon Mcoln3 silencing. Mcoln3 expression was silenced in melan-md1 cells by treatment with 3 different specific siRNAs, as in Fig. 5 panel. DAMP-stained cells were observed with a confocal microscope. The graph on the right shows the quantification of DAMP fluorescence in the confocal microscopy images. Data are normalized to the fluoresce intensity of cells treated with a control scrambled siRNA (siCTR). b Same as in panel A, except that cells were stained with AO. c Co-localization of MCOLN3 and TYR upon forced expression in HEK293 cells. HEK293 cells were transfected to express a HA epitope-labeled MCOLN3 and Flag-labeled TYR. Both proteins were immunostained and cells observed in a confocal microscope. Strong co-localization of both proteins was detected. d Increased TYR activity in cells co-transfected with TYR and MCOLN3 expression constructs. HEK293 cells were transfected with a TYR expression construct and empty vector (pcDNA) or an MCOLN3 construct, as indicated. The tyrosine hydroxylase activity in live cells was measured and data were normalized with the activity measured in cells expressing TYR alone. Scale bar: 50 µm.

Similar articles

Cited by

References

    1. Ito S, Wakamatsu K. Diversity of human hair pigmentation as studied by chemical analysis of eumelanin and pheomelanin. J Eur Acad Dermatology Venereol. 2011;25:1369–1380. doi: 10.1111/j.1468-3083.2011.04278.x. - DOI - PubMed
    1. Delevoye C, Marks M, Raposo G. Lysosome-related organelles as functional adaptations of the endolysosomal system. Curr Opin Cell Biol. 2019;59:147–158. doi: 10.1016/J.CEB.2019.05.003. - DOI - PMC - PubMed
    1. Bowman SL, Bi-Karchin J, Le L, Marks MS. The road to lysosome-related organelles: Insights from Hermansky-Pudlak syndrome and other rare diseases. Traffic. 2019;20:404–435. doi: 10.1111/tra.12646. - DOI - PMC - PubMed
    1. Raposo G, Marks MS. Melanosomes—dark organelles enlighten endosomal membrane transport. Nat Rev Mol Cell Biol. 2007;8:786–797. doi: 10.1038/nrm2258. - DOI - PMC - PubMed
    1. Garcia-Borron JC, Solano F. Molecular anatomy of tyrosinase and its related proteins: beyond the histidine-bound metal catalytic center. Pigment Cell Res. 2002;15:162–173. doi: 10.1034/j.1600-0749.2002.02012.x. - DOI - PubMed

LinkOut - more resources