

Factors affecting the value of diffusion-weighted imaging for identifying breast cancer patients with pathological complete response on neoadjuvant systemic therapy: a systematic review
- PMID: 34921645
- PMCID: PMC8684570
- DOI: 10.1186/s13244-021-01123-1
Factors affecting the value of diffusion-weighted imaging for identifying breast cancer patients with pathological complete response on neoadjuvant systemic therapy: a systematic review
Abstract
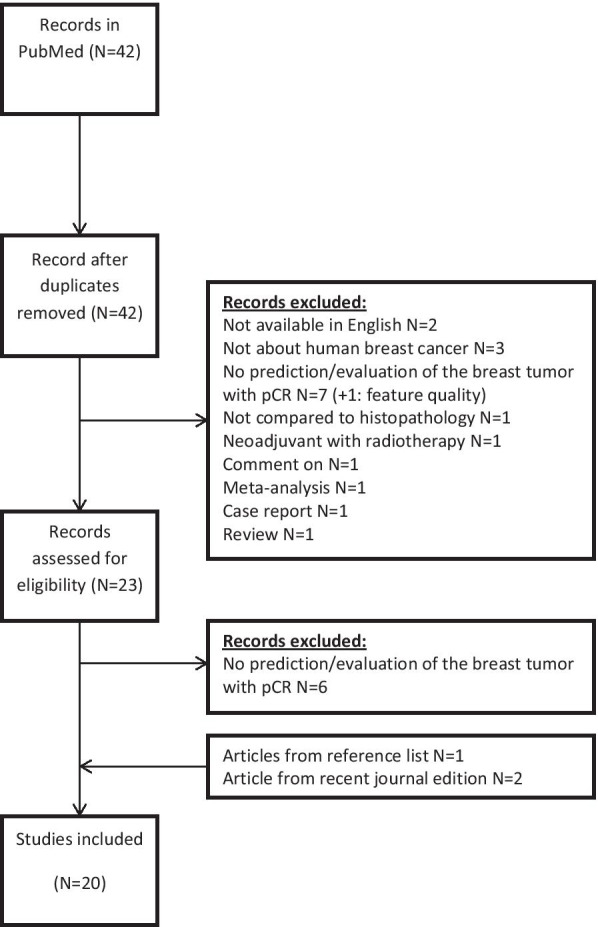
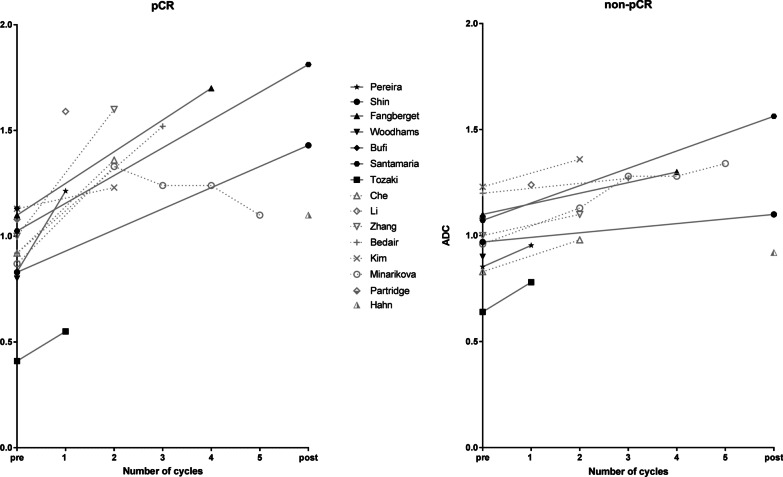
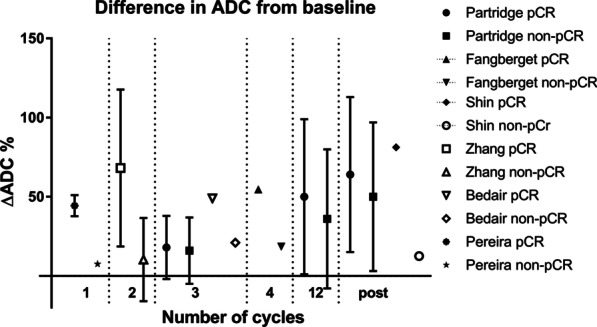
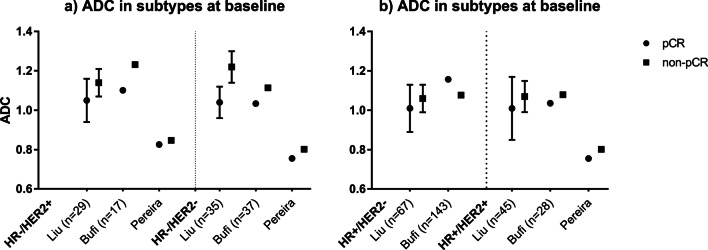
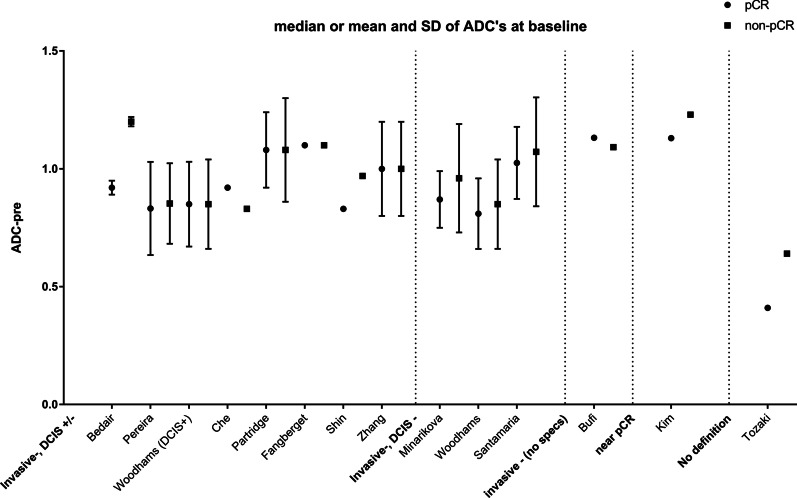
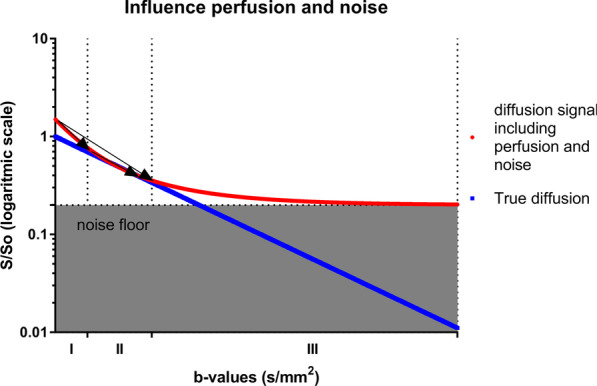
This review aims to identify factors causing heterogeneity in breast DWI-MRI and their impact on its value for identifying breast cancer patients with pathological complete response (pCR) on neoadjuvant systemic therapy (NST). A search was performed on PubMed until April 2020 for studies analyzing DWI for identifying breast cancer patients with pCR on NST. Technical and clinical study aspects were extracted and assessed for variability. Twenty studies representing 1455 patients/lesions were included. The studies differed with respect to study population, treatment type, DWI acquisition technique, post-processing (e.g., mono-exponential/intravoxel incoherent motion/stretched exponential modeling), and timing of follow-up studies. For the acquisition and generation of ADC-maps, various b-value combinations were used. Approaches for drawing regions of interest on longitudinal MRIs were highly variable. Biological variability due to various molecular subtypes was usually not taken into account. Moreover, definitions of pCR varied. The individual areas under the curve for the studies range from 0.50 to 0.92. However, overlapping ranges of mean/median ADC-values at pre- and/or during and/or post-NST were found for the pCR and non-pCR groups between studies. The technical, clinical, and epidemiological heterogeneity may be causal for the observed variability in the ability of DWI to predict pCR accurately. This makes implementation of DWI for pCR prediction and evaluation based on one absolute ADC threshold for all breast cancer types undesirable. Multidisciplinary consensus and appropriate clinical study design, taking biological and therapeutic variation into account, is required for obtaining standardized, reliable, and reproducible DWI measurements for pCR/non-pCR identification.
Keywords: Breast cancer; DWI; Methodology; Neoadjuvant; pCR.
© 2021. The Author(s).
Conflict of interest statement
The authors of this manuscript declare relationships with the following companies: Ritse M. Mann, MD, PhD (research agreements: Siemens Healthineers, Bayer Healthcare, ScreenPoint Medical, Seno Medical, Koning, Medtronic, BD/Bard). All remaining authors declare no competing interest. Ritse M. Mann and Regina Beets-Tan are members of the Insights into Imaging Advisory Editorial Board. They have not taken part in the review or selection process of this article.
Figures
Similar articles
-
Quantitative intravoxel incoherent motion parameters derived from whole-tumor volume for assessing pathological complete response to neoadjuvant chemotherapy in locally advanced rectal cancer.J Magn Reson Imaging. 2018 Jul;48(1):248-258. doi: 10.1002/jmri.25931. Epub 2017 Dec 27. J Magn Reson Imaging. 2018. PMID: 29281151
-
Predicting the pathological response to chemoradiotherapy of non-mucinous rectal cancer using pretreatment texture features based on intravoxel incoherent motion diffusion-weighted imaging.Abdom Radiol (NY). 2019 Aug;44(8):2689-2698. doi: 10.1007/s00261-019-02032-0. Abdom Radiol (NY). 2019. PMID: 31030244
-
Diffusion-weighted MRI for predicting pathologic response to neoadjuvant chemotherapy in breast cancer: evaluation with mono-, bi-, and stretched-exponential models.J Transl Med. 2021 Jun 2;19(1):236. doi: 10.1186/s12967-021-02886-3. J Transl Med. 2021. PMID: 34078388 Free PMC article.
-
Intravoxel Incoherent Motion Diffusion-Weighted Imaging for Quantitative Differentiation of Breast Tumors: A Meta-Analysis.Front Oncol. 2020 Oct 20;10:585486. doi: 10.3389/fonc.2020.585486. eCollection 2020. Front Oncol. 2020. PMID: 33194733 Free PMC article.
-
Diffusion-weighted imaging in monitoring the pathological response to neoadjuvant chemotherapy in patients with breast cancer: a meta-analysis.World J Surg Oncol. 2018 Jul 18;16(1):145. doi: 10.1186/s12957-018-1438-y. World J Surg Oncol. 2018. PMID: 30021656 Free PMC article.
Cited by
-
Prediction of Primary Tumour and Axillary Lymph Node Response to Neoadjuvant Chemo(Targeted) Therapy with Dedicated Breast [18F]FDG PET/MRI in Breast Cancer.Cancers (Basel). 2023 Jan 7;15(2):401. doi: 10.3390/cancers15020401. Cancers (Basel). 2023. PMID: 36672354 Free PMC article.
-
Non-contrast Breast MR Imaging.Radiol Clin North Am. 2024 Jul;62(4):661-678. doi: 10.1016/j.rcl.2023.12.009. Epub 2024 Mar 7. Radiol Clin North Am. 2024. PMID: 38777541 Free PMC article. Review.
-
Breast Multiparametric MRI for Prediction of Neoadjuvant Chemotherapy Response in Breast Cancer: The BMMR2 Challenge.Radiol Imaging Cancer. 2024 Jan;6(1):e230033. doi: 10.1148/rycan.230033. Radiol Imaging Cancer. 2024. PMID: 38180338 Free PMC article.
-
Prediction of pathological complete response of breast cancer patients who received neoadjuvant chemotherapy with a nomogram based on clinicopathologic variables, ultrasound, and MRI.Br J Radiol. 2024 Jan 23;97(1153):228-236. doi: 10.1093/bjr/tqad014. Br J Radiol. 2024. PMID: 38263817 Free PMC article.
-
Monoexponential, biexponential, stretched exponential and diffusion kurtosis models of diffusion-weighted imaging: a quantitative differentiation of solitary pulmonary lesion.BMC Med Imaging. 2024 Dec 20;24(1):346. doi: 10.1186/s12880-024-01537-5. BMC Med Imaging. 2024. PMID: 39707237 Free PMC article.
References
Publication types
LinkOut - more resources
Full Text Sources
Miscellaneous
