

Enhancement of stratum corneum lipid structure improves skin barrier function and protects against irritation in adults with dry, eczema-prone skin
- PMID: 34921679
- PMCID: PMC9321855
- DOI: 10.1111/bjd.20955
Enhancement of stratum corneum lipid structure improves skin barrier function and protects against irritation in adults with dry, eczema-prone skin
Abstract
Background: The skin of patients with atopic dermatitis is characterized by abnormal stratum corneum lipid levels. Consequently, the lamellar matrices are disrupted and skin barrier function is diminished, increasing skin sensitivity to irritants and allergens.
Objectives: To determine whether a cream containing ceramides, triglycerides and cholesterol in a multivesicular emulsion can reinforce the skin barrier and protect against skin irritation.
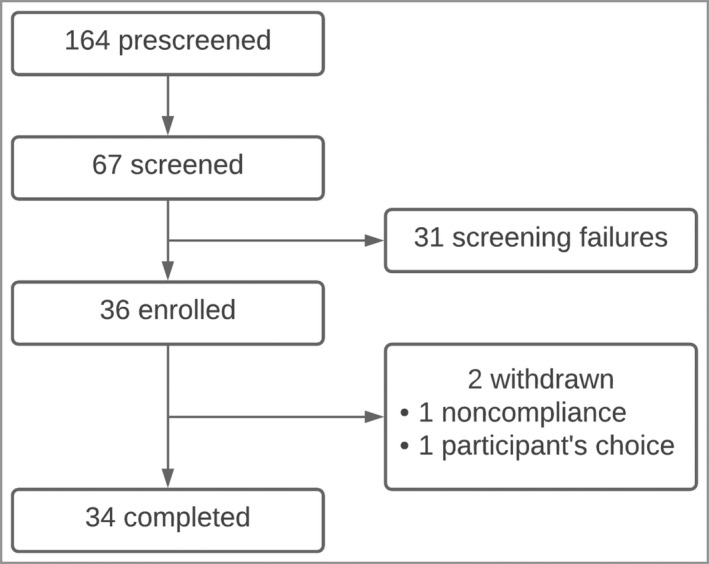
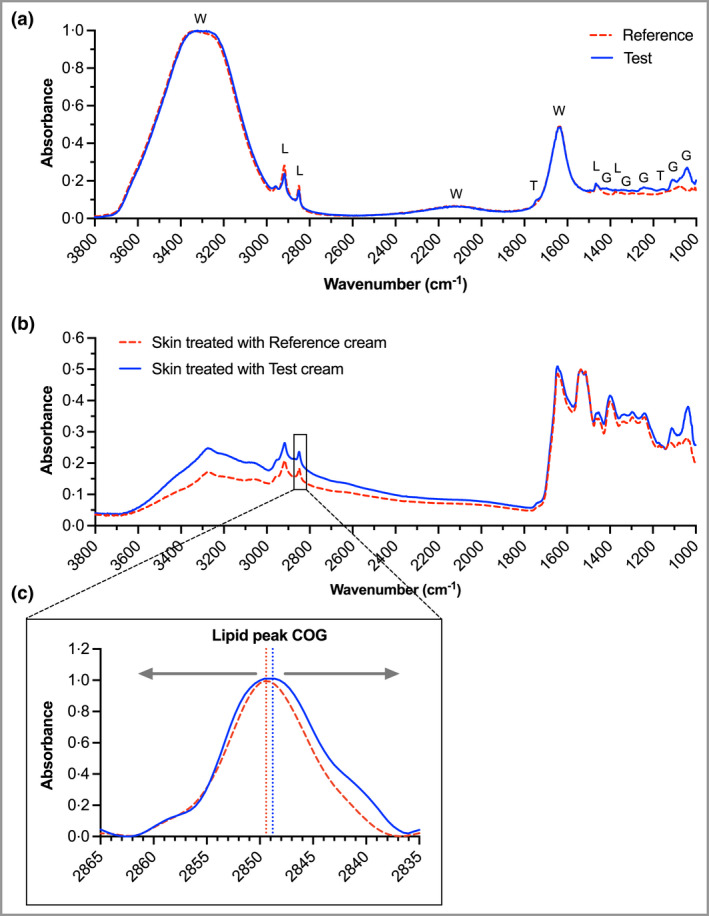
Methods: A randomized observer-blind intrapatient-controlled study in 34 adults with dry, eczema-prone skin was conducted. Each participant underwent 4 weeks of treatment with the test cream on one forearm and lower leg and a reference emollient cream on the other. Skin properties were determined before and after treatment. Lipid structure was assessed by Fourier-transform infrared spectroscopy using a novel interface.
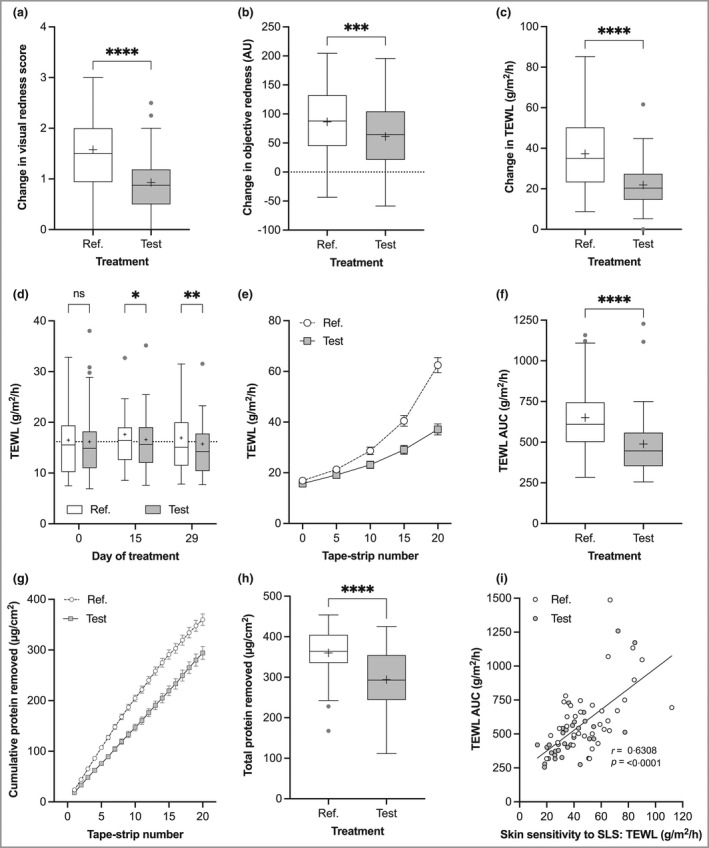
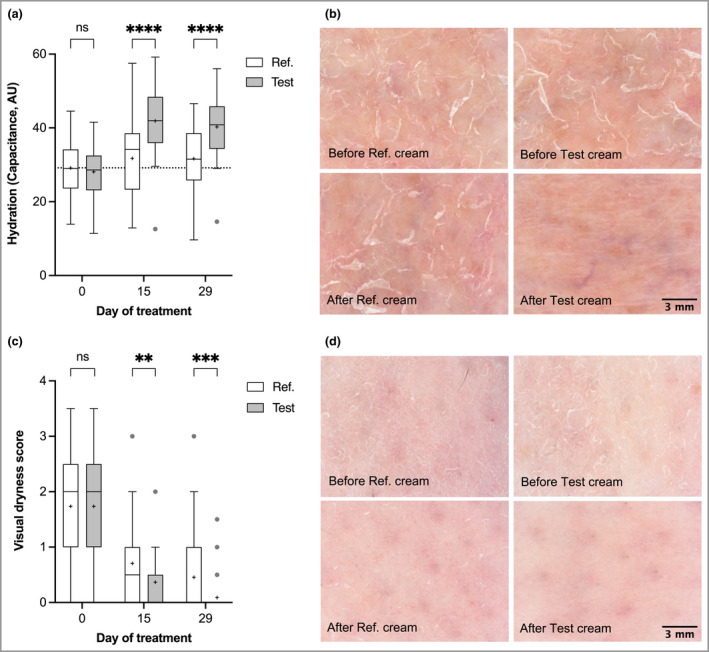
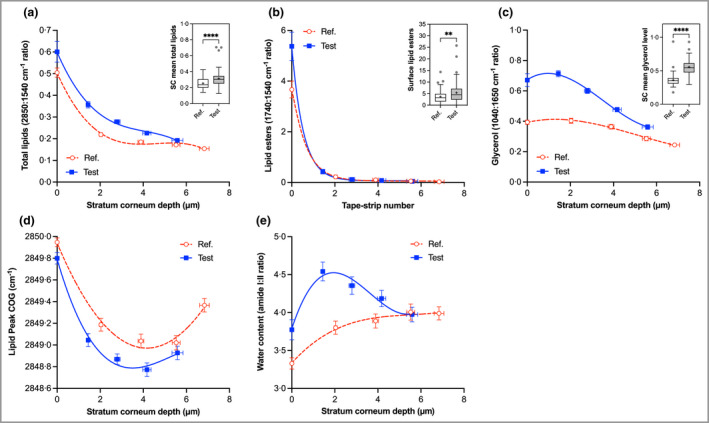
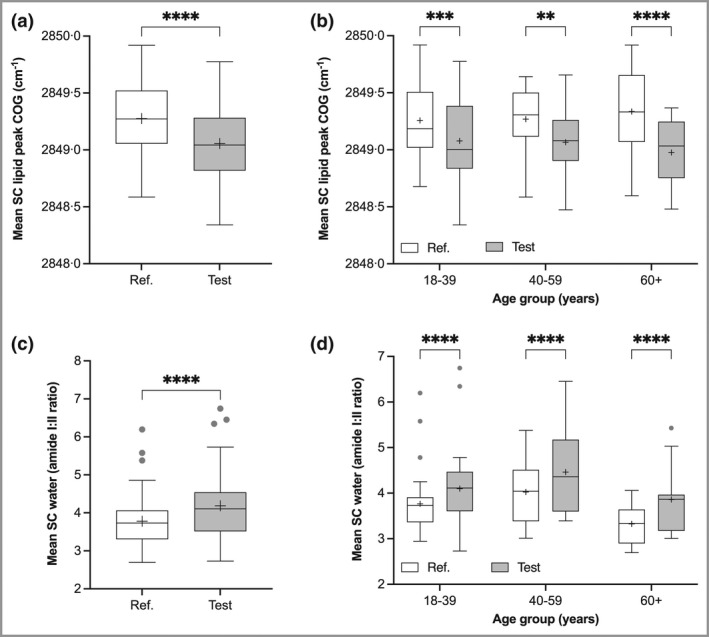
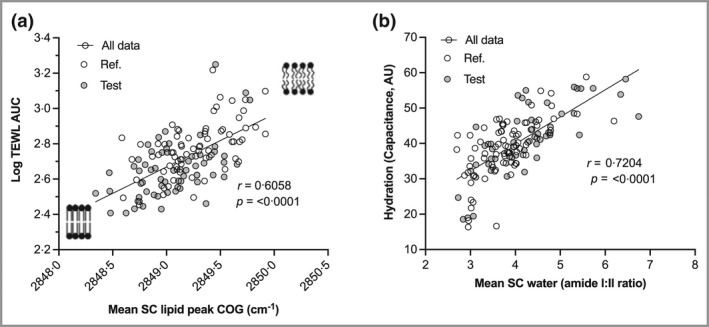
Results: Skin barrier integrity was greater at sites treated with the test cream [effect size for area under the transepidermal water loss curve -162, 95% confidence interval (CI) -206 to -118]. Skin sensitivity to sodium lauryl sulfate was reduced (-0·5 points visual redness, 97·57% CI -1·00 to -0·25), as was transepidermal water loss (-15·3 g m-2 h-1 , 95% CI -20·3 to -10·4) compared with the reference. Sites treated with the test cream displayed enhanced lipid chain ordering, which was significantly associated with skin barrier integrity (r = 0·61). Compared with the reference, treatment with the test cream increased hydration (8·61 capacitance units, 95% CI 6·61-10·6) and decreased signs of dryness.
Conclusions: The test cream facilitates skin barrier restoration and protects the skin from dryness and irritation. Compared with a commonly prescribed emollient in the UK, the test cream is highly suited to the management of dry, sensitive skin.
© 2022 The Authors. British Journal of Dermatology published by John Wiley & Sons Ltd on behalf of British Association of Dermatologists.
Figures
Comment in
-
Topical application of lipids to correct abnormalities in the epidermal lipid barrier.Br J Dermatol. 2022 May;186(5):764-765. doi: 10.1111/bjd.21294. Br J Dermatol. 2022. PMID: 35501940 Free PMC article.
Similar articles
-
Different types of emollient cream exhibit diverse physiological effects on the skin barrier in adults with atopic dermatitis.Clin Exp Dermatol. 2022 Jun;47(6):1154-1164. doi: 10.1111/ced.15141. Epub 2022 Apr 12. Clin Exp Dermatol. 2022. PMID: 35167133 Free PMC article. Clinical Trial.
-
A functional mechanistic study of the effect of emollients on the structure and function of the skin barrier.Br J Dermatol. 2016 Nov;175(5):1011-1019. doi: 10.1111/bjd.14684. Epub 2016 Aug 23. Br J Dermatol. 2016. PMID: 27097823 Clinical Trial.
-
An Investigation of the Skin Barrier Restoring Effects of a Cream and Lotion Containing Ceramides in a Multi-vesicular Emulsion in People with Dry, Eczema-Prone, Skin: The RESTORE Study Phase 1.Dermatol Ther (Heidelb). 2020 Oct;10(5):1031-1041. doi: 10.1007/s13555-020-00426-3. Epub 2020 Jul 15. Dermatol Ther (Heidelb). 2020. PMID: 32671664 Free PMC article.
-
Patient acceptability, efficacy, and skin biophysiology of a cream and cleanser containing lipid complex with shea butter extract versus a ceramide product for eczema.Hong Kong Med J. 2015 Oct;21(5):417-25. doi: 10.12809/hkmj144472. Epub 2015 Aug 28. Hong Kong Med J. 2015. PMID: 26314567 Review.
-
Biophysical properties of dry atopic and normal skin with special reference to effects of skin care products.Acta Derm Venereol Suppl (Stockh). 1995;192:1-48. doi: 10.2340/00015555192148. Acta Derm Venereol Suppl (Stockh). 1995. PMID: 7653198 Review.
Cited by
-
The Application of Nanogels as Efficient Drug Delivery Platforms for Dermal/Transdermal Delivery.Gels. 2023 Sep 15;9(9):753. doi: 10.3390/gels9090753. Gels. 2023. PMID: 37754434 Free PMC article. Review.
-
A Novel Natural Penetration Enhancer for Transdermal Drug Delivery: In Vitro/In Vivo Evaluation and Penetration Enhancement Mechanism.Pharmaceutics. 2025 Feb 14;17(2):254. doi: 10.3390/pharmaceutics17020254. Pharmaceutics. 2025. PMID: 40006621 Free PMC article.
-
Looking into the Skin in Health and Disease: From Microscopy Imaging Techniques to Molecular Analysis.Int J Mol Sci. 2023 Sep 6;24(18):13737. doi: 10.3390/ijms241813737. Int J Mol Sci. 2023. PMID: 37762038 Free PMC article.
-
Cananga odorata (Ylang-Ylang) Essential Oil Containing Nanoemulgel for the Topical Treatment of Scalp Psoriasis and Dandruff.Gels. 2024 Apr 30;10(5):303. doi: 10.3390/gels10050303. Gels. 2024. PMID: 38786220 Free PMC article.
-
Epicutaneous Sensitization and Food Allergy: Preventive Strategies Targeting Skin Barrier Repair-Facts and Challenges.Nutrients. 2023 Feb 21;15(5):1070. doi: 10.3390/nu15051070. Nutrients. 2023. PMID: 36904070 Free PMC article. Review.
References
-
- Schurer NY, Elias PM. The biochemistry and function of stratum corneum lipids. Adv Lipid Res 1991; 24:27–56. - PubMed
-
- Meguro S, Arai Y, Masukawa Y et al. Relationship between covalently bound ceramides and transepidermal water loss (TEWL). Arch Dermatol Res 2000; 292:463–8. - PubMed
-
- Damien F, Boncheva M. The extent of orthorhombic lipid phases in the stratum corneum determines the barrier efficiency of human skin in vivo . J Invest Dermatol 2010; 130:611–14. - PubMed
-
- Proksch E, Jensen JM, Elias PM. Skin lipids and epidermal differentiation in atopic dermatitis. Clin Dermatol 2003; 21:134–44. - PubMed
-
- Di Nardo A, Wertz P, Giannetti A, Seidenari S. Ceramide and cholesterol composition of the skin of patients with atopic dermatitis. Acta Derm Venereol 1998; 78:27–30. - PubMed
Publication types
MeSH terms
Substances
Grants and funding
LinkOut - more resources
Full Text Sources
Medical
