. 2022 Feb 16;110(4):627-643.e9.
doi: 10.1016/j.neuron.2021.11.025. Epub 2021 Dec 17.

Shed CNTNAP2 ectodomain is detectable in CSF and regulates Ca2+ homeostasis and network synchrony via PMCA2/ATP2B2

Affiliations

Shed CNTNAP2 ectodomain is detectable in CSF and regulates Ca2+ homeostasis and network synchrony via PMCA2/ATP2B2

M Dolores Martín-de-Saavedra et al. Neuron. .

Abstract

Although many neuronal membrane proteins undergo proteolytic cleavage, little is known about the biological significance of neuronal ectodomain shedding (ES). Here, we show that the neuronal sheddome is detectable in human cerebrospinal fluid (hCSF) and is enriched in neurodevelopmental disorder (NDD) risk factors. Among shed synaptic proteins is the ectodomain of CNTNAP2 (CNTNAP2-ecto), a prominent NDD risk factor. CNTNAP2 undergoes activity-dependent ES via MMP9 (matrix metalloprotease 9), and CNTNAP2-ecto levels are reduced in the hCSF of individuals with autism spectrum disorder. Using mass spectrometry, we identified the plasma membrane Ca2+ ATPase (PMCA) extrusion pumps as novel CNTNAP2-ecto binding partners. CNTNAP2-ecto enhances the activity of PMCA2 and regulates neuronal network dynamics in a PMCA2-dependent manner. Our data underscore the promise of sheddome analysis in discovering neurobiological mechanisms, provide insight into the biology of ES and its relationship with the CSF, and reveal a mechanism of regulation of Ca2+ homeostasis and neuronal network synchrony by a shed ectodomain.

Keywords: CNTNAP2; autism; bioinformatics; calcium; cerebrospinal fluid; ectodomain shedding; network dynamics; proteomics; schizophrenia; sheddome.


Conflict of interest statement

Declaration of interests The authors declare no competing interests.

Figures
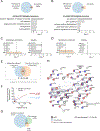
Figure 1.
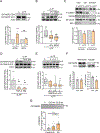
Figure 1.. Computational analysis of the neuronal and hCSF sheddomes.
A. Venn diagram of proteins from in vitro neuronal secretome (n=300) and its membrane anchored subset (n=178) susceptible to ES. GO analysis of the neuronal sheddome. B. Venn diagram showing that 161 of the 610 proteins detected in hCSF could potentially undergo ES. GO analysis of membrane-anchored proteins in the hCSF. C. Enrichment of proteins encoded by disease-relevant genes in the membrane-anchored but not the soluble secretome fraction. D. Enrichment of SZ- and ASD-related genes in the membrane-anchored fraction of hCSF. E. Hypergeometric testing shows a highly significant overlap between the neuronal sheddome in vitro and the hCSF sheddome (orange). F. Spectral counts of membrane-anchored proteins in the neuronal secretome are significantly correlated with the hCSF (P=0.043), while those in the soluble protein fraction are not (P=0.1391). G. Venn diagram defining the synaptic sheddome. H. PPI network of the 54 proteins in the synaptic sheddome.
Figure 2.
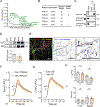
Figure 2.. CNTNAP2 undergoes ectodomain shedding.
A. Western blots of mouse cortex membrane fraction (Mb), hCSF, and mCSF using N-term and C-term CNTNAP2 antibodies. B. Membrane and soluble fractions of Cntnap2 WT and KO mouse cortex. Positive control is CNTNAP2-ecto produced in N2a cells. C. Western blots show both termini of CNTNAP2 in the whole cell lysates (WCL) from WT dissociated neurons but only N-term signal in the extracellular media (ECM); bands are absent from Cntnap2 KO neurons. D. ELISA of hCSF from unaffected controls and individuals with ASD (n=11–17; control vs. ASD t-test, *P=0.0478). Data are mean ± SEM.
Figure 3.
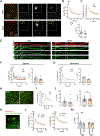
Figure 3.. Spatial distribution of neuronal CNTNAP2 ectodomain shedding.
A. 3D reconstructions of confocal images of Cntnap2 KO neurons transfected with Flag-CNTNAP2 and GFP, immunostained for Flag under non-permeabilized conditions and for GFP and C-term CNTNAP2 under permeabilized conditions. Flag and C-term colocalized on the cell surface (blue arrowheads); in the perineuronal space, only the Flag signal showed (red arrowheads). B. Single plane confocal imaging of Cntnap2 KO and Flag-CNTNAP2 transfected Cntnap2 KO neurons stained for GFP, Flag, vGLUT1, and CNTNAP2 C-term antibodies. C. Analysis of all Flag mean fluorescence intensity outside of transfected cells or outside but overlapping with vGLUT1. Data are mean ± SEM, (n=10; 2-way ANOVA P<0.0001 +Tukey post hoc, # P<0.05).
Figure 4.
Figure 4.. Activity and MMP9-dependent CNTNAP2 ectodomain shedding.
A. cLTP increases CNTNAP2-ecto levels in the ECM; no changes occur in WCL (n=12, paired t-test, ***P<0.0001; WCL: n=15, paired t-test, nsP=0.1780). B. APV and NBQX block cLTP-induced CNTNAP2-ecto shedding (n=6–9; control (C) vs. cLTP Wilcoxon test, **P=0.039; cLTP vs. NBQX/APV Kruskal-Wallis **P=0.0083 + Dunn’s post hoc, #P=0.00387, ##P=0.0089). C. Subcellular fractionation of rat cortical neuron cultures shows that N-term CNTNAP2 levels decrease in the synaptic fraction after cLTP (n=3–4; Synaptic C vs. cLTP paired t-test, *P=0.026; extrasynaptic C vs. cLTP paired t-test, P=0.62). D. Activity-dependent CNTNAP2-ecto shedding is prevented by incubation with TAPI-0 and GM6001 (n=7; C vs. cLTP paired t-test, **P=0.0092; C vs. TAPI Wilcoxon test, *P=0.0313, C vs. GM Wilcoxon test, *P=0.015; cLTP vs. TAPI/GM Friedman test P=0.0012 + Dunn’s post hoc, ## P<0.01). E. MMP9 inhibitor I decreases CNTNAP2-ecto shedding upon cLTP (n=5–9; C vs. cLTP paired t-test, **P<0.0016; cLTP vs. MMP9 inhibitor I Kruskal-Wallis P=0.022 + Dunn’s post hoc, #P<0.05). F. Intraperitoneal administration of GM6001 (100 mg/kg) decreases CNTNAP2 levels in soluble but not in membrane fractions of mouse cortex (n=7–6, t-test, *P=0.011). G. Western blot analysis of CNTNAP2-ecto in rat CSF collected 4 and 8h following electroconvulsive shock (ECS), as compared to non-ECS controls (n=14–18, one-way ANOVA, ***P=0.0004 + Tukey’s post hoc ***P=0.0003, *P=0.0225. Data are presented as mean ± SEM (A, C, D, F, G) or as box plots, with highest and lowest levels shown by error bars (B, E).
Figure 5.
Figure 5.. Activity regulates synaptic CNTNAP2-ecto shedding.
A. Cntnap2 KO neurons transfected with GFP and Flag-CNTNAP2 were subjected to cLTP treatment, then imaged using SIM. Flag colocalized with vGLUT1 outside neurons (yellow arrowheads) and within neuronal outlines (white arrows). B. Number of CNTNAP2-ecto puncta in the extracellular compartment (5 um region outside GFP outline) (n=17–18 neurons, N=2 cultures, 2–3 coverslips/condition/culture. Mann-Whitney test, **P=0.0058). C. Normalized number of puncta defined by CNTNAP2-ecto and vGLUT1 overlap in the extracellular compartment (n=17–18 neurons, N=2 cultures, 2–3 coverslips/condition/culture, **P=0.0042). D. SIM image analysis without (left) or with (right) cLTP shows a decrease in CNTNAP2-ecto in synaptic regions. E. Area occupied by CNTNAP2-ecto in the GFP compartment (n=20–22 neurons, N=3 cultures, 2 coverslips/condition/culture, Mann-Whitney test, P=0.12; # of puncta in GFP, t-test, P=0.1632). F. Area occupied by CNTNAP2-ecto and number of puncta in the synaptic regions (Mann-Whitney test, **P=0.006; # of puncta in synapses, *P=0.024). Data are presented as mean ± SEM (C) or as box plots, with highest and lowest levels shown by error bars (B, E, F).
Figure 6.
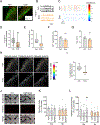
Figure 6.. CNTNAP2-ecto is a binding partner and activator of PMCA2.
A. Fold enrichment of rank-ordered prey proteins detected by LC-MS/MS; ASD-related risk factors and CNTN1 are highlighted in green. B. Enrichment, spectral counts and SFARI score of CNTN1 and the 4 isoforms of PMCA detected by LC-MS/MS. C. Interaction between endogenous CNTNAP2-ecto and PMCA2 in mouse cortical membranes assessed by co-IP and western blotting. D. PMCA2 protein levels in Cntnap2 WT and KO mice over time (n=3, t-test, *P=0.0349). E. Relative distribution of Flag and endogenous PMCA2 immunofluorescence in Cntnap2 KO neurons transfected with Flag-CNTNAP2 and GFP. Colocalization (blue) shown relative to the cell outline. Black arrowheads indicate colocalization within dendritic regions, open arrowheads indicate colocalization outside of the neuron of origin. F-G. Ca2+ curves elicited by ATP in PMCA2-transfected or non-transfected (NT) HEK293 cells in the presence or absence of CNTNAP2-ecto. Veh, vehicle control. H. t1/2 off analysis of the Ca2+ curve elicited by ATP in the presence or absence of CNTNAP2-ecto in PMCA2 transfected and NT HEK cells (N=6 cultures, n=13 dishes, one-way ANOVA, ***P<0.0001; Newman-Keuls post-hoc, *P<0.05). I. Comparison of tauon in the ascending phase of the Ca2+ curve elicited by ATP (Kruskal-Wallis test, ***P=0.0004; Dunn’s post-hoc, nsP>0.05). All data are mean±SEM.
Figure 7.
Figure 7.. CNTNAP2-ecto enhances Ca2+ extrusion.
A. Epifluorescence images of dissociated rat neurons transfected with the Ca2+ indicator GCaMP6s and the cell-fill DsRedExpress2, preincubated with vehicle and CNTNAP2-ecto, imaged before and after KCl treatment. B. Average traces of KCl-elicited Ca2+ signals in somas with or without CNTNAP2-ecto incubation. C. Ca2+ decay phase normalized to maximal amplitude. D. t1/2 off values of KCl-elicited Ca2+ peaks (N=5 cultures, n=35/28 neurons, t1/2 off Mann-Whitney test, **P=0.0027). E. Confocal images of dendrites of rat neurons transfected with GCaMP6s and DsRedExpress2, preincubated with vehicle or CNTNAP2-ecto, imaged after KCl treatment; spines are shown in insets. F. Representative traces of KCl-elicited Ca2+ peaks in dendritic spines in CNTNAP2-ecto or vehicle-treated neurons. Bar graphs show a decrease in Ca2+ t1/2 off after ecto treatment (Mann-Whitney test, N=4 cultures, n=66/49 spines and 8–9 coverslips/condition, **P=0.077). G. Representative Ca2+ traces in dendritic shaft in CNTNAP2-ecto or vehicle-treated neurons. Bar graph shows decreased t1/2 off in ecto-treated neurons (t-test, N=4 cultures, and n=9 coverslips/condition, *P=0.044). H. Multiphoton images showing cytosolic Ca2+ indicator Cal520 fluorescence in green and glial indicator SR-101 in red. I. KCl-elicited Ca2+ curves in brain slices treated with vehicle or CNTNAP2-ecto. J. Analysis of t1/2 off (n=140/153 neurons, Mann-Whitney test, ***P=0.0004) and tauon (n=117/116 neurons, Mann-Whitney test, nsP=0.058). K. Epifluorescence image of neurons infected with AAV-pSyn-GCaMP6f, transfected with mCherry PMCA2 shRNA. L. Average traces of KCl-elicited Ca2+ peaks in neurons expressing scrambled shRNA (Scr) or shPMCA2, preincubated with CNTNAP2-ecto or boiled CNTNAP2-ecto. M. t1/2 off analysis (N= 1 culture, n=31 neurons, 2-way ANOVA + Tukey’s post hoc, *P=0.034). Data are mean±SEM (F, G, K, N) or box plots, with highest and lowest levels shown by error bars (D).
Figure 8.
Figure 8.. CNTNAP2-ecto regulates neuronal network synchrony.
A. Ca2+ indicator Cal520 (green) and the glial dye SR-101 (red) in the CA3 region of the hippocampus. B. Spontaneous Ca2+ signals from three neurons (from same coverslip) from vehicle-treated (black) and CNTNAP2-ecto-treated (orange) slices. C. Raster plot of Ca2+ bursts over time in the hippocampus, color coded for degree of synchrony (warmer colors correspond to increased synchrony). D. Fraction of synchronized transients in CNTNAP2-ecto and vehicle treated slices (n=264/328 neurons, Mann-Whitney test, **P<0.0001). E. Analysis of network burst frequency (number of events/5 min) after vehicle or ecto incubation (n=7–8 slices, N=7 mice. Mann-Whitney test, *P=0.0140). F. Ca2+ firing frequency in vehicle and ecto treated slices (n=7/8, t-test, P=0.16). G. Amplitude of the Ca2+ peaks (n=7/8, t-test, P=0.25). H. Color-coded percentage of active cells in an individual Ca2+ burst of activity in three representative spontaneous network events occurring in the same slice in vehicle-treated or ecto-treated conditions. I. Percentage of coactive neurons during a Ca2+ burst in vehicle- or ecto-treated slices (n=810/871 neurons, Mann-Whitney test, *P=0.014). J. Bright-field and mCherry immunofluorescence images of neuronal cultures on MEA plates with neurons infected with virus expressing Scr or shPMCA2. K. Synchrony index analysis of Scr or shPMCA2-expressing neurons cultured on MEA plates and treated with vehicle, ecto or boiled ecto (n=26–30 wells, N=6 different cultures, 2-way ANOVA P=0.0463, Tukey post-hoc test, **P=0.0034). L. Network burst frequency (n=23–29 wells, N=6 different cultures, 2-way ANOVA P=0.2320, Tukey post-hoc test, **P=0.0032 ##P=0.0043). Data are mean±SEM (F, G, K, L) or box plots, with highest and lowest levels shown by error bars (D, E, I).

References

    1. Alford ST, and Alpert MH (2014). A synaptic mechanism for network synchrony. Front Cell Neurosci 8, 290. 10.3389/fncel.2014.00290. - DOI - PMC - PubMed
    1. Altmeppen HC, Prox J, Krasemann S, Puig B, Kruszewski K, Dohler F, Bernreuther C, Hoxha A, Linsenmeier L, Sikorska B, et al. (2015). The sheddase ADAM10 is a potent modulator of prion disease. Elife 4. 10.7554/eLife.04260. - DOI - PMC - PubMed
    1. Bakkaloglu B, O’Roak BJ, Louvi A, Gupta AR, Abelson JF, Morgan TM, Chawarska K, Klin A, Ercan-Sencicek AG, Stillman AA, et al. (2008). Molecular cytogenetic analysis and resequencing of contactin associated protein-like 2 in autism spectrum disorders. Am J Hum Genet 82, 165–173. 10.1016/j.ajhg.2007.09.017. - DOI - PMC - PubMed
    1. Bayes A, Collins MO, Croning MD, van de Lagemaat LN, Choudhary JS, and Grant SG (2012). Comparative study of human and mouse postsynaptic proteomes finds high compositional conservation and abundance differences for key synaptic proteins. PLoS One 7, e46683. 10.1371/journal.pone.0046683. - DOI - PMC - PubMed
    1. Bereczki E, Bogstedt A, Hoglund K, Tsitsi P, Brodin L, Ballard C, Svenningsson P, and Aarsland D (2017). Synaptic proteins in CSF relate to Parkinson’s disease stage markers. NPJ Parkinsons Dis 3, 7. 10.1038/s41531-017-0008-2. - DOI - PMC - PubMed

Publication types

MeSH terms

Substances