

Modeling the number of people infected with SARS-COV-2 from wastewater viral load in Northwest Spain
- PMID: 34921882
- PMCID: PMC8674110
- DOI: 10.1016/j.scitotenv.2021.152334
Modeling the number of people infected with SARS-COV-2 from wastewater viral load in Northwest Spain
Abstract
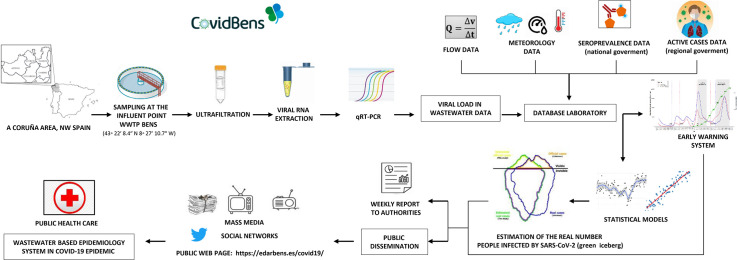
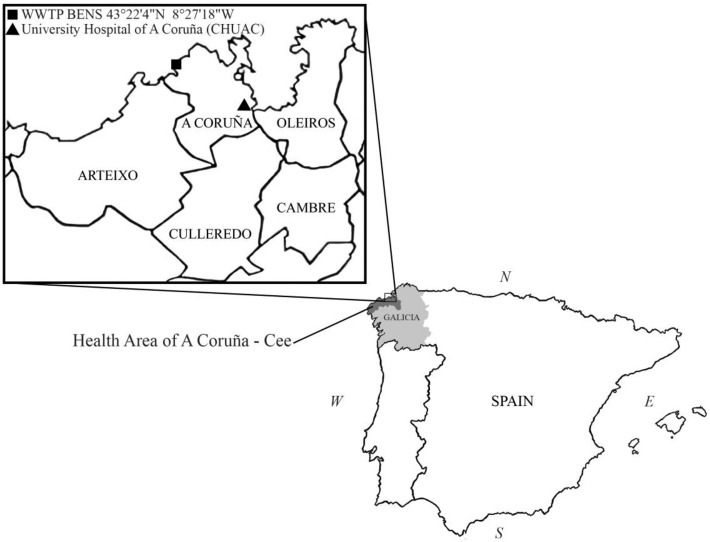
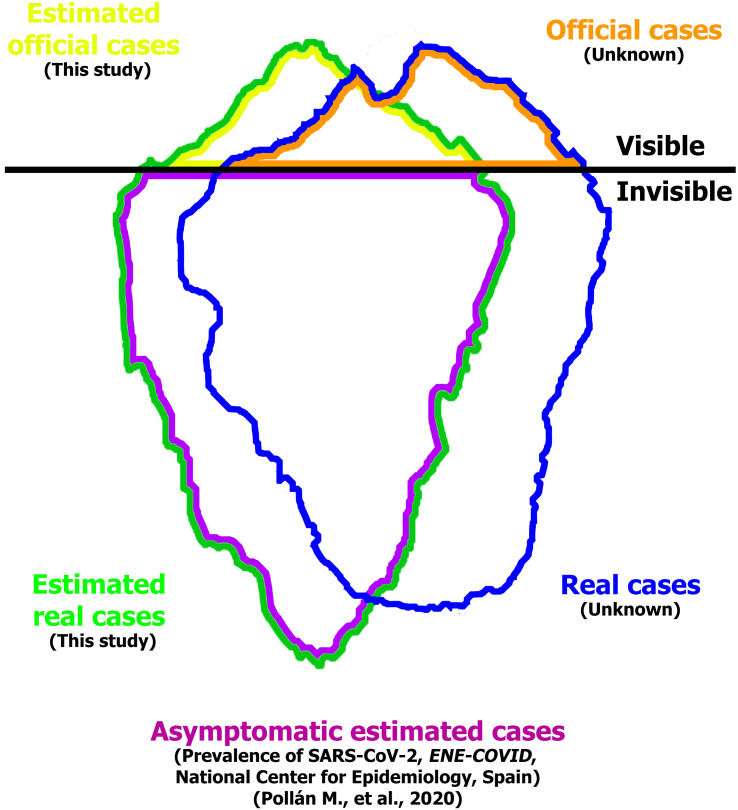
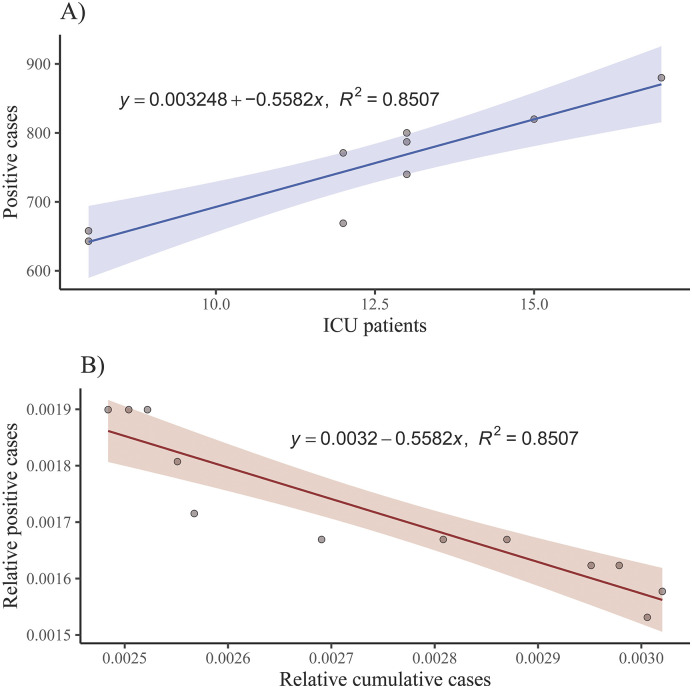
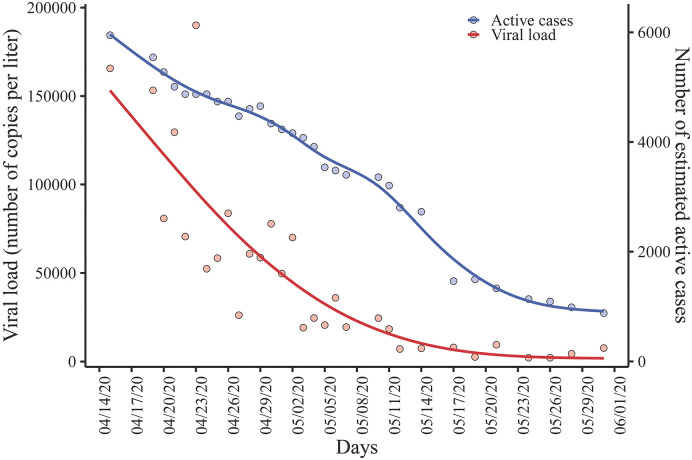
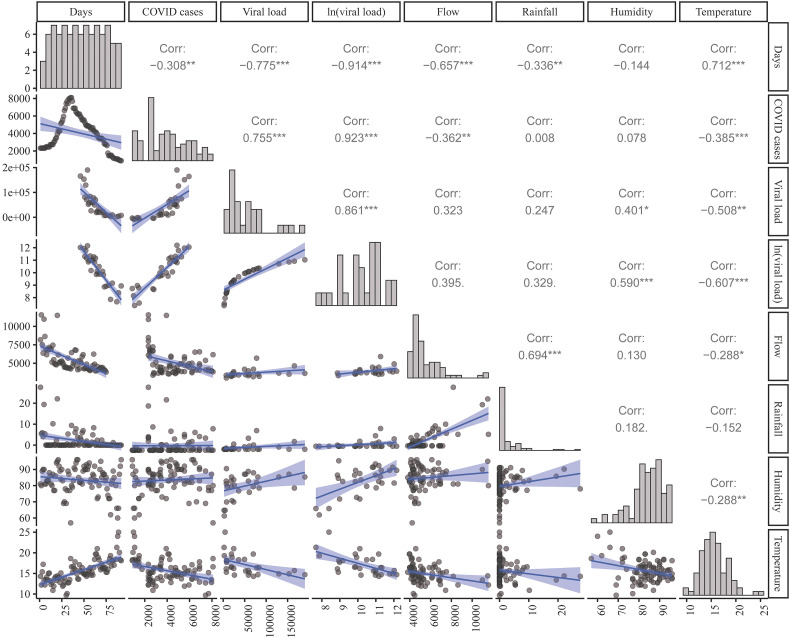
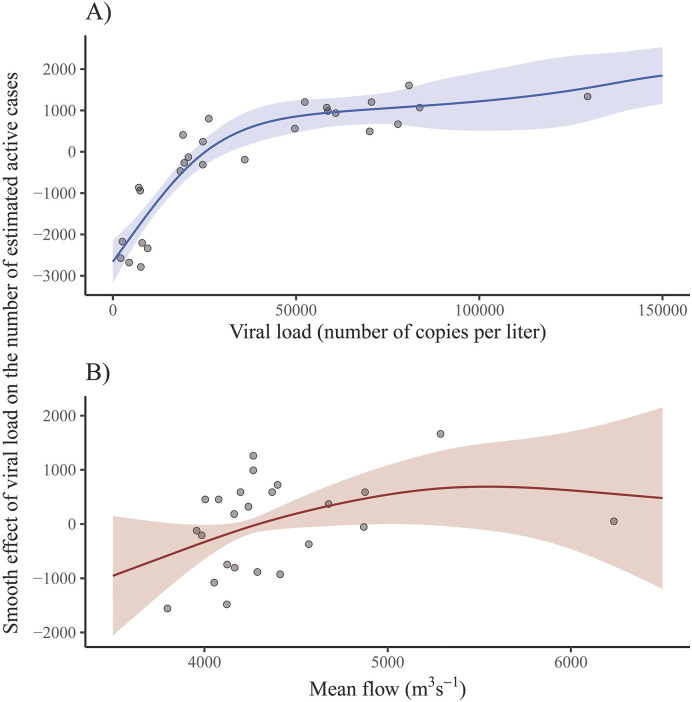
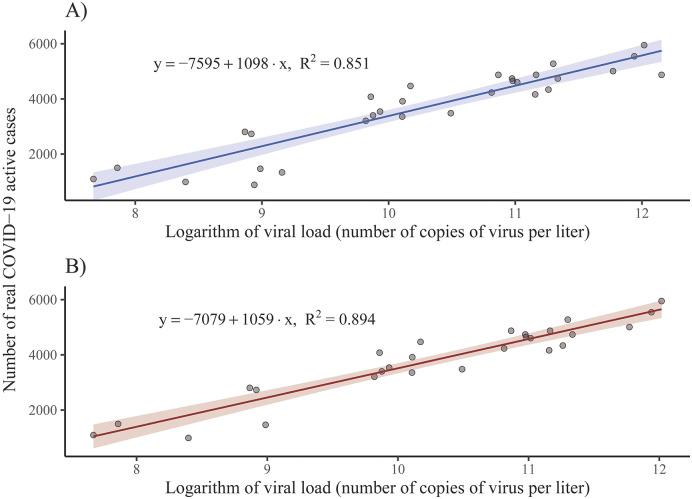
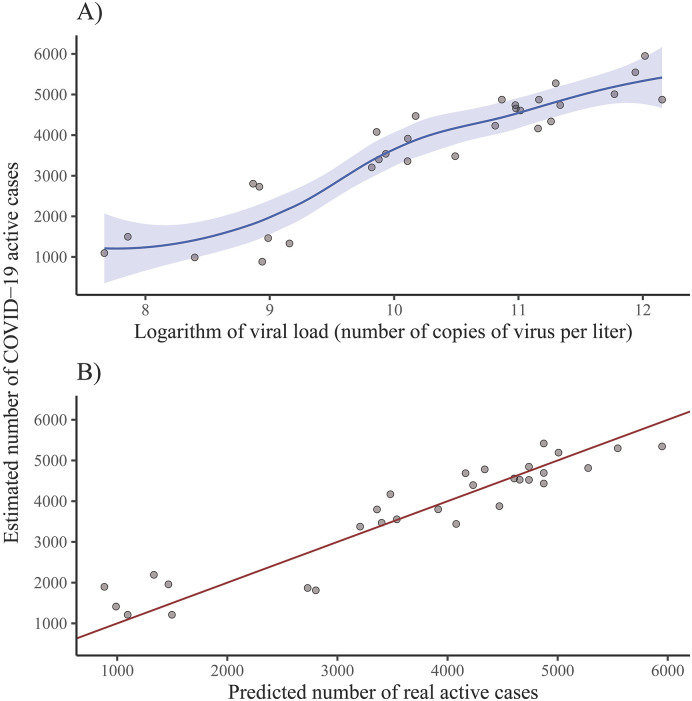
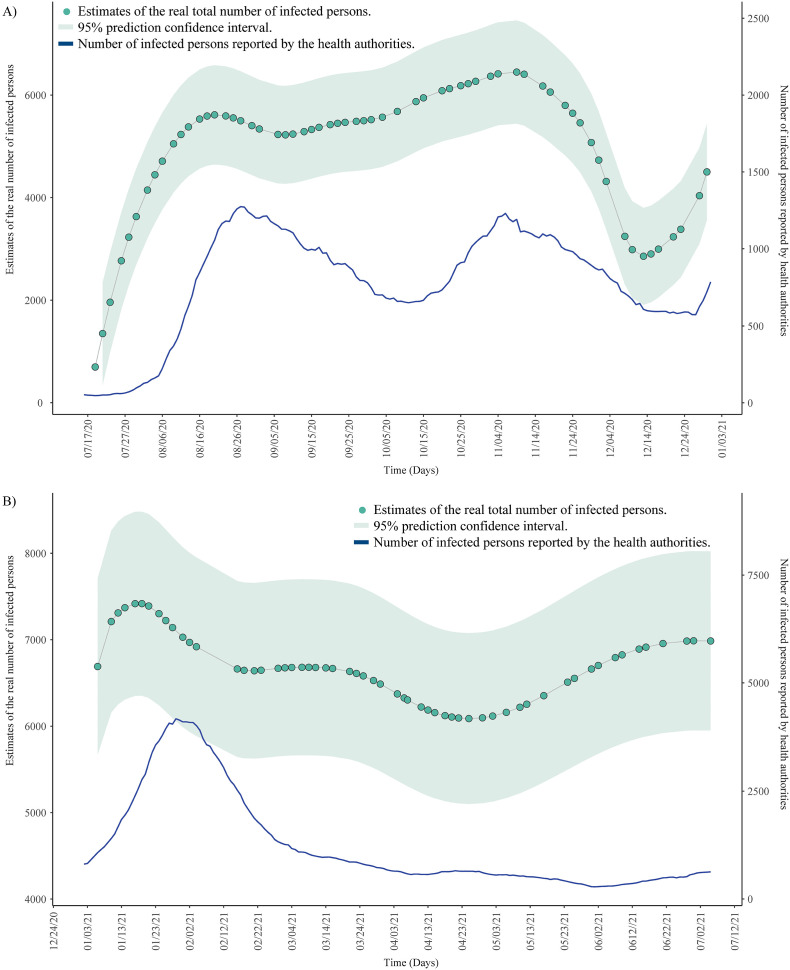
The quantification of the SARS-CoV-2 RNA load in wastewater has emerged as a useful tool to monitor COVID-19 outbreaks in the community. This approach was implemented in the metropolitan area of A Coruña (NW Spain), where wastewater from a treatment plant was analyzed to track the epidemic dynamics in a population of 369,098 inhabitants. Viral load detected in the wastewater and the epidemiological data from A Coruña health system served as main sources for statistical models developing. Regression models described here allowed us to estimate the number of infected people (R2 = 0.9), including symptomatic and asymptomatic individuals. These models have helped to understand the real magnitude of the epidemic in a population at any given time and have been used as an effective early warning tool for predicting outbreaks in A Coruña municipality. The methodology of the present work could be used to develop a similar wastewater-based epidemiological model to track the evolution of the COVID-19 epidemic anywhere in the world where centralized water-based sanitation systems exist.
Keywords: COVID–19; Generalized Additive Models (GAM); Kernel smoothing; LOESS; SARS-CoV-2; Wastewater-based epidemiology.
Copyright © 2021 The Authors. Published by Elsevier B.V. All rights reserved.
Conflict of interest statement
Declaration of competing interest The authors declare that they have no known competing financial interests or personal relationships that could have appeared to influence the work reported in this paper.
Figures
Similar articles
-
Wastewater early warning system for SARS-CoV-2 outbreaks and variants in a Coruña, Spain.Environ Sci Pollut Res Int. 2023 Jul;30(32):79315-79334. doi: 10.1007/s11356-023-27877-3. Epub 2023 Jun 7. Environ Sci Pollut Res Int. 2023. PMID: 37286834 Free PMC article.
-
Prediction of COVID-19 positive cases, a nation-wide SARS-CoV-2 wastewater-based epidemiology study.Water Res. 2023 Mar 1;231:119617. doi: 10.1016/j.watres.2023.119617. Epub 2023 Jan 18. Water Res. 2023. PMID: 36682239 Free PMC article.
-
Age-dependent association between SARS-CoV-2 cases reported by passive surveillance and viral load in wastewater.Sci Total Environ. 2021 Oct 20;792:148442. doi: 10.1016/j.scitotenv.2021.148442. Epub 2021 Jun 15. Sci Total Environ. 2021. PMID: 34147797 Free PMC article.
-
Site Specific Relationships between COVID-19 Cases and SARS-CoV-2 Viral Load in Wastewater Treatment Plant Influent.Environ Sci Technol. 2021 Nov 16;55(22):15276-15286. doi: 10.1021/acs.est.1c05029. Epub 2021 Nov 5. Environ Sci Technol. 2021. PMID: 34738785
-
Wastewater, waste, and water-based epidemiology (WWW-BE): A novel hypothesis and decision-support tool to unravel COVID-19 in low-income settings?Sci Total Environ. 2022 Feb 1;806(Pt 3):150680. doi: 10.1016/j.scitotenv.2021.150680. Epub 2021 Sep 30. Sci Total Environ. 2022. PMID: 34599955 Free PMC article. Review.
Cited by
-
Statistical Analysis of SARS-CoV-2 Using Wastewater-Based Data of Stockholm, Sweden.Int J Environ Res Public Health. 2023 Feb 26;20(5):4181. doi: 10.3390/ijerph20054181. Int J Environ Res Public Health. 2023. PMID: 36901194 Free PMC article.
-
Multi-scale wastewater surveillance at a Bangkok tertiary care hospital: A potential sentinel site for real-time COVID-19 surveillance at hospital and national levels.PLOS Glob Public Health. 2025 Apr 8;5(4):e0004256. doi: 10.1371/journal.pgph.0004256. eCollection 2025. PLOS Glob Public Health. 2025. PMID: 40198609 Free PMC article.
-
Viral RNA in City Wastewater as a Key Indicator of COVID-19 Recrudescence and Containment Measures Effectiveness.Front Microbiol. 2021 May 17;12:664477. doi: 10.3389/fmicb.2021.664477. eCollection 2021. Front Microbiol. 2021. PMID: 34079532 Free PMC article.
-
Estimating the prevalence of COVID-19 cases through the analysis of SARS-CoV-2 RNA copies derived from wastewater samples from North Dakota.Glob Epidemiol. 2023 Oct 12;6:100124. doi: 10.1016/j.gloepi.2023.100124. eCollection 2023 Dec. Glob Epidemiol. 2023. PMID: 37881481 Free PMC article.
-
Recent progress on wastewater-based epidemiology for COVID-19 surveillance: A systematic review of analytical procedures and epidemiological modeling.Sci Total Environ. 2023 Jun 20;878:162953. doi: 10.1016/j.scitotenv.2023.162953. Epub 2023 Mar 21. Sci Total Environ. 2023. PMID: 36948304 Free PMC article.
References
-
- Ahmed W., Angel N., Edson J., Bibby K., Bivins A., O’Brien J.W., Choi P.M., Kitajima M., Simpson S.L., Li J., et al. First confirmed detection of SARS-CoV-2 in untreated wastewater in Australia: a proof of concept for the wastewater surveillance of COVID-19 in the community. Sci. Total Environ. 2020;728 - PMC - PubMed
-
- Ahmed W., Simpson S.L., Bertsch P.M., Bibby K., Bivins A., Blackall L.L, Bofill-Mas S., Bosch A., Brandão J., Choi P.M., et al. Minimizing errors in RT-PCR detection and quantification of SARS-CoV-2 RNA for wastewater surveillance. Sci. Total Environ. 2022;805 doi: 10.1016/j.scitotenv.2021.149877. - DOI - PMC - PubMed
MeSH terms
Substances
LinkOut - more resources
Full Text Sources
Medical
Miscellaneous
