. 2022:33:102912.
doi: 10.1016/j.nicl.2021.102912. Epub 2021 Dec 13.

Histogram analysis of tensor-valued diffusion MRI in meningiomas: Relation to consistency, histological grade and type

Affiliations

Histogram analysis of tensor-valued diffusion MRI in meningiomas: Relation to consistency, histological grade and type

Jan Brabec et al. Neuroimage Clin. 2022.

Abstract

Background: Preoperative radiological assessment of meningioma characteristics is of value for pre- and post-operative patient management, counselling, and surgical approach.

Purpose: To investigate whether tensor-valued diffusion MRI can add to the preoperative prediction of meningioma consistency, grade and type.

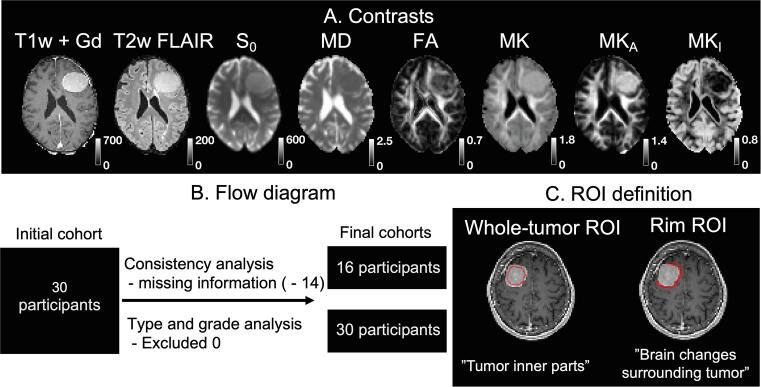
Materials and methods: 30 patients with intracranial meningiomas (22 WHO grade I, 8 WHO grade II) underwent MRI prior to surgery. Diffusion MRI was performed with linear and spherical b-tensors with b-values up to 2000 s/mm2. The data were used to estimate mean diffusivity (MD), fractional anisotropy (FA), mean kurtosis (MK) and its components-the anisotropic and isotropic kurtoses (MKA and MKI). Meningioma consistency was estimated for 16 patients during resection based on ultrasonic aspiration intensity, ease of resection with instrumentation or suction. Grade and type were determined by histopathological analysis. The relation between consistency, grade and type and dMRI parameters was analyzed inside the tumor ("whole-tumor") and within brain tissue in the immediate periphery outside the tumor ("rim") by histogram analysis.

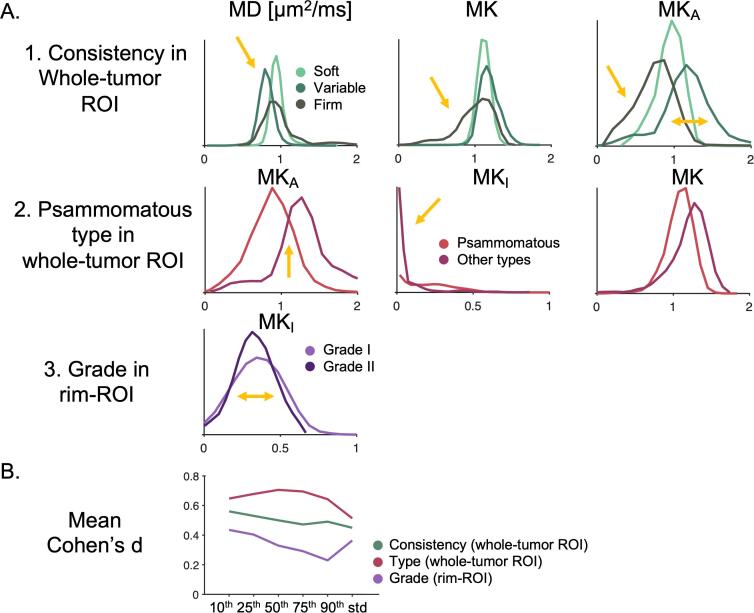
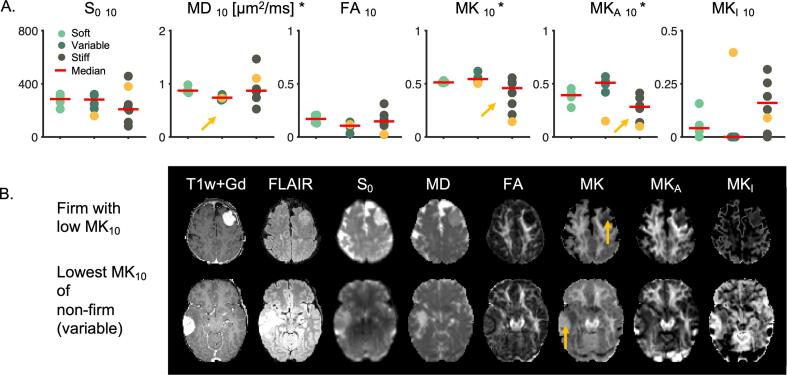
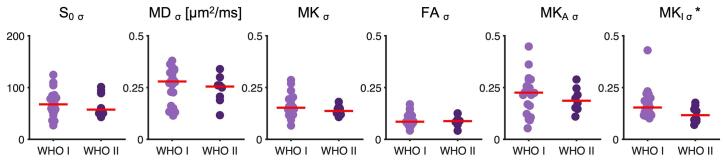
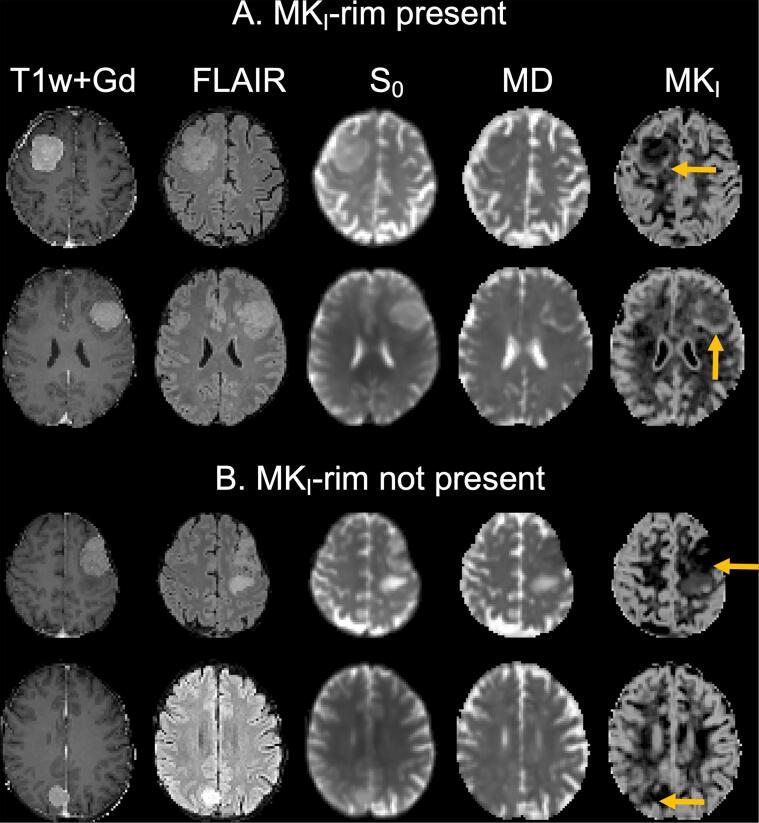
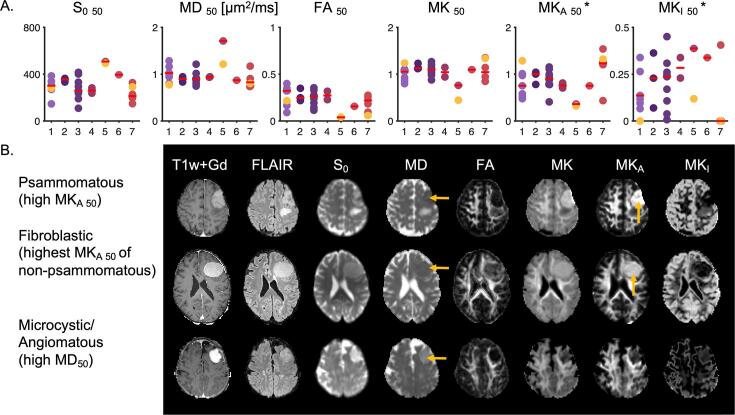
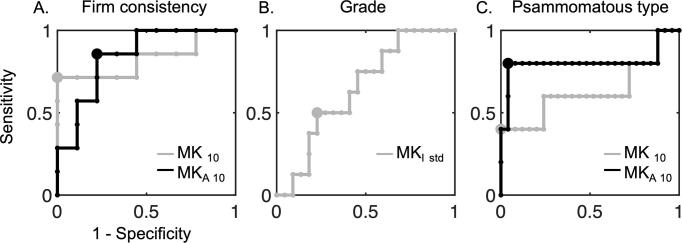
Results: Lower 10th percentiles of MK and MKA in the whole-tumor were associated with firm consistency compared with pooled soft and variable consistency (n = 7 vs 9; U test, p = 0.02 for MKA 10 and p = 0.04 for MK10) and lower 10th percentile of MD with variable against soft and firm (n = 5 vs 11; U test, p = 0.02). Higher standard deviation of MKI in the rim was associated with lower grade (n = 22 vs 8; U test, p = 0.04) and in the MKI maps we observed elevated rim-like structure that could be associated with grade. Higher median MKA and lower median MKI distinguished psammomatous type from other pooled meningioma types (n = 5 vs 25; U test; p = 0.03 for MKA 50 and p = 0.03 and p = 0.04 for MKI 50).

Conclusion: Parameters from tensor-valued dMRI can facilitate prediction of consistency, grade and type.

Keywords: Consistency; Diffusion MRI; Meningioma; Tensor-valued diffusion encoding; Tumor grade; Type.


Conflict of interest statement

The authors declare the following financial interests/personal relationships which may be considered as potential competing interests: M.N. declares ownership interests in Random Walk Imaging, and patent applications in Sweden (1250453-6 and 1250452-8), in the USA (61/642 594 and 61/642 589), and via the Patent Cooperation Treaty (SE2013/050492 and SE2013/050493). M.N. and F.S. are inventors on pending patents pertaining to the methods presented herein. None of the other authors have any conflict of interest to disclose. We confirm that we have read the journal's position on issues involved in ethical publication and affirm that this report is consistent with those guidelines.

Figures

Fig. 1
Fig. 1
Contrast overview (panel A), flow diagram (B) and ROI definition (C). Panel A shows an example of a WHO grade I fibroblastic meningioma with variable consistency. Note that FA is high in the tumor periphery and central part but lower medially from the central part. That indicates that FA and MKA reflect two different aspects - MKA maps the microscopic diffusion anisotropy whereas FA shows the macroscopic diffusion anisotropy, which is lower due to low orientation coherence (Szczepankiewicz et al., 2016). Panel B shows the flow diagram of the study where the two patient populations are characterized in Table 1, respectively. The consistency analysis was performed on 16 subjects while tumor grade and tumor type analysis on 30 subjects. Panel C defines two region-of-interests (ROIs) used in the study – a “whole-tumor ROI” characterizing inner parts of the tumor and “rim ROI” characterizing the reaction in the brain tissue surrounding the tumor.
Fig. 2
Fig. 2
Histograms of dMRI parameters. Panel A shows distributions of parameter-values within the ROIs. Part 1 shows MD, MK and MKA distributions in the whole-tumor ROI among soft, variable, and firm consistency (distribution differences indicated by yellow arrows). Part 2 shows distributions of MKA, MKI and MK in psammomatous and other meningioma types in the whole-tumor ROI. Part 3 shows the MKI distribution in grade I and II meningiomas within the rim ROI. The histograms suggest that it may be valuable to consider different distribution characteristics—their percentiles or standard deviation—shown by yellow arrows. Panel B shows effect sizes for different distribution characteristics (10th, 25th, 50th, 75th, 90th and standard deviation) as measured by Cohen’s d (defined according to Eq. (2)) averaged across all dMRI parameters (MD, FA, MK, MKA and MKI and S0). For consistency, grade and type the highest effect size is found for the 10th, 10th, and 50th percentile, respectively. For the case of grade, however, only standard deviation within MKI was significantly different between the grades. (For interpretation of the references to colour in this figure legend, the reader is referred to the web version of this article.)
Fig. 3
Fig. 3
Consistency estimation. Panel A shows dMRI parameters (10th percentile within whole-tumor ROI) versus meningioma consistency. In total we included 16 patients (with meningiomas of 7 firm, 5 variable and 4 soft). Based on MKA 10 and MK10 the firm consistency is significantly different from pooled soft and variable consistency (U test, p = 0.04 for MK10, p = 0.02 for MKA 10). Based on MD10, the variable consistency can be distinguished from soft and firm one (U test, p = 0.02). Significant parameters are marked with an asterisk (*), significant distributions with yellow arrows. Panel B shows two examples from panel A where MK10 may be useful on the individual level (marked by yellow markers in panel A). The top row shows a firm tumor that is considerably darker on the MK map in comparison to the non-firm tumor in the bottom row (yellow arrows). The images are scaled according to scale bars from Fig. 1. (For interpretation of the references to colour in this figure legend, the reader is referred to the web version of this article.)
Fig. 4
Fig. 4
Grade estimation. Panel A shows a grade I versus grade II comparison of the standard deviation in the rim ROI for the different dMRI parameters. Standard deviation within the rim ROI of MKI of grade I was significantly higher than that of grade II meningioma (n = 22 vs 8; U test; p = 0.04). All tumors were classified according to WHO 2016 classification (Louis et al., 2016).
Fig. 5
Fig. 5
MKI-rim as a radiological feature. We have observed a presence of elevated MKI values in a rim-like structure that partially circumscribes the tumor (panel A) or its absence (panel B). Yellow arrows mark the MKI-rim in panel A or tumor region in panel B, respectively. The MKI-rim is found in the brain tissue surrounding the T1w + Gd enhancing tumor lesion and it was preferentially present in high grade meningiomas. All cases can be found in the supplementary material. (For interpretation of the references to colour in this figure legend, the reader is referred to the web version of this article.)
Fig. 6
Fig. 6
Type estimation. Panel A shows 50th percentile (median) of dMRI parameters versus meningioma type, where 1 = Fibroblastic, 2 = Meningothelial, 3 = Transitional, 4 = Clear-cell, 5 = Microcystic/Angiomatous, 6 = Chordoid, 7 = Psammomatous. The microcystic/angiomatous type (#5) is significantly different from the other types in S0, MD, FA, MK, MKA, however, only two cases were included. The psammomatous type (#7) is significantly different from the others in MKA 50 and MKI 50 but not in MK50 (n = 5 vs 24; U test; p = 0.03 for MKA 50 and p = 0.03 and p = 0.04 for MKI 50). Panel B shows three examples from panel A (marked by yellow markers). The one in the top row shows a psammomatous type with high MKA 50. The middle row shows a case of non-psammomatous (fibroblastic) type with the highest MKA 50. The psammomatous type is somewhat brighter in MKA map than the highest non-psammomatous type (yellow arrows). The bottom row shows that an example of MD being generally high in a microcystic/angiomatous meningioma (yellow arrows). The images are scaled according to scale bars from Fig. 1. All tumors were classified according to WHO 2016 classification (Louis et al., 2016). (For interpretation of the references to colour in this figure legend, the reader is referred to the web version of this article.)
Fig. 7
Fig. 7
Receiver-operating characteristic (ROC) curves for the 3 cases from Fig. 1. Panel A shows ROC curves for predicting firm consistency (n = 7) from the pooled soft and variable (n = 9) based on MK10 (gray line) and MKA 10 (black line) in the whole tumor-ROI. Based on MK10 the AUC is 0.83 with confidence interval [0.43; 1.00] with optimal cut-point value (gray dot) with specificity 100 % and sensitivity 71 %. Based on MKA 10 the AUC is 0.84 with confidence interval [0.52; 0.98] with optimal cut-point value (black dot) with specificity 78 % and sensitivity 86 %. Panel B shows ROC curve for predicting grade II (n = 8) from grade I (n = 22) based on MKI std in the rim-ROI. The AUC is 0.65 with confidence intervals [0.42; 0.84]. Optimal cut-point value (gray dot) yields specificity of 77 % and sensitivity 50 %. Finally, panel C shows ROC curve for prediction of psammomatous type based on MK50 and MKA 50. The AUC for MK50 is 0.63 with confidence interval [0.18; 1.00] with optimal cut-point value with specificity of 100 % and sensitivity 40 % (gray dot) and for MKA 50 0.81 with confidence intervals [0.07; 1.00] with optimal cut-point value with specificity 96 % and sensitivity 80 %. Large confidence intervals (not shown graphically in the figure) in all cases highlight limitations of the small dataset and thus limit the interpretability of the AUC value.

References

    1. Basser P.J., Mattiello J., LeBihan D. MR diffusion tensor spectroscopy and imaging. Biophys. J. 1994;66:259–267. - PMC - PubMed
    1. Bi W.L., Prabhu V.C., Dunn I.F. High-grade meningiomas: biology and implications. Neurosurg. Focus. 2018;44:E2. - PubMed
    1. Brastianos P.K., Horowitz P.M., Santagata S., Jones R.T., McKenna A., Getz G., Ligon K.L., Palescandolo E., Van Hummelen P., Ducar M.D. Genomic sequencing of meningiomas identifies oncogenic SMO and AKT1 mutations. Nat. Genet. 2013;45:285–289. - PMC - PubMed
    1. Cepeda S., Arrese I., García-García S., Velasco-Casares M., Escudero-Caro T., Zamora T., Sarabia R. Meningioma consistency can be defined by combining the radiomic features of magnetic resonance imaging and ultrasound elastography. A pilot study using machine learning classifiers. World Neurosurg. 2021;146:e1147–e1159. - PubMed
    1. Chartrain A.G., Kurt M., Yao A., Feng R., Nael K., Mocco J., Bederson J.B., Balchandani P., Shrivastava R.K. Utility of preoperative meningioma consistency measurement with magnetic resonance elastography (MRE): a review. Neurosurg. Rev. 2019;42:1–7. - PubMed

Publication types

MeSH terms