Meta-Analysis
. 2022 Mar 4;68(3):461-472.
doi: 10.1093/clinchem/hvab249.

Obesity and Kidney Function: A Two-Sample Mendelian Randomization Study

Affiliations
Meta-Analysis

Obesity and Kidney Function: A Two-Sample Mendelian Randomization Study

Alisa D Kjaergaard et al. Clin Chem. .

Abstract

Background: Obesity and type 2 diabetes (T2D) are correlated risk factors for chronic kidney disease (CKD).

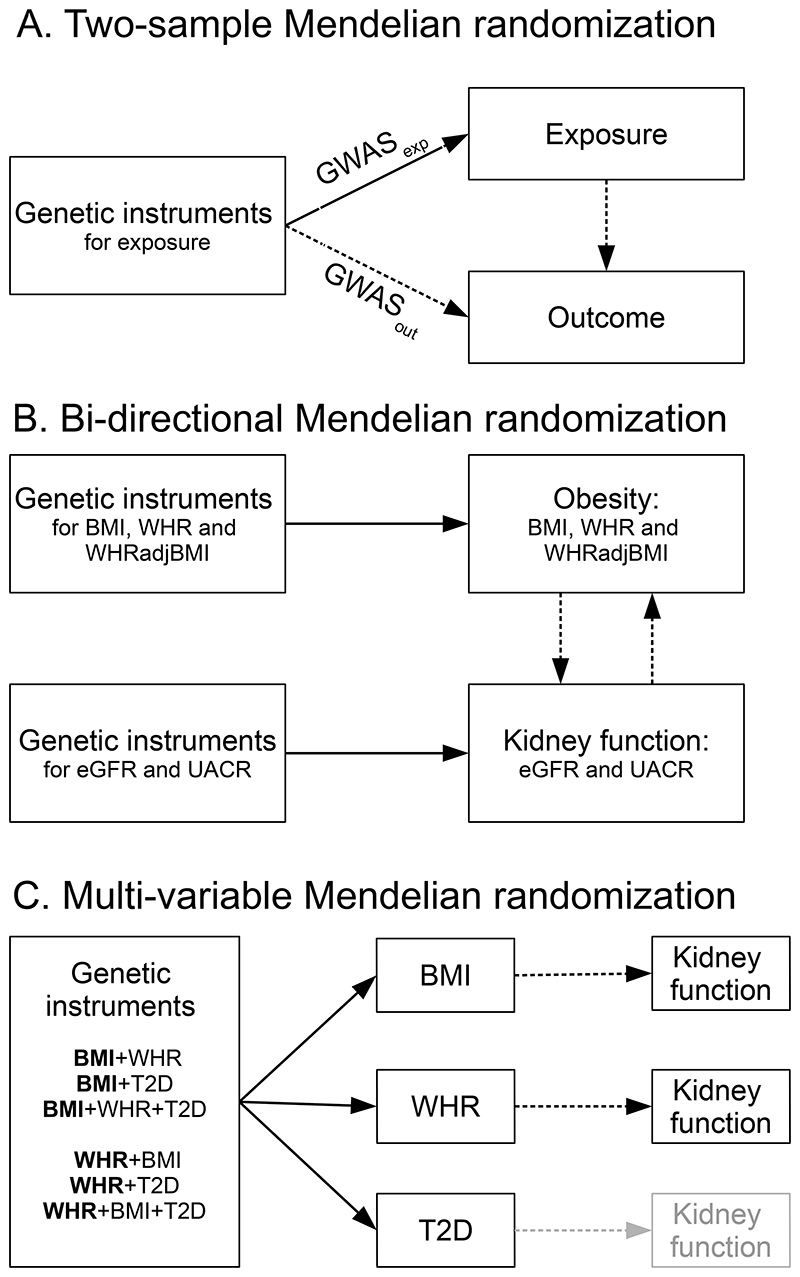
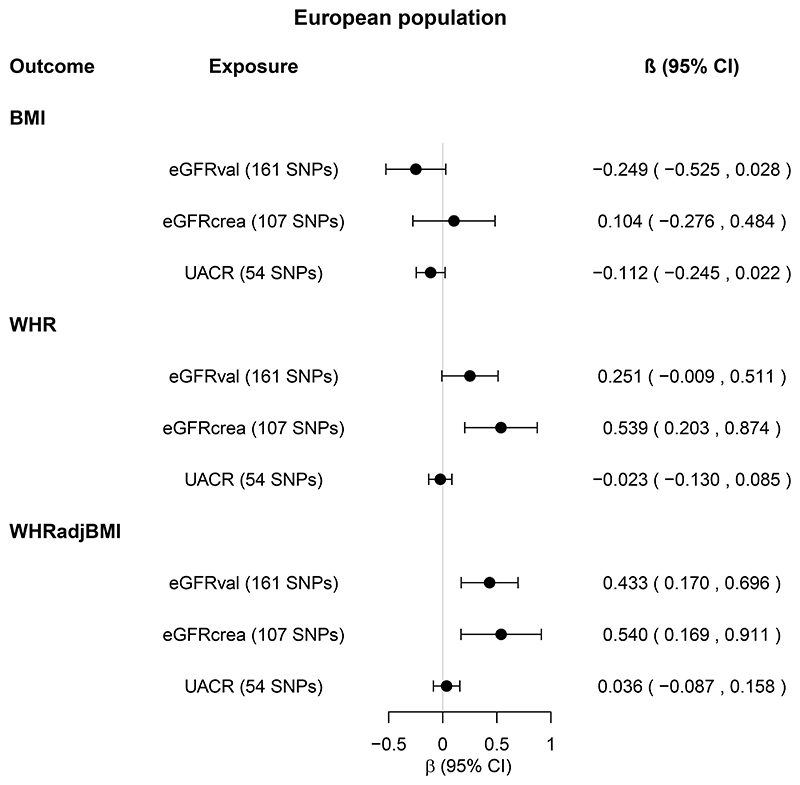
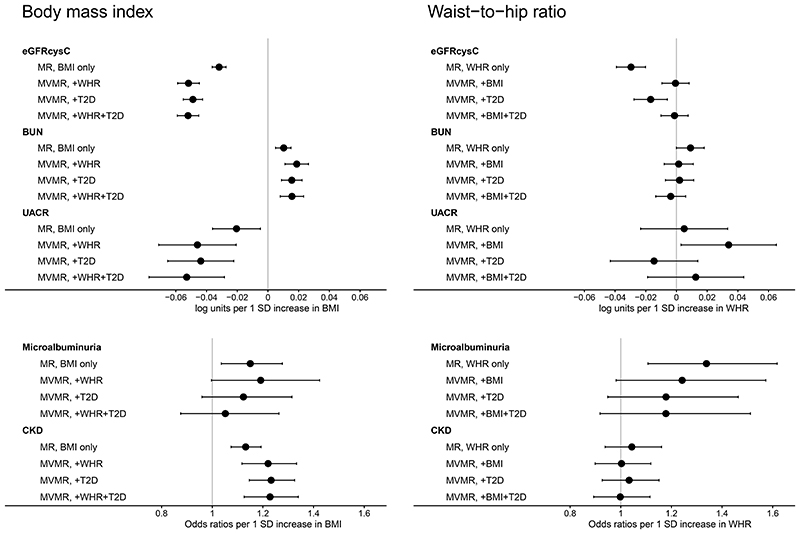
Methods: Using summary data from GIANT (Genetic Investigation of Anthropometric Traits), DIAGRAM (DIAbetes Genetics Replication And Meta-analysis), and CKDGen (CKD Genetics), we examined causality and directionality of the association between obesity and kidney function. Bidirectional 2-sample Mendelian randomization (MR) estimated the total causal effects of body mass index (BMI) and waist-to-hip ratio (WHR) on kidney function, and vice versa. Effects of adverse obesity and T2D were examined by stratifying BMI variants by their association with WHR and T2D. Multivariable MR estimated the direct causal effects of BMI and WHR on kidney function. The inverse variance weighted random-effects MR for Europeans was the main analysis, accompanied by several sensitivity MR analyses.

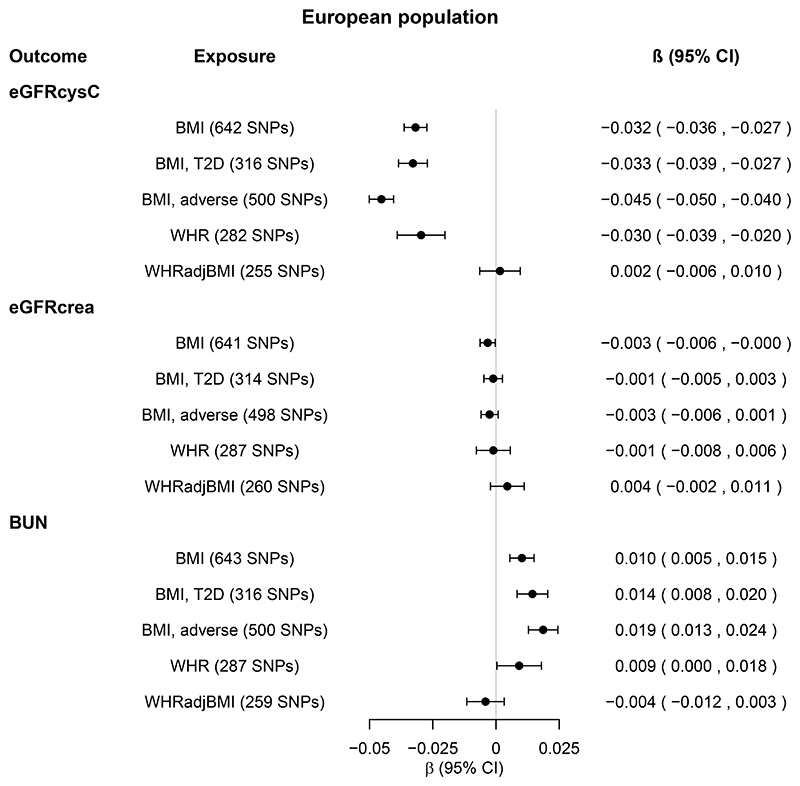
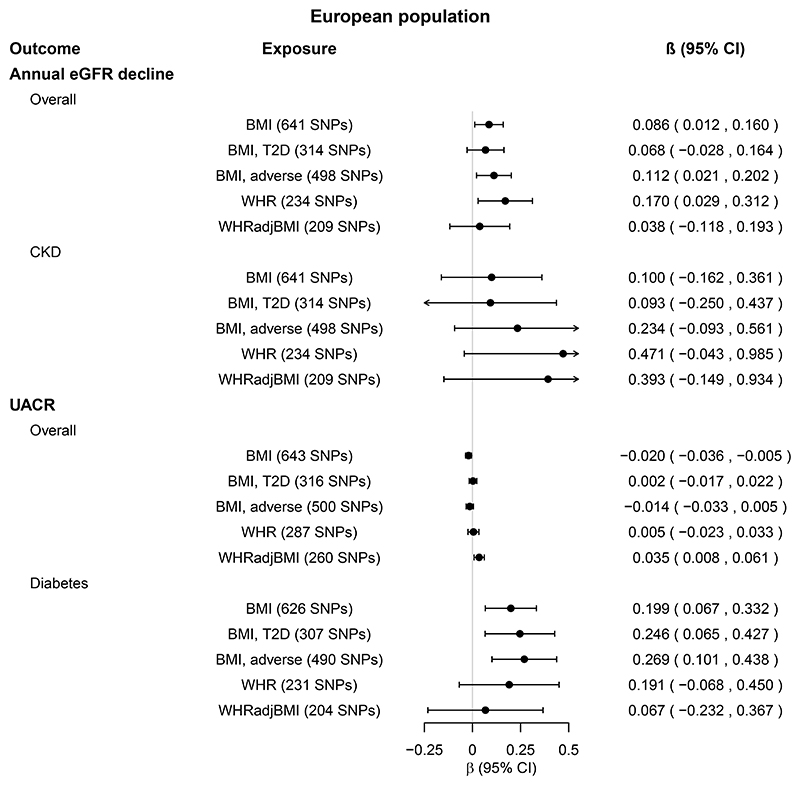
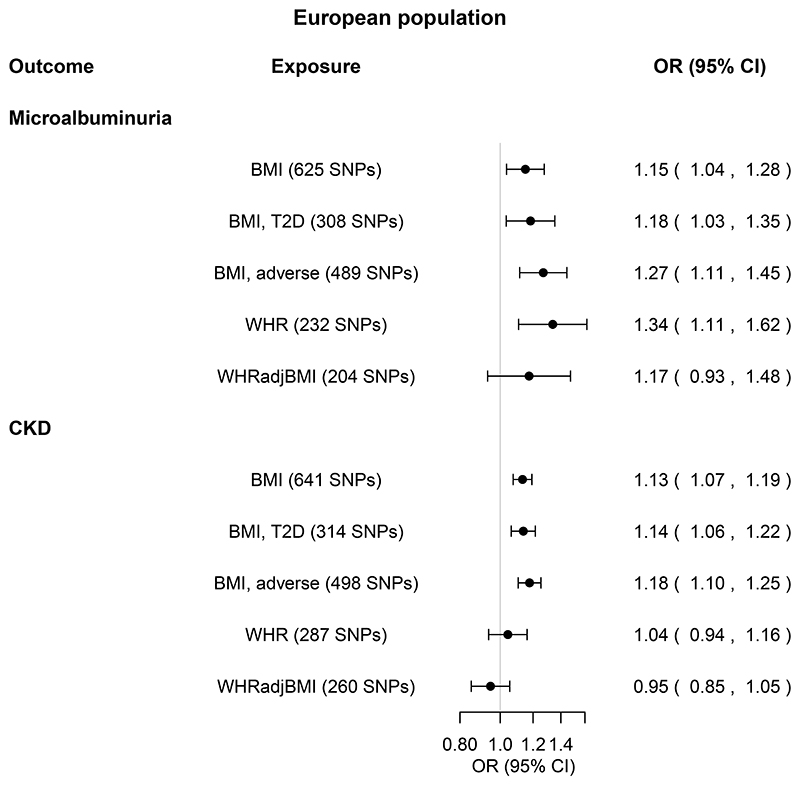
Results: One standard deviation (SD ≈ 4.8 kg/m2) genetically higher BMI was associated with decreased estimated glomerular filtration rate (eGFR) [β=-0.032 (95% confidence intervals: -0.036, -0.027) log[eGFR], P = 1 × 10-43], increased blood urea nitrogen (BUN) [β = 0.010 (0.005, 0.015) log[BUN], P = 3 × 10⁻⁶], increased urinary albumin-to-creatinine ratio [β = 0.199 (0.067, 0.332) log[urinary albumin-to-creatinine ratio (UACR)], P = 0.003] in individuals with diabetes, and increased risk of microalbuminuria [odds ratios (OR) = 1.15 [1.04-1.28], P = 0.009] and CKD [1.13 (1.07-1.19), P = 3 × 10⁻⁶]. Corresponding estimates for WHR and for trans-ethnic populations were overall similar. The associations were driven by adverse obesity, and for microalbuminuria additionally by T2D. While genetically high BMI, unlike WHR, was directly associated with eGFR, BUN, and CKD, the pathway to albuminuria was likely through T2D. Genetically predicted kidney function was not associated with BMI or WHR.

Conclusions: Genetically high BMI is associated with impaired kidney function, driven by adverse obesity, and for albuminuria additionally by T2D.

Keywords: albuminuria; blood urea nitrogen; body mass index; chronic; diabetes mellitus; glomerular filtration rate; kidney function tests; mendelian randomization analysis; obesity; renal insufficiency; type 2; waist-hip ratio.


Conflict of interest statement

Disclosures

The authors declare no known competing financial interests or personal relationships that could have appeared to influence this study.

Figures

Figure 1
Figure 1. Schematic diagrams illustrating the study design.
All genetic instruments were single nucleotide polymorphisms (SNPs). A) The two-sample Mendelian randomization (MR) approach uses summary data from two different population samples, provided by large genome-wide association studies (GWASs) consortia to assess causality between the exposure and the outcome. Summary data (β coefficients and standard errors) for the SNP-exposure (GWASexp) and SNP-outcome (GWASout) associations for this study were from the GIANT Consortium for obesity (body mass index [BMI], waist-to-hip ratio [WHR] and WHR adjusted for BMI [WHRadjBMI]) and CKDGen for kidney function (estimated glomerular filtration rate [eGFR], blood urea nitrogen, annual eGFR decline, urinary albumin-to-creatinine ratio [UACR], microalbuminuria and chronic kidney disease). Supplemental Tables 1 shows an overview of the studies included. B) The bi-directional MR approach uses genetic instruments for both exposure and outcome to evaluate whether the “exposure” causes the “outcome” or vice versa. We identified genetic instruments for obesity (BMI, WHR and WHRadjBMI) and kidney function (estimated glomerular filtration rate [eGFR] and urinary albumin-to-creatinine ratio [UACR]). Supplemental Tables 2 shows the identification of genetic instruments. C) While MR estimates the total causal effects using a single exposure at a time, the multi-variable MR estimates the direct causal effects of each exposure using multiple exposures simultaneously. In this study, we examined the direct causal effects of BMI and WHR on each kidney function outcome, while accounting for each other and/or type 2 diabetes (T2D). Hence the bold font denotes the three models for BMI and WHR each (Supplemental Tables 11), whereas the direct effects of T2D were not examined (shown in light grey). Summary data for T2D were from the DIAGRAM consortium.
Figure 2
Figure 2. Total causal effects of obesity on eGFR and BUN in the European population.
Estimates (β coefficients and 95% confidence intervals [CIs]) are from the inverse variance weighted random-effects Mendelian randomization analysis, and expressed in log units per standard deviation increase in the relevant exposure. Obesity exposures from the GIANT Consortium were BMI (body mass index, N=795,624), WHR (waist-to-hip ratio, N=697,702), and WHRadjBMI (WHR adjusted for BMI, N=694,469). For each obesity exposure, the number of single nucleotide polymorphisms (SNPs) included in the analysis is shown in parenthesis. BMI, T2D and BMI, adverse (obesity) refer to BMI SNPs restricted to SNPs nominally associated with type 2 diabetes (T2D) and WHR, respectively. For details, see Methods. Kidney function outcomes from the CKDGen Consortium and UK Biobank combined were eGFRcysC (estimated glomerular filtration rate [eGFR] based on serum cystatin C, N=460,826), eGFRcrea (eGFR based on serum creatinine using the CKD-EPI equation, N=1,004,040) and BUN (blood urea nitrogen, N=679,531). Sensitivity MR analyses are shown in Supplemental Tables 3-4.
Figure 3
Figure 3. Total causal effects of obesity on eGFR decline and UACR in the European population.
Estimates (β coefficients and 95% confidence intervals [CIs]) are from the inverse variance weighted random-effects Mendelian randomization analysis, and expressed in log units per standard deviation increase in the relevant exposure. Obesity exposures from the GIANT Consortium were BMI (body mass index, N=795,624), WHR (waist-to-hip ratio, N=697,702), and WHRadjBMI (WHR adjusted for BMI, N=694,469). For each obesity exposure, the number of single nucleotide polymorphisms (SNPs) included in the analysis is shown in parenthesis. BMI, T2D and BMI, adverse (obesity) refer to BMI SNPs restricted to SNPs nominally associated with type 2 diabetes (T2D) and WHR, respectively. For details, see Methods. Kidney function outcomes from the CKDGen Consortium were annual eGFR (estimated glomerular filtration rate) decline (based on serum creatinine levels and calculated by the MDRD equation), available in overall population and subpopulation with chronic kidney disease (CKD, NCKDcases=3338 cases, NCKDcontrols=39,653, Noverall=43,008), and UACR (urinary albumin-to-creatinine ratio), available in overall population and subpopulation with diabetes (NDM=11,529, Noverall=118,460). Sensitivity MR analyses are shown in Supplemental Tables 3-4.
Figure 4
Figure 4. Total causal effects of obesity on microalbuminuria and CKD in the European population.
Estimates are from the inverse variance weighted random-effects Mendelian randomization analysis, and expressed as odds ratios (ORs) and 95% confidence intervals (CIs). Obesity exposures from the GIANT Consortium were BMI (body mass index, N=795,624), WHR (waist-to-hip ratio, N=697,702), and WHRadjBMI (WHR adjusted for BMI, N=694,469). For each obesity exposure, the number of single nucleotide polymorphisms (SNPs) included in the analysis is shown in parenthesis. BMI, T2D and BMI, adverse (obesity) refer to BMI SNPs restricted to SNPs nominally associated with type 2 diabetes (T2D) and WHR, respectively. For details, see Methods. Kidney function outcomes from the CKDGen Consortium were microalbuminuria (defined as urinary albumin-to-creatinine ratio above 25 mg/g in women and 17 mg/g in men, Ncases=5996, Ncontrols=48,140), and CKD (chronic kidney disease, defined as estimated glomerular filtration rate below 60 ml/min/1.73 m2, NCKDcases=41,395 cases, Ncontrols=439,303 controls). Sensitivity MR analyses are shown in Supplemental Tables 34.
Figure 5
Figure 5. Total causal effects of kidney function on obesity in the European population.
Estimates (β coefficients and 95% confidence intervals [CIs]) are from the inverse variance weighted random-effects Mendelian randomization analysis, and expressed in log units per standard deviation increase in the relevant exposure. Kidney function exposures from the CKDGen Consortium were eGFRval (estimated glomerular filtration rate based on creatinine and calculated by CKD-EPI equation, and validated by being associated with cystatin C and inversely associated with blood urea nitrogen [BUN]), eGFRcrea (eGFR based on creatinine and calculated by CKD-EPI equation, and validated by being inversely associated with BUN, N=567,460-1,004,040) and UACR (urinary albumin-to-creatinine ratio, N=547,361). For each kidney function exposure, the number of single nucleotide polymorphisms (SNPs) included in the analysis is shown in parenthesis. Obesity outcomes from the GIANT Consortium and UK Biobank combined were BMI (body mass index, N=795,624), WHR (waist-to-hip ratio, N=697,702), and WHRadjBMI (WHR adjusted for BMI, N=694,469). Sensitivity MR analyses are shown in Supplemental Tables 7-8.
Figure 6
Figure 6. Direct causal effects of obesity on kidney function in the European population.
Estimates (and corresponding 95% confidence intervals) are from the inverse variance weighted random-effects Mendelian randomization (MR) analyses, and expressed in log units per standard deviation (SD) increase in exposure for continuous outcomes, and odds ratios for binary outcomes. MR approach estimated the total causal effects of body mass index (BMI) and waist-to-hip ratio (WHR) on kidney function outcomes (shown in Supplemental Table 3). Multivariable MR (MVMR) based on the inverse-variance weighted method estimated the direct causal effects of BMI and WHR on each kidney function outcome, while accounting for each other and/or type 2 diabetes (T2D). eGFRcysC: estimated glomerular filtration rate based on serum cystatin C. BUN: blood urea nitrogen. UACR: urinary albumin-to-creatinine ratio. CKD: chronic kidney disease.

References

    1. Chang AR, Grams ME, Ballew SH, Bilo H, Correa A, Evans M, et al. Adiposity and risk of decline in glomerular filtration rate: meta-analysis of individual participant data in a global consortium. Bmj. 2019;364:k5301. - PMC - PubMed
    1. Garofalo C, Borrelli S, Minutolo R, Chiodini P, De Nicola L, Conte G. A systematic review and meta-analysis suggests obesity predicts onset of chronic kidney disease in the general population. Kidney Int. 2017;91(5):1224–35. - PubMed
    1. Herrington WG, Smith M, Bankhead C, Matsushita K, Stevens S, Holt T, et al. Bodymass index and risk of advanced chronic kidney disease: Prospective analyses from a primary care cohort of 1.4 million adults in England. PLoS One. 2017;12(3):e0173515. - PMC - PubMed
    1. Madero M, Katz R, Murphy R, Newman A, Patel K, Ix J, et al. Comparison between Different Measures of Body Fat with Kidney Function Decline and Incident CKD. Clin J Am Soc Nephrol. 2017;12(6):893–903. - PMC - PubMed
    1. Vivante A, Golan E, Tzur D, Leiba A, Tirosh A, Skorecki K, et al. Body mass index in 1.2 million adolescents and risk for end-stage renal disease. Arch Intern Med. 2012;172(21):1644–50. - PMC - PubMed

Publication types