. 2021 Dec 18;21(1):299.
doi: 10.1186/s12906-021-03476-y.

Protective effects of exosomes derived from lyophilized porcine liver against acetaminophen damage on HepG2 cells

Affiliations

Protective effects of exosomes derived from lyophilized porcine liver against acetaminophen damage on HepG2 cells

Riccardo Tassinari et al. BMC Complement Med Ther. .

Abstract

Background: Recently, extracellular vesicles have come to the fore following their emerging role in cell communication, thanks to their ability to reach cells into the human body without dissipating their cargo, transferring biological active molecules, such as proteins, nucleic acids, lipids, etc. They appear as a promising tool in medicine, because of their capability to modulate cellular response in recipient cells. Moreover, a considerable number of publications suggests that exosome uptake is selective but not specific, and it can cross species and cell-type boundaries. This study aims to explore the potential role of porcine liver derived extracellular vesicles, exosomes in particular, to protect human cells from acute damage induced by acetaminophen.

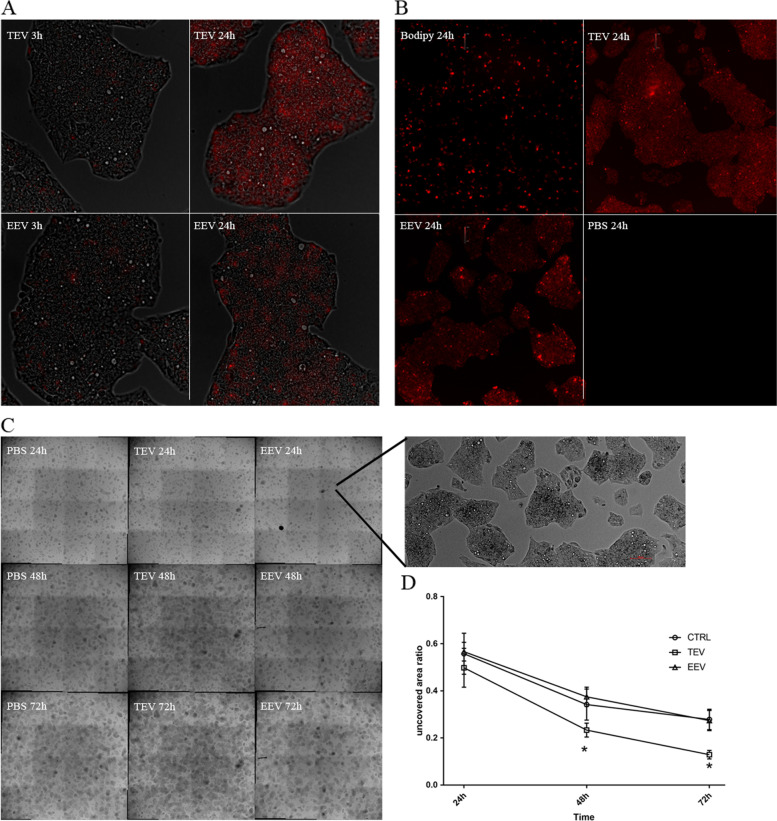
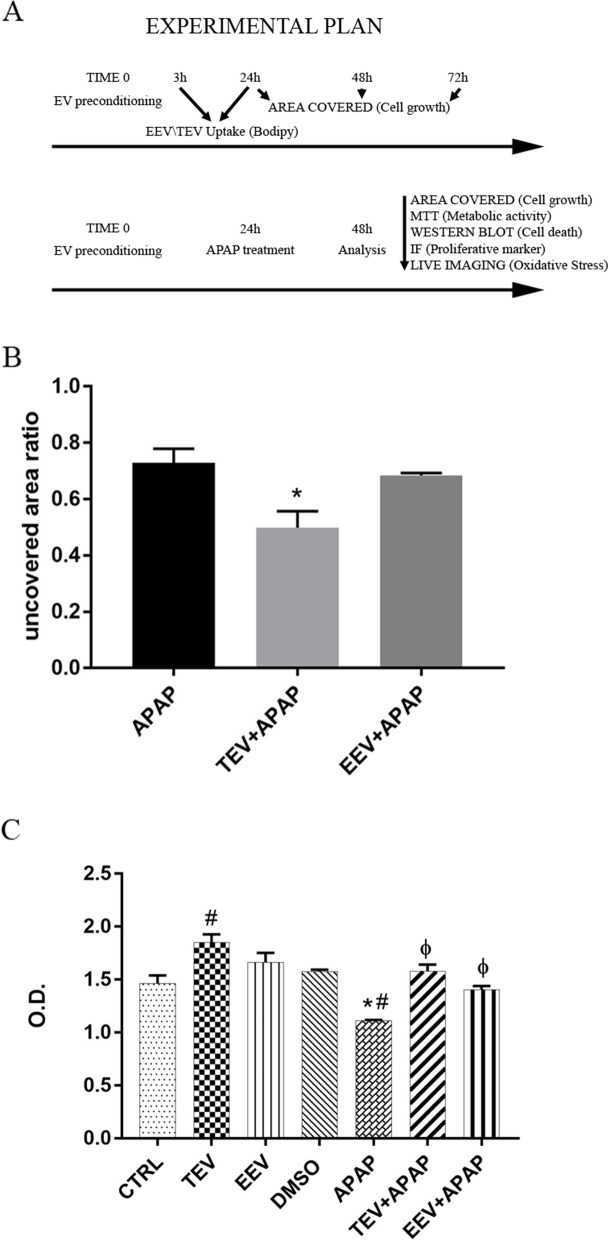
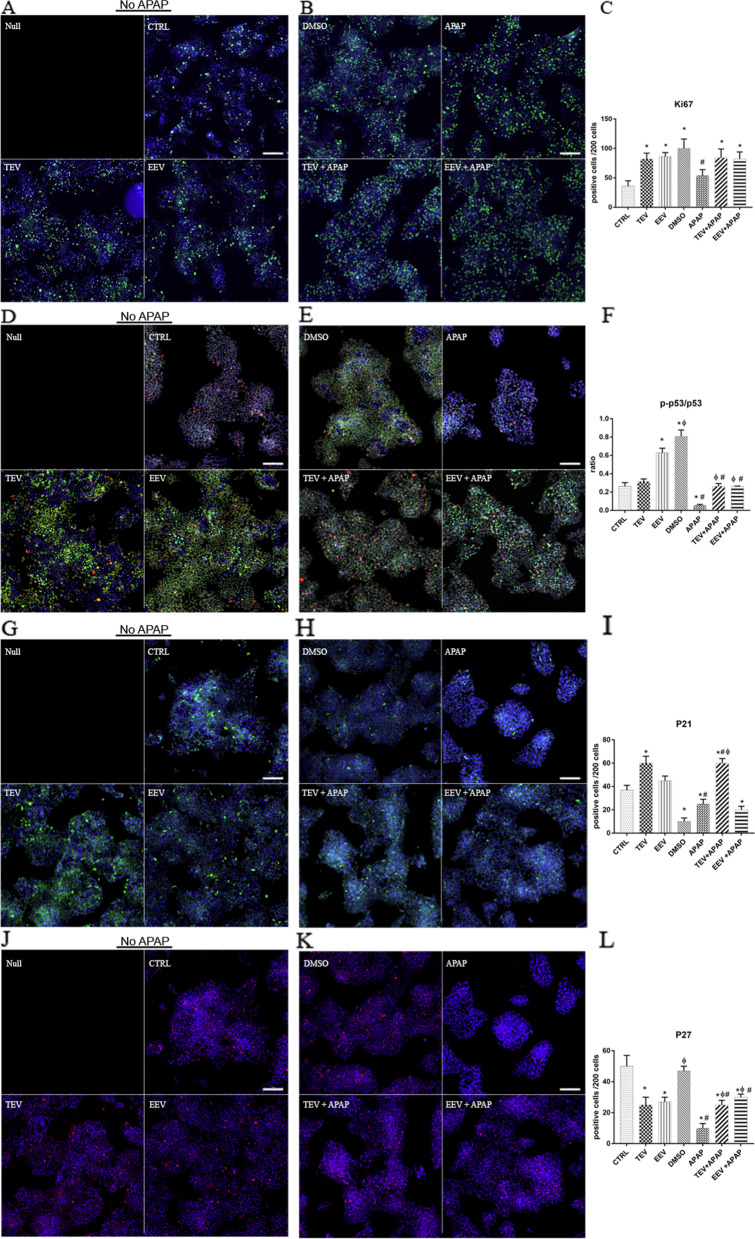
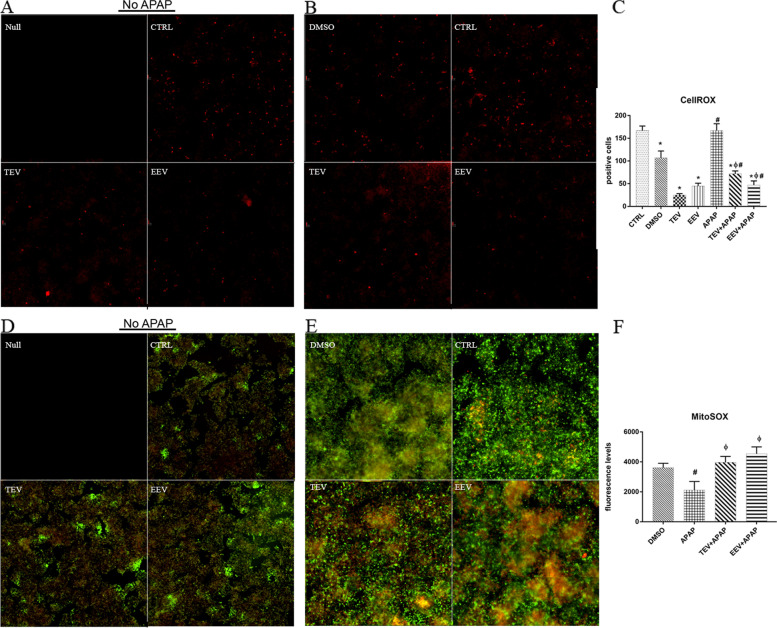
Methods: Extracellular vesicles were isolated from porcine lyophilized liver using polymer-based precipitation and a further enrichment was performed using affinity beads. The effects of obtained fractions, total extracellular vesicles and enriched extracellular vesicles, were assessed on human liver derived HepG2 cells. Cell growth and survival were tested, with MTT and area coverage analysis designed by us, as well as protein expression, with immunofluorescence and Western blot. Oxidative stress in live cells was also measured with fluorogenic probes.

Results: After proving that porcine extracellular vesicles did not have a toxic effect on HepG2, quite the contrary total extracellular vesicle fraction improved cell growth, we investigated their protective capability with a preconditioning strategy in APAP-induced damage. EVs displayed not only the ability to strongly modulate cell survival responses, but they also were able to boost cell cycle progression.

Conclusions: Extracellular vesicles derived from farm animal food derivatives are able to modulate human hepatic cell metabolism, also improving cell survival in a damaged context.

Keywords: Extracellular vesicles; Liver hepatocytes; Nutraceuticals; Porcine liver exosomes; Preconditioning.


Conflict of interest statement

GUNA (Milan, Italy) funded the research. GUNA had no role in the design of the study, in the collection, analysis, or interpretation of the data as well as in writing the manuscript. The freeze-dried liver powder was provided by Neorland (Cremona, Italy) whose sole shareholder O.F. collaborated in the conceptualization of the manuscript. Neorland shareholder did not contributed in the collection, analysis, or interpretation of the data. R.T., C.C., E.O., V.T., C.Z., and C.V. have no conflict of interest to declare.

Figures

Fig. 1
Fig. 1
Uptake of TEV and EEV fraction in HepG2 cells and effects on cell growth. A BODIPY™ TR Ceramide labelled (red) TEVs and EEVs showing uptake in HepG2 cells at 3 h (left) and 24 h (right). Shown here are microphotographs (384 × 384 μm) taken stitching 4 images of HepG2 cells cultured on a 48-well plate; representative for 5 experiments. B BODIPY™ TR Ceramide labelled (red) or unlabelled uptake on HepG2 cells at 24 h. Upper-left: direct BODIPY™ labelling in culture medium of HepG2; upper-right: uptake of BODIPY™ labelled TEVs; bottom-left: uptake of BODIPY™ labelled EEVs; bottom-right: BODIPY™ labelled PBS without vesicles after elution on Exosome Spin Column on HepG2 cells. Shown here are microphotographs (1560 × 1560 μm) taken stitching 4 images of HepG2 cells cultured on a 48-well plate; representative for 3 experiments. C Effects of TEV and EEV fractions on HepG2 cell growth. Microphotographs (5800 × 5800 μm) of control cells (PBS, left panels), TEV-treated cells (middle panels) and EEV-treated cells (right panels) at 24, 48 and 72 h. Zoomed on the right, there is a portion of the whole image that shows clearly the cell islets. Red line is 100 μm. D Graph representing uncovered area ratio (uncovered area at the mentioned time/uncovered area at day 0) by treated or untreated HepG2 cells over time. Consequently, the lower the ratio, the higher the growth of cells. Areas were calculated after binarization of the images in the C panel. Data are mean ± SD with n = 3 per group. *, p < 0.05 vs control
Fig. 2
Fig. 2
Evaluation of protection activity mediated by EVs after APAP-induced damage. A Experimental outline of the preconditioning strategy implemented to test EV-pretreatment protective effects. Shown in the first diagram the experiments timeline performed after precondition with EV and without APAP treatment. Shown in the second diagram, 24 h after EV preconditioning, cells were treated with or without APAP; after further 24 h analyses were performed. B TEV-pretreatment improved cell survival on HepG2 cells treated with APAP. Diagram showing uncovered area ratio: uncovered area after 24 h with (EEV and TEV) or without (CTRL) EVs and subsequent 24 h of APAP/uncovered area at day 0. The total loss of HepG2 cells is calculated after binarization of cell absence/presence in cultured HepG2 cells prior and after APAP treatment. C MTT activity detected in HepG2 cells with or without EV treatment and with or without APAP administration. The 4 samples starting from the left of the diagram did not receive APAP treatment, i.e. control cells (CTRL), TEV- and EEV-treated cells (TEV, EEV), vehicle-treated cells (DMSO), conversely the last 3 did receive it: cells treated with APAP alone (APAP), or pretreated with TEV and EEV fractions (TEV + APAP, EEV + APAP). As shown, TEV treatment was able to induce an increase in detectable mitochondrial activity in all conditions, meanwhile EEVs displayed an effect only in APAP-treated samples. For all panels, data are mean ± SD with n = 3 per group. *, p < 0.05 vs CTRL; #, p < 0.05 vs vehicle (DMSO); Φ, p < 0.05 vs APAP
Fig. 3
Fig. 3
Evaluation of metabolic marker proteins: TEV and EEV treatments differently affected protein expression after APAP administration. Diagrams showing densitometric analysis of protein levels (A, c-Casp3; B, c-PARP; C, p-c-Jun; D, p-JNK; E, BiP) in HepG2 APAP-treated cells, vehicle-treated cells (DMSO) and APAP plus TEV or EEV pretreatments. All protein levels are normalized to the total protein expression of each sample measured using the TGX stain-free technology by Bio-Rad (F). For all panels, data are mean ± SD with n = 3 per group. *, p < 0.05 vs DMSO (control); Φ, p < 0.05 vs APAP. (Shown lines were cropped from the original row file. Full-length blots are displayed in (Additional file 5)
Fig. 4
Fig. 4
Immunofluorescence of proteins involved in cell cycle progression and apoptosis. Microphotographs taken stitching 4 images of HepG2 cells cultured on a glass coverslip of a PFA-fixed immunofluorescence, representative for 3 experiments (scale bar = 50 μm). Without APAP (panels A, D, G, J): no staining (Null), control cells (CTRL), TEV- and EEV-treated cells. With APAP (panels B,E,H,K): vehicle-treated cells (DMSO), control cells (CTRL), TEV- and EEV-treated cells. A-B Ki67 staining (green) and DAPI counterstaining (blue) of HepG2 cells. C Diagram showing number of Ki67 positive cells in CTRL, TEV- and EEV-treated cells with or without 24 h APAP (or vehicle) treatment. Counting of Ki67 positive nuclei was performed in 3 different fields of view after reaching 200 counted nuclei. D-E p-p53 staining (green), p53 staining (red) and DAPI counterstaining (blue) of HepG2 cells. F Diagram showing the ratio between p-p53 and p53 positive cells. Counting of p-p53 or p53 positive nuclei was performed in 3 different fields of view after reaching 200 counted nuclei. G-H p21 staining (green) and DAPI counterstaining (blue) of HepG2 cells. I Diagram showing number of p21 positive cells. J-K p27 staining (red) and DAPI counterstaining (blue) of HepG2 cells. L Diagram showing number of p27 positive cells. For all panels, data are mean ± SD with n = 3 per group. *, p < 0.05 vs CTRL, Φ p < 0.05 vs APAP treatment, #, p < 0.05 vs vehicle (DMSO)
Fig. 5
Fig. 5
Live imaging of oxidative stress metabolic markers. Microphotographs taken stitching 4 images of HepG2 cells cultured on a 48-well plate of a live imaging immunofluorescence, representative for 3 experiments. Without APAP (panel A and D): no staining (Null), control cells (CTRL), TEV- and EEV-treated cells. With APAP (panel B and E): vehicle-treated cells (DMSO), control cells (CTRL), TEV- and EEV-treated cells. (A,B) CellROX staining (red) on HepG2 cells showing level of hydrogen peroxides in the cytoplasm (image size: 1560 × 1560 μm). C Diagram showing number of CellROX positive cells in CTRL, TEV and EEV-treated cells with or without 24 h APAP (or vehicle) treatment. After fluorescence background subtraction, positive cells in the microphotographs are counted. D, E MitoSOX staining (red) on HepG2 cells. MitoTracker counterstaining (green) showing basal mitochondrial ROS activity (image size: 1145 × 1145 μm). (F) Diagram showing fluorescence levels of MitoSOX positive cells in CTRL, TEV and EEV-treated cells with 24 h APAP (or vehicle) treatment. After fluorescence background subtraction, MitoSOX fluorescence levels were evaluated in positive counted cells. For all panels, data are mean ± SD with n = 3 per group. *, p < 0.05 vs CTRL; Φ, p < 0.05 vs APAP treatment; #, p < 0.05 vs vehicle (DMSO)

References

    1. Raposo G, Stoorvogel W. Extracellular vesicles: exosomes, microvesicles, and friends. J Cell Biol. 2013;200(4):373–383. doi: 10.1083/jcb.201211138. - DOI - PMC - PubMed
    1. Théry C, Witwer KW, Aikawa E, Alcaraz MJ, Anderson JD, Andriantsitohaina R, et al. Minimal information for studies of extracellular vesicles 2018 (MISEV2018): a position statement of the International Society for Extracellular Vesicles and update of the MISEV2014 guidelines. J Extracell Vesicles. 2018;7(1):1535750. doi: 10.1080/20013078.2018.1535750. - DOI - PMC - PubMed
    1. Villarroya-Beltri C, Baixauli F, Gutiérrez-Vázquez C, Sánchez-Madrid F, Mittelbrunn M. Sorting it out: regulation of exosome loading. Semin Cancer Biol. 2014;28:3–13. doi: 10.1016/j.semcancer.2014.04.009. - DOI - PMC - PubMed
    1. Damania A, Jaiman D, Teotia AK, Kumar A. Mesenchymal stromal cell-derived exosome-rich fractionated secretome confers a hepatoprotective effect in liver injury. Stem Cell Res Ther. 2018;9(1):31. doi: 10.1186/s13287-017-0752-6. - DOI - PMC - PubMed
    1. Munagala R, Aqil F, Jeyabalan J, Gupta RC. Bovine milk-derived exosomes for drug delivery. Cancer Lett. 2016;371(1):48–61. doi: 10.1016/j.canlet.2015.10.020. - DOI - PMC - PubMed