. 2021 Dec 18;19(1):426.
doi: 10.1186/s12951-021-01169-9.

Nanofactory for metabolic and chemodynamic therapy: pro-tumor lactate trapping and anti-tumor ROS transition

Affiliations

Nanofactory for metabolic and chemodynamic therapy: pro-tumor lactate trapping and anti-tumor ROS transition

Ruiqing He et al. J Nanobiotechnology. .

Abstract

Lactate plays a critical role in tumorigenesis, invasion and metastasis. Exhausting lactate in tumors holds great promise for the reversal of the immunosuppressive tumor microenvironment (TME). Herein, we report on a "lactate treatment plant" (i.e., nanofactory) that can dynamically trap pro-tumor lactate and in situ transformation into anti-tumor cytotoxic reactive oxygen species (ROS) for a synergistic chemodynamic and metabolic therapy. To this end, lactate oxidase (LOX) was nano-packaged by cationic polyethyleneimine (PEI), assisted by a necessary amount of copper ions (PLNPCu). As a reservoir of LOX, the tailored system can actively trap lactate through the cationic PEI component to promote lactate degradation by two-fold efficiency. More importantly, the byproducts of lactate degradation, hydrogen peroxide (H2O2), can be transformed into anti-tumor ROS catalyzing by copper ions, mediating an immunogenic cell death (ICD). With the remission of immunosuppressive TME, ICD process effectively initiated the positive immune response in 4T1 tumor model (88% tumor inhibition). This work provides a novel strategy that rationally integrates metabolic therapy and chemodynamic therapy (CDT) for combating tumors.

Keywords: Chemodynamic therapy; Immunogenic cell death; Immunosuppressive tumor microenvironment; Lactate.


Conflict of interest statement

The authors declare no conflict of interest.

Figures

Scheme 1
Scheme 1
Schematic illustration of the lactate exhaustion process of PLNPCu nanosystem through extracellular lactate active-adsorption and establishment of the intracellular lactate treatment plant
Fig. 1
Fig. 1
Characterization of PLNPCu. a, b TEM images of PLNPCu at pH 7.4. c TEM images of PLNPCu at pH 6.5. d DLS of PLNPCu at pH 7.4. e The pH-triggered charge rebound behavior of PLNPCu (n = 3). f Maintenance of size stability of PLNPCu in PBS and PBS with 5% FBS (at pH 7.4) (n = 3). g LOX loading capacities on LNP and LNPCu respectively (n = 3). h Cumulative release of LOX from PLNPCu in PBS at pH 7.4 and pH 6.5 (n = 3). i Hemolysis rate of PLNPCu at different PEI concentrations (n = 3). Results were expressed as mean ± SD. The significant difference was calculated via two-tailed t-test analysis (g). (NS represented not significant, *p < 0.05, **p < 0.01, ***p < 0.001)
Scheme 2
Scheme 2
Schematic illustration of the PLNPCu nanofactory closed-loop for lactate consumption and conversion
Fig. 2
Fig. 2
Functions verification of lactate treatment plant PLNPCu in vitro. a Lactate adsorption rate of PEI in nanoparticles (n = 3). b Lactate depletion effect of LNPCu overtime at pH 7.4 (n = 3). c Lactate degradation ratio of LNPCu at the shorter incubation time in different acidic solutions (n = 3). d Lactate degradation rate of LNPCu compared with LOX after sufficiently enzymatic hydrolysis (n = 3). e The generation of enzymatic product H2O2 (n = 3). f The degradation process of MB caused by ·OH generation from the Fenton-like reaction of nanoparticles under different conditions. Results were expressed as mean ± SD. The significant difference was calculated via one-way ANOVA analysis (a, d, e). (NS represented not significant, *p < 0.05, **p < 0.01, ***p < 0.001)
Fig. 3
Fig. 3
Intracellular behaviors of PLNPCu. a The cytotoxicity of PLNPCu and LOX against 4T1 cells (n = 5). b The flow cytometry analysis of cellular uptake of different agents (LOX@FITC, LNPCu@FITC, PLNPCu@FITC pH = 7.4 and PLNPCu@FITC pH = 6.5) after 3 h of incubation with 4T1 cells. (n = 3) c The lactate consumption analysis in 4T1 cell supernatant after treatment with PLNPCu. (n = 3) d Fluorescent microscopy image of intracellular ROS generation. Scale bars, 100 μm. e, f The flow cytometry analysis of ROS generation after treatment with PBS, LOX, PLNPCu pH = 6.5 and PLNPCu pH = 7.4. Results were expressed as mean ± SD. The significant difference was calculated via one-way ANOVA analysis (b, c, f). (NS represented not significant, *p < 0.05, **p < 0.01, ***p < 0.001)
Fig. 4
Fig. 4
ICD induction effects of PLNPCu in vitro. a, b Flow cytometric analysis of apoptosis rate of 4T1 cells after treatment with PBS, LOX, PLNPCu pH = 7.4 and PLNPCu pH = 6.5. c, d The flow cytometric analysis and quantitative results of relative fluorescence intensity of CRT on 4T1 cells. e Fluorescent microscopy image of CRT exposure. Scale bars, 100 μm. f Fluorescent microscopy image of HMGB1 outflow from the nucleus. Scale bars, 100 μm. g The ATP secretion from cancer cells after different treatments. Results were expressed as mean ± SD. The significant difference was calculated via one-way ANOVA analysis (b, d, g). (NS represented not significant, *p < 0.05, **p < 0.01, ***p < 0.001)
Fig. 5
Fig. 5
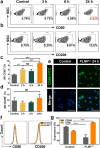
Immunomodulatory effects on macrophages of PLNPCu in vitro. a, c The flow cytometric analysis and quantitative results of CD80 (M1 macrophages marker) on RAW 264.7 macrophages after incubation with PLNPCu for different times (3, 6, 24 h). b, d The flow cytometric analysis and quantitative results of CD206 (M2 macrophages marker) on RAW 264.7 macrophages after treatment. e Immunofluorescence examination of RAW 264.7 macrophages after incubation with PLNPCu for 24 h. Scale bars, 50 μm. f, gThe flow cytometric analysis and quantitative results of CD80 and CD206 on M2-macrophages after treatment. Results were expressed as mean ± SD. The significant difference was calculated via one-way ANOVA analysis (c, d, g). (NS represented not significant, *p < 0.05, **p < 0.01, ***p < 0.001)
Fig. 6
Fig. 6
Antitumor effects of PLNPCu in vivo. a The treatment scheme of PLNPCu. b, c Individual tumor growth curves and average tumor growth curves of the mice with different treatments. d Body weight of the mice during the therapy. e The lactate consumption effect after treatment in vivo. Results were expressed as mean ± SD. The significant difference was calculated via one-way ANOVA analysis (c, e). (NS represented not significant, *p < 0.05, **p < 0.01, ***p < 0.001)
Fig. 7
Fig. 7
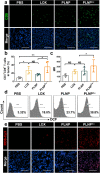
Immunogenic CDT induced an immune-active TME in vivo. a Immunofluorescence staining of intratumor infiltrating CD8+ T cells after treatments with PBS, LOX, PLNP and PLNPCu. Scale bars, 100 μm. b The flow cytometry analysis of tumor infiltration of CD3+CD8+ T cells. c, d The flow cytometry analysis of ROS generation after treatments. e Immunofluorescence staining of intratumor ROS generation. Scale bars, 100 μm. Results were expressed as mean ± SD. The significant difference was calculated via one-way ANOVA analysis (b, c). (NS represented not significant, *p < 0.05, **p < 0.01, ***p < 0.001)
Fig. 8
Fig. 8
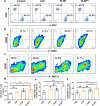
Immune activation by PLNPCu in vivo. a The flow cytometric images of the CD4+ T cells and CD8+ T cells in spleen (gated on CD3+ T cells). b The flow cytometric images of the CD80+CD86+ DCs in LNs (gated on CD11+ DCs). c The flow cytometric images of the CD86+MHC II + DCs in LNs (gated on CD11+ DCs). d The flow cytometric quantification of the rate of CD8+/CD4+ T cells in spleen. e The flow cytometric quantification of the CD86+CD80+ DCs in LNs. f The CD86+MHC II+ DCs in LNs. Results were expressed as mean ± SD. The significant difference was calculated via one-way ANOVA analysis (df). (NS represented not significant, *p < 0.05, **p < 0.01, ***p < 0.001).

Similar articles

Cited by

References

    1. Mbeunkui F, Johann DJ. Cancer and the tumor microenvironment: a review of an essential relationship. Cancer Chemotherapy Pharmacol. 2009;63:571–582. doi: 10.1007/s00280-008-0881-9. - DOI - PMC - PubMed
    1. Doherty JR, Cleveland JL. Targeting lactate metabolism for cancer therapeutics. J Clin Invest. 2013;123:3685–3692. doi: 10.1172/JCI69741. - DOI - PMC - PubMed
    1. Certo M, Tsai CH, Pucino V, Ho PC, Mauro C. Lactate modulation of immune responses in inflammatory versus tumour microenvironments. Nat Rev Immunol. 2020;21:151–161. doi: 10.1038/s41577-020-0406-2. - DOI - PubMed
    1. Romero-Garcia S, Moreno-Altamirano MMB, Prado-Garcia H, Javier Sanchez-Garcia F. Lactate contribution to the tumor microenvironment: mechanisms, effects on immune cells and therapeutic relevance. Front Immunol. 2016;7:52. doi: 10.3389/fimmu.2016.00052. - DOI - PMC - PubMed
    1. Hirschhaeuser F, Sattler UGA, Mueller-Klieser W. Lactate: a metabolic key player in cancer. Cancer Res. 2011;71:6921–6925. doi: 10.1158/0008-5472.CAN-11-1457. - DOI - PubMed

MeSH terms