. 2022;13(3):879-899.
doi: 10.1016/j.jcmgh.2021.12.008. Epub 2021 Dec 16.

Hepatic TM6SF2 Is Required for Lipidation of VLDL in a Pre-Golgi Compartment in Mice and Rats

Affiliations

Hepatic TM6SF2 Is Required for Lipidation of VLDL in a Pre-Golgi Compartment in Mice and Rats

Fei Luo et al. Cell Mol Gastroenterol Hepatol. 2022.

Abstract

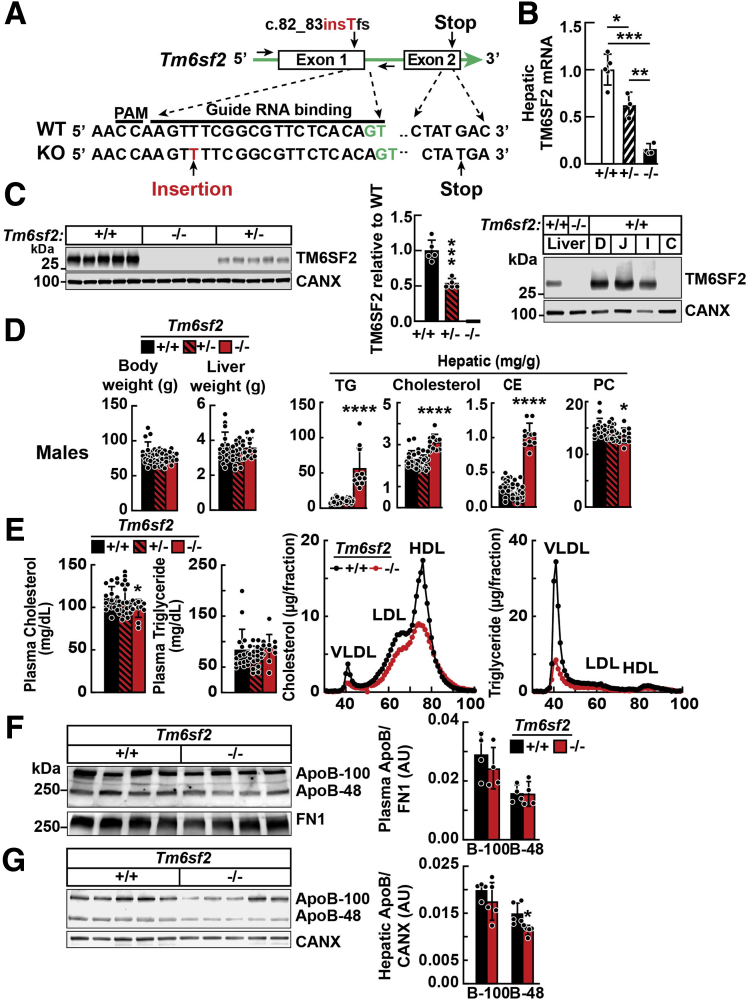
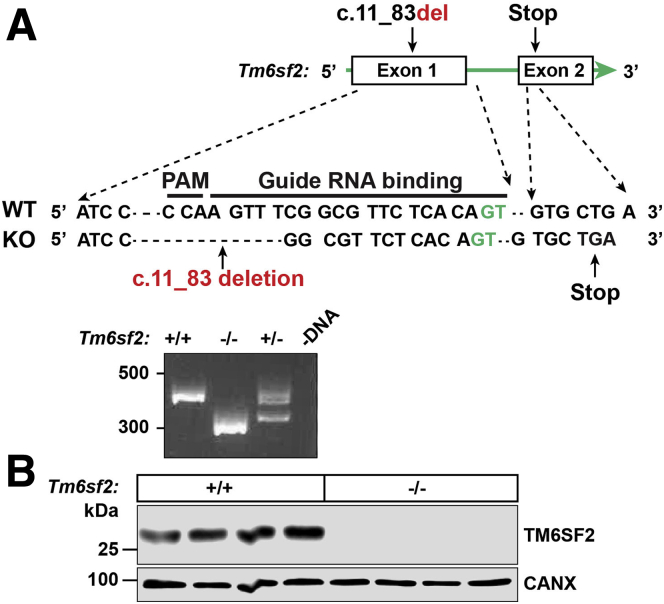
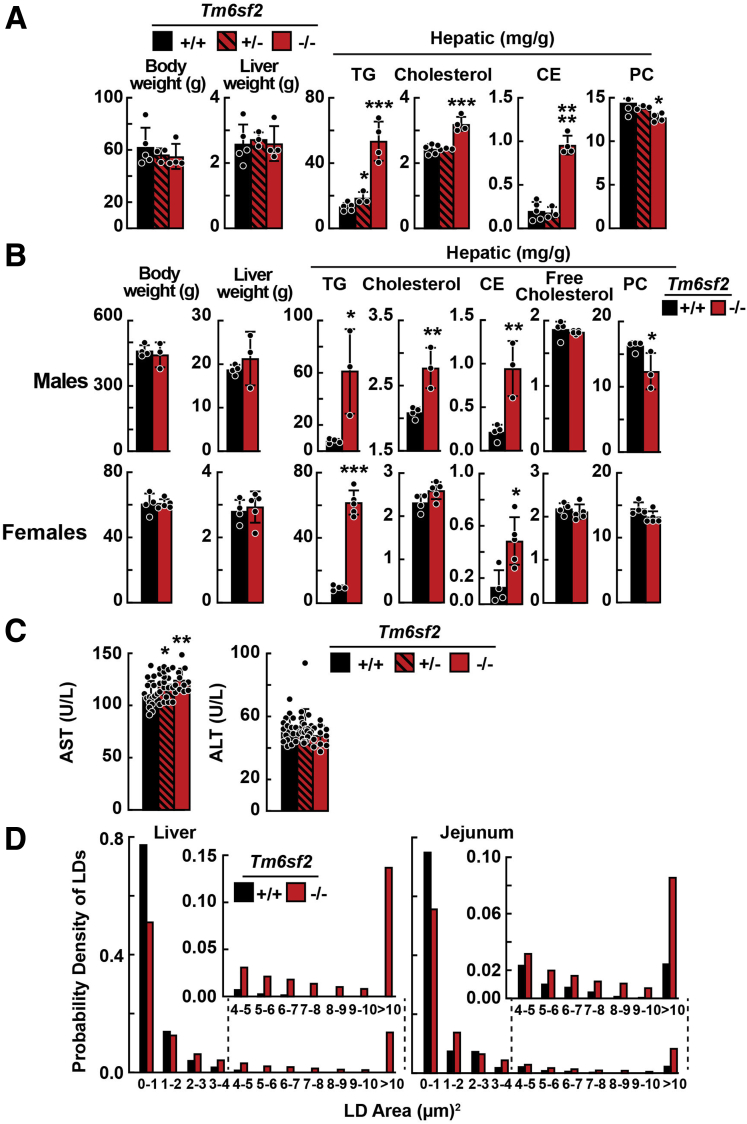
Background & aims: Substitution of lysine for glutamic acid at residu 167 in Transmembrane 6 superfamily member 2 (TM6SF2) is associated with fatty liver disease and reduced plasma lipid levels. Tm6sf2-/- mice replicate the human phenotype but were not suitable for detailed mechanistic studies. As an alternative model, we generated Tm6sf2-/- rats to determine the subcellular location and function of TM6SF2.

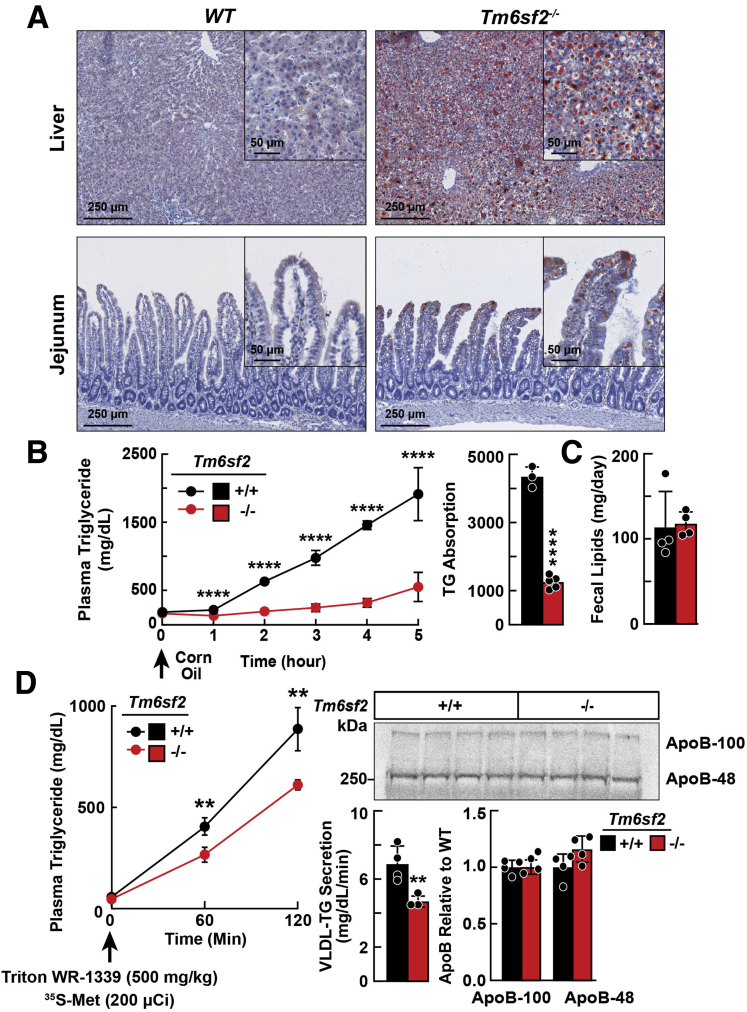
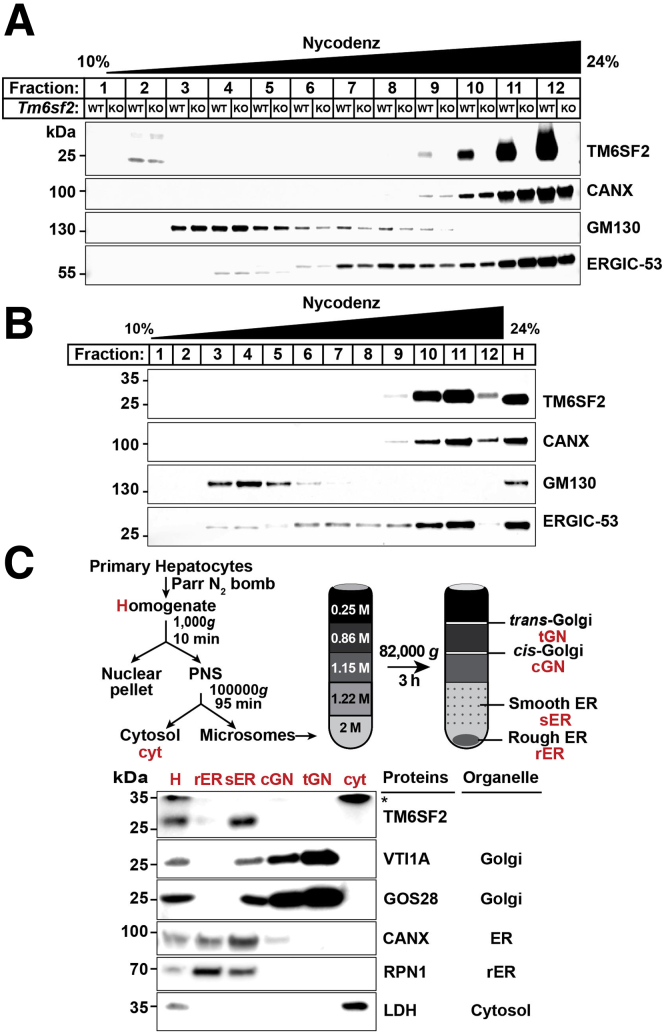
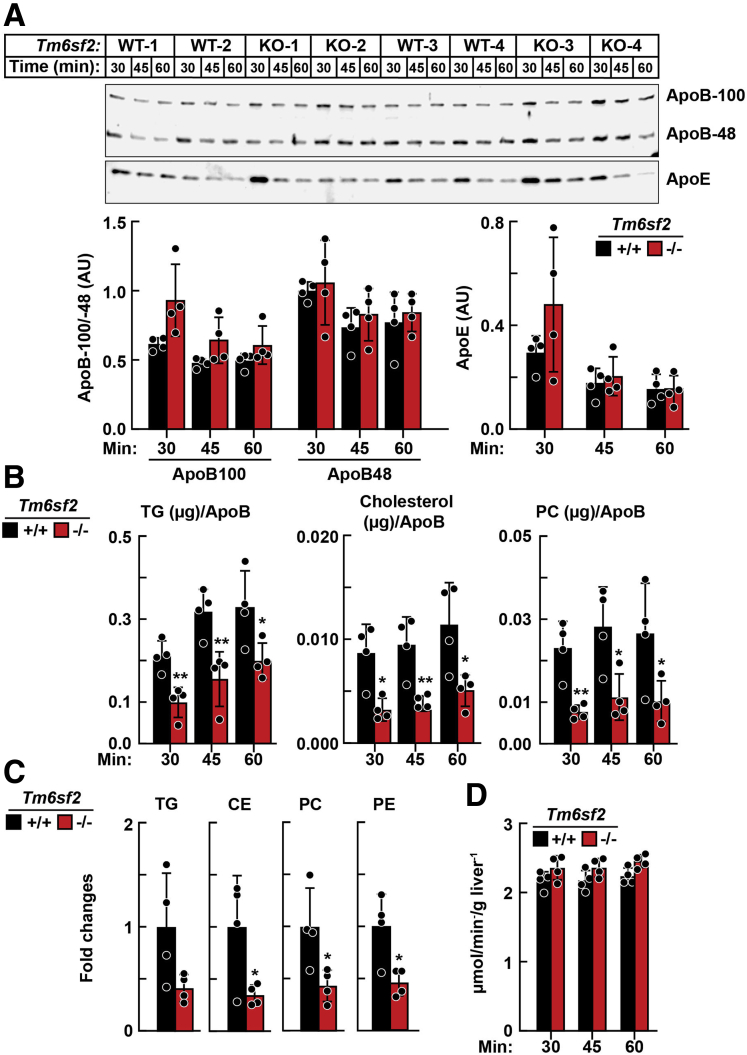
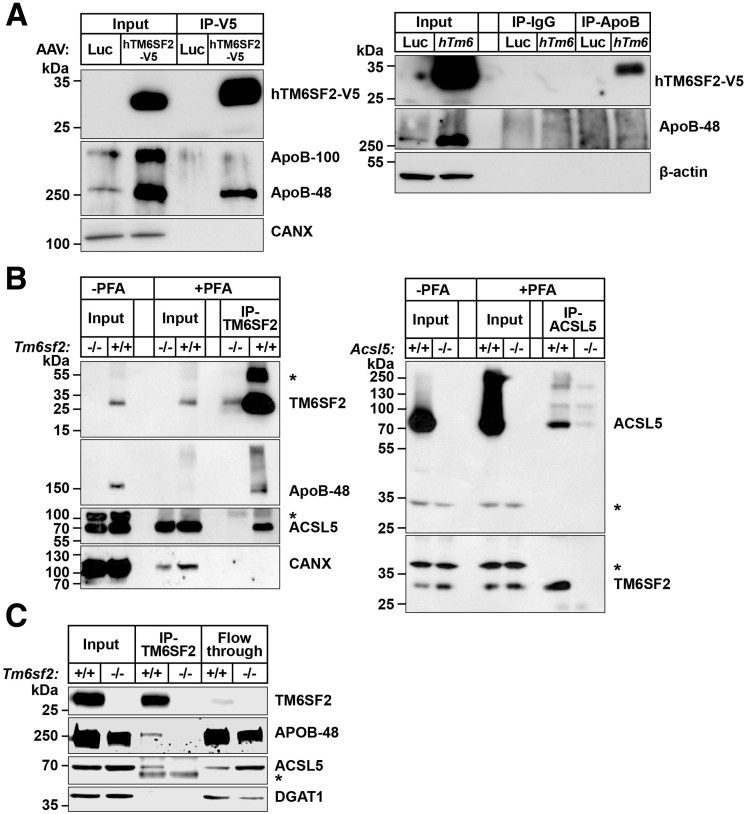
Methods: Two lines of Tm6sf2-/- rats were established using gene editing. Lipids from tissues and from newly secreted very low density lipoproteins (VLDLs) were quantified using enzymatic assays and mass spectrometry. Neutral lipids were visualized in tissue sections using Oil Red O staining. The rate of dietary triglyceride (TG) absorption and hepatic VLDL-TG secretion were compared in Tm6sf2-/- mice and in their wild-type littermates. The intracellular location of TM6SF2 was determined by cell fractionation. Finally, TM6SF2 was immunoprecipitated from liver and enterocytes to identify interacting proteins.

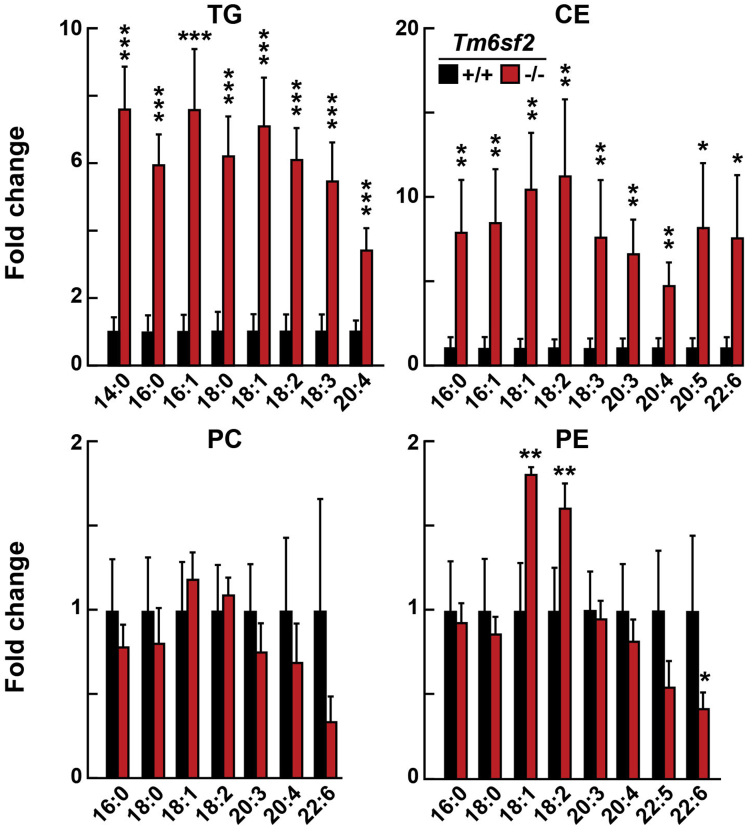
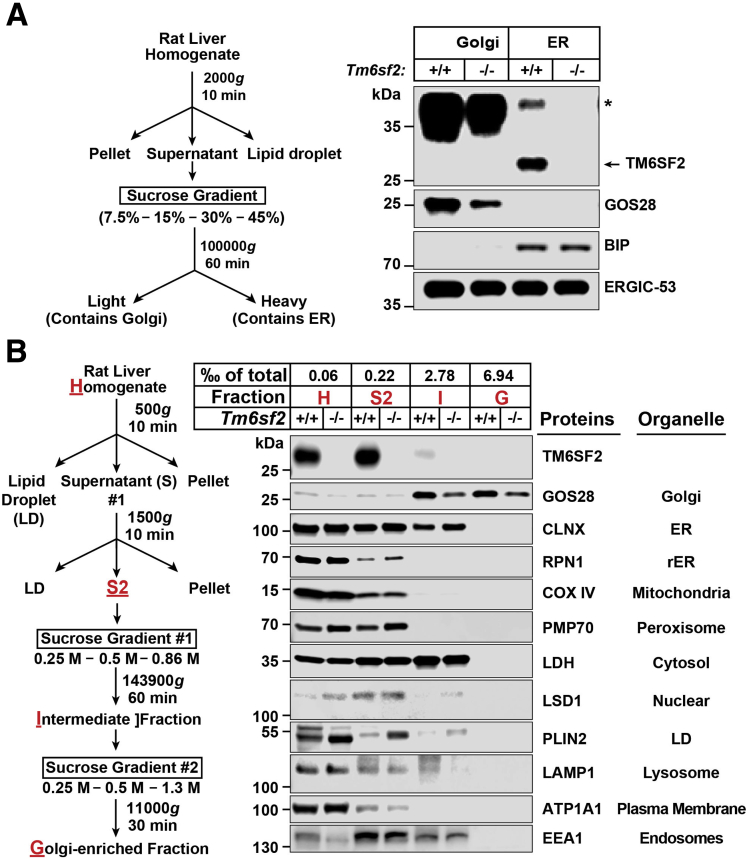
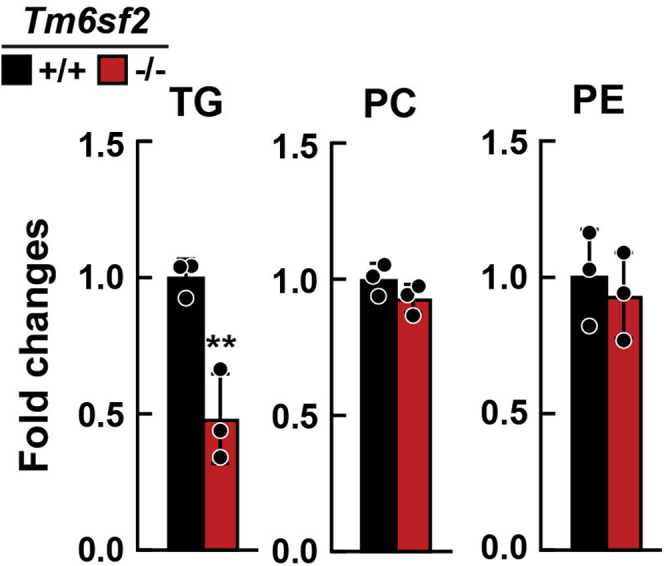
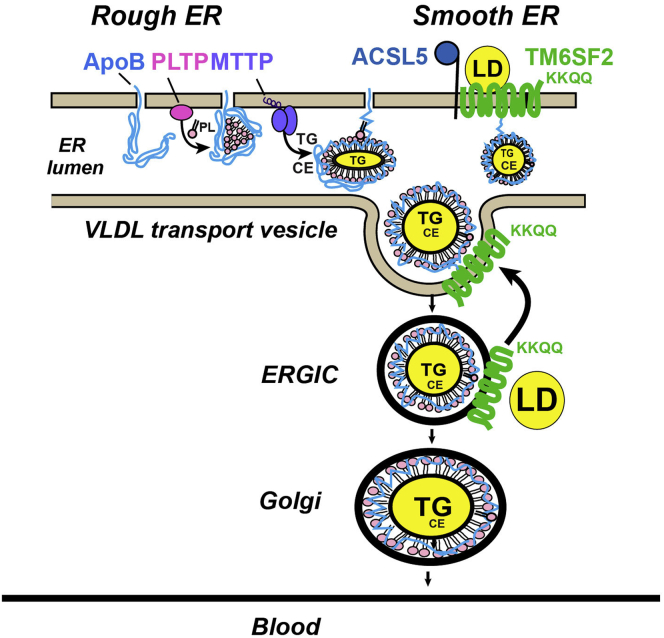
Results: Tm6sf2-/- rats had a 6-fold higher mean hepatic TG content (56.1 ± 28.9 9 vs 9.8 ± 3.9 mg/g; P < .0001) and lower plasma cholesterol levels (99.0 ± 10.5 vs 110.6 ± 14.0 mg/dL; P = .0294) than their wild-type littermates. Rates of appearance of dietary and hepatic TG into blood were reduced significantly in Tm6sf2-/- rats (P < .001 and P < .01, respectively). Lipid content of newly secreted VLDLs isolated from perfused livers was reduced by 53% (TG) and 62% (cholesterol) (P = .005 and P = .01, respectively) in Tm6sf2-/- mice. TM6SF2 was present predominantly in the smooth endoplasmic reticulum and endoplasmic reticulum-Golgi intermediate compartments, but not in Golgi. Both apolipoprotein B-48 and acyl-CoA synthetase long chain family member 5 physically interacted with TM6SF2.

Conclusions: TM6SF2 acts in the smooth endoplasmic reticulum to promote bulk lipidation of apolipoprotein B-containing lipoproteins, thus preventing fatty liver disease.

Keywords: Fatty Liver; Liver Perfusion; Triglycerides; VLDL.


Figures

Figure 1
Figure 1
Generation and characterization of Tm6sf2-/-rats using CRISPR/Cas9 technology. (A) Diagram of CRISPR/Cas9-targeted disruption of rat Tm6sf2 by insertion of T in exon 1 (c.80_81insT). Sequences of the guide RNA (gRNA) binding site, protospacer adjacent motif (PAM), and introns (green) are indicated. (B) TM6SF2 mRNA levels in female rat livers (n = 3–5/group, 3–4 wk) were determined using real-time PCR and normalized to levels of cyclophilin B mRNA. (C) Immunoblot of liver lysates (left) and enterocytes (right) from 4- to 5-week-old rats. (D) Body weights, liver weights, and hepatic lipids of chow-fed male rats (n = 11–19/group, 3–4 wk) after a 4-hour fast. (E) Plasma lipid levels were measured in the same rats as used in panel D (left). Plasma samples from WT and Tm6sf2-/- male rats (4/group, 5–6 wk) were pooled and size-fractionated by fast performance liquid chromatography. Cholesterol and TG levels were measured in each fraction (right). (F) Plasma (1 μL) was size-fractionated by 4%–15% gradient SDS–polyacrylamide gel electrophoresis. Levels of APOB were determined by immunoblot analysis using a rabbit polyclonal antibody (ab20737). Bars indicate means ± SD. Differences between groups were analyzed using the Student unpaired 2-tailed t test. ∗P < .05, ∗∗P < .01, and ∗∗∗P < .001, compared with the WT group. All experiments were repeated twice, and results were similar. C, colon; CANX, calnexin; D, duodenum; FN1, fibronectin; HDL, high-density lipoprotein; I, ileum; J, jejunum.
Figure 2
Figure 2
Generation of Tm6sf2-/-rats (line 2) using CRISPR/Cas9 technology. (A) Diagram of CRISPR/Cas9 targeted disruption of rat Tm6sf2 by introducing a deletion of 73 nucleotide into exon 1 (c.11_83del). Exonic and intronic nucleotides are shown in black and green, respectively. The guide RNA (gRNA) binding site and protospacer adjacent motif (PAM) sequence are indicated (top). Genotyping was performed as described in the legend to Figure 1. The amplified PCR fragment was size-fractionated on an agarose gel (bottom). (B) Immunoblot analysis of lysates from livers of 8-week-old female WT and KO rats. CANX, calnexin.
Figure 3
Figure 3
Body weights, liver weights, and hepatic lipids of Tm6sf2-/-rats (lines 1 and 2). (A) Body weight, liver weight, and hepatic lipids were measured in chow-fed female rats (line 1) after a 4-hour fast (n = 3-5/group, 3–4 wk). (B) Body and liver weights plus hepatic lipid levels in Tm6sf2-/- rats (line 2) and their WT littermates. TGs, cholesterol, CEs, and PCs were measured in chow-fed male rats (n = 3–4/group, 12 wk) and female rats (n = 4–5/group, 3–4 wk) after a 4-hour fast. (C) Plasma aspartate aminotransferase (AST) and alanine transaminase (ALT) were measured in the rats used in the experiment shown in Figure 1. (D) Number and size of lipid droplets in hepatocytes and enterocytes. Bars indicate means ± SD. Differences between groups were analyzed using the Student unpaired 2-tailed t test. ∗P < .05; ∗∗P < .01, and ∗∗∗P < .001. All experiments were repeated once and the results were similar. LD, lipid droplets.
Figure 4
Figure 4
Lipidomics of liver from WT and Tm6sf2 KO rats. Livers were collected from chow-fed 6-week-old male rats (n = 3/group) after a 16-hour fast. The fatty acid composition of TGs, CEs, PC, and PE were measured and analyzed by LC-MS as described in the Methods section. Fatty acid content was normalized to the amount of proteins, and presented as fold differences between genotypes. Bars indicate means ± SD. Differences between groups were analyzed using the Student unpaired 2-tailed t test. ∗P < .05, ∗∗P < .01. ∗∗∗P < .001. The experiment was repeated twice and the results were similar.
Figure 5
Figure 5
Lipid accumulation in tissues of Tm6sf2 KOand WT rats. (A) Liver and jejunal tissue sections from chow-fed male WT and KO rats (n = 4/group, 5–6 wk) after a 4-hour fast were stained with Oil Red O and scanned using a NanoZoomer 2.0-HT, digital slide scanner (DM2000), at 10× and 80× magnification. (B) Chow-fed male rats (n = 4/group, 3–4 wk) were fasted for 16 hours and then gavaged with corn oil (10 μL/g body weight). Blood was collected at the indicated times and plasma TG levels were measured (left). TG absorption was calculated by the area under the curve (right). (C) Fecal lipids were extracted from feces of chow-fed female rats (n = 4/group, 13–14 wk) that were collected for 2 days. All experiments were repeated at least once and the results were similar. (D) Male WT and Tm6sf2-/- rats (n = 4/group, 6 wk) were fasted for 4 hours and then given Triton WR-1339 (500 mg/kg) and 200 μCi of [35S] methionine (1175 Ci/mmol) intravenously and blood was collected at the indicated times and plasma TG was measured. Rats were killed after 120 minutes. To detect [35S] labeled-ApoB, 25 μL plasma was processed as described in the Methods section. Membranes were exposed to Phosphor Screen in Fujifilm BAS cassette 2040 (Fujifilm) for 1 week and signals were quantified using a Storm Imager (PharosFX; Bio-Rad). Circles and bars indicate means ± SD. Differences between groups were analyzed using the Student unpaired 2-tailed t test. ∗∗P < .01, and ∗∗∗∗P < .0001.
Figure 6
Figure 6
Relative levels of selected mRNAs encoding genes involved in lipid synthesis. Age-matched, chow-fed male WT and Tm6sf2 KO rats (n = 4–5/group, 6–7 wk) were fasted for 4 hours before livers were harvested, and total RNA was isolated as described in the Methods section. Quantitative real-time PCR assays were performed to assay the relative levels of selected mRNAs in livers of the rats. Expression levels were normalized to levels of cyclophilin and compared relative with levels of WT transcript. The official gene symbols were used for all genes. Bars represent means ± SD. The experiment was repeated once and the results were similar.
Figure 7
Figure 7
Localization of TM6SF2 to the ER and ERGIC using cell fractionation. (A) A diagram of the cell fractionation protocol (left) and immunoblot of fractionated liver lysates (right). Rat liver homogenate (0.5 g) was loaded on a discontinuous sucrose gradient and centrifuged at 100,000g for 1 hour, yielding a light fraction (Golgi) and heavy fraction (ER). Equal proportions (0.8% of total volume) of each fraction were subjected to immunoblot analysis. (B) A diagrammatic scheme of the cell fractionation protocol (left) and immunoblot analysis of cell fractionation of liver lysates (right). Golgi membranes were isolated from livers of WT and Tm6sf2 KO rats after a 16-hour fast. A proportion of each fraction (as indicated) was subjected to immunoblot analysis. All experiments were repeated at least twice and results were similar. ∗Nonspecific band. BIP, binding immunoglobulin protein; CANX, calnexin; COX IV, cytochrome oxidase IV; EEA1, early endosome antigen 1; G, Golgi-enriched fraction; GOS28, Golgi SNAP receptor complex member 1; H, homogenate; I, intermediate fraction; LAMP1, lysosomal-associated membrane protein 1; LDH, lactate dehydrogenase A chain; LSD1, lysine-specific demethylase-1A; Plin2, Perilipin 2; PMP70, 70-kilodalton peroxisomal membrane protein.
Figure 8
Figure 8
Lipid levels of hepatic Golgi fraction from Tm6sf2-/-and WT littermates. Chow-fed male WT and KO rats (n = 3/group, 6–7 wk) were fasted for 16 hours before livers were harvested. Golgi was isolated from livers as described in the Methods section. Lipids of Golgi were analyzed using direct infusion MS/MSALL. The fatty acid content of each individual species of TG, PC, and PE was summed within each lipid class to provide the TG, PC, and PE contents and normalized to the amount of ApoB determined by immunoblot. Fold changes between genotypes are presented. Bars represent means ± SD. Differences between groups were analyzed using the Student unpaired 2-tailed t test. ∗∗P < .01. The experiment was repeated once and the results were similar.
Figure 9
Figure 9
TM6SF2 is located predominantly in the smooth ER. (A) Liver homogenates (0.25 g) of ad libitum chow-fed male WT and Tm6sf2-/- rats or (B) homogenates from cultured rat hepatocytes (CRL1601 cells) were subjected to Nycodenz continuous density gradient centrifugation as described in the Methods section. Equal proportions (∼1%) of each fraction were subjected to immunoblotting for the indicated organelle markers. (C) Schematic of protocol used to separate rough and smooth ER from primary rat hepatocytes as described in the Methods section (top). Immunoblot analysis was performed using equal proportions (∼1%) of each fraction (bottom). ∗Nonspecific band. All experiments were repeated at least twice, and results were similar. CANX, calnexin; cGN, cis-Golgi; cyt, cytosol; GOS28, Golgi SNAP receptor complex member 1; H, homogenate; LDH, lactate dehydrogenase; PNS, postnuclear supernatant; rER, rough ER; RPN1, ribophorin 1; sER, smooth ER; tGN, trans-Golgi; VTI1A, vesicle transport through interaction with t-SNAREs homolog 1A.
Figure 10
Figure 10
VLDL isolated from liver perfusates of Tm6sf2-/-and WT mice.Chow-fed male Tm6sf2-/- and WT littermates (n = 4/group, 11–13 wk) were anaesthetized and given heparin (4 U/g body weight) before harvesting the livers. Livers were perfused for 60 minutes without recirculation using a buffer containing free fatty acids (0.8 mmol/L). The perfusate was collected over 3 intervals (15–30 min, 31–45 min, and 46–60 min). VLDL was isolated from the samples by ultracentrifugation (d = 1.006 g/mL). (A) Immunoblot analysis of ApoB and ApoE in VLDL (12.5 μL) from Tm6sf2-/- and WT mice. Protein levels were quantified using LI-COR Image Studio Lite (LI-COR Biosciences, Lincoln, NE version 5.2.5) and compared using the Student unpaired 2-tailed t test. (B) VLDL lipids from a 15- to 30-minute time interval were assayed enzymatically and (C) by LC-MS as described in the Methods section. The LC-MS/MS data were analyzed using MultiQuant software (SCIEX). The fatty acid content of each individual species of TG, CE, PC, and PE was summed within each lipid class and normalized to ApoB, as determined by immunoblot. Relative fold changes are presented. (D) Livers were perfused at a rate of 8 mL/min. The concentration of O2 (μmol/L) in perfusate was monitored and hepatic O2 consumption was calculated and normalized to liver weight. Bars indicate means ± SD. Differences between groups were analyzed using the Student unpaired 2-tailed t test. ∗P < .05, ∗∗P < .01. Each independent experiment contains 1 WT and 1 KO mouse (such as WT-1 and KO-1), the experiment was repeated 3 times, all the measurements of samples from 4 independent experiments were performed at the same time.
Figure 11
Figure 11
Co-immunoprecipitation of TM6SF2 with ApoB and ACSL5. (A) Hepatic lysates from mice expressing adeno-associated virus (AAV)–human V5-tagged TM6SF2 (hTM6SF2-V5) or AAV-luciferase were precleaned with A/G agarose beads and then (500 μg, input) was incubated with anti-V5 agarose beads (right) or with rabbit anti-mouse ApoB polyclonal antibody (Abcam Cambridge MA) at 4°C overnight. Input (10%) and IP samples were size-fractionated using SDS–polyacrylamide gel electrophoresis (4%–12%) and immunoblotting was performed as described in the Methods section. (B) Mouse intestinal epithelial cells were incubated ± PFA (1%) and then quenched with 1.25 mol/L glycine. Homogenates from PFA-treated cells (PFA-Input) were precleaned with A/G agarose beads and then 500 μg was incubated with mouse anti-mouse TM6SF2 mAb (8B3) (left) or rabbit anti-mouse ACSL5 (25D12) (right). (C) Co-immunoprecipitation of TM6SF2 with ApoB and ACSL5 from rat intestinal epithelial cells. Samples were handled as described in panel A except cells were homogenized in lysis buffer (1% digitonin, 5 mmol/L EDTA, 5 mmol/L ethylene glycol-bis(β-aminoethyl ether)-N,N,N′,N′-tetraacetic acid plus PI) and a total of 500 μg of the lysate (input) was incubated with rabbit anti-rat TM6SF2 antibody (505E (25 μg) at 4°C overnight. The mixture then was incubated with Dynabead protein G at 4°C for 2 hours. Samples were collected as described in the Methods section. Fraction (10%) were subjected to immunoblot analysis. ∗Nonspecific band. All experiments were repeated at least once, and the results were similar. CANX, calnexin.
Figure 12
Figure 12
VLDL secretion pathway highlighting the role of TM6SF2 as reviewed in the Discussion section. MTTP, microsomal triglyceride transport protein; PLTP, phospholipid transfer protein.

References

    1. Younossi Z.M., Koenig A.B., Abdelatif D., Fazel Y., Henry L., Wymer M. Global epidemiology of nonalcoholic fatty liver disease-meta-analytic assessment of prevalence, incidence, and outcomes. Hepatology. 2016;64:73–84. - PubMed
    1. Cohen J.C., Horton J.D., Hobbs H.H. Human fatty liver disease: old questions and new insights. Science. 2011;332:1519–1523. - PMC - PubMed
    1. Buch S., Stickel F., Trepo E., Way M., Herrmann A., Nischalke H.D., Brosch M., Rosendahl J., Berg T., Ridinger M., Rietschel M., McQuillin A., Frank J., Kiefer F., Schreiber S., Lieb W., Soyka M., Semmo N., Aigner E., Datz C., Schmelz R., Bruckner S., Zeissig S., Stephan A.M., Wodarz N., Deviere J., Clumeck N., Sarrazin C., Lammert F., Gustot T., Deltenre P., Volzke H., Lerch M.M., Mayerle J., Eyer F., Schafmayer C., Cichon S., Nothen M.M., Nothnagel M., Ellinghaus D., Huse K., Franke A., Zopf S., Hellerbrand C., Moreno C., Franchimont D., Morgan M.Y., Hampe J. A genome-wide association study confirms PNPLA3 and identifies TM6SF2 and MBOAT7 as risk loci for alcohol-related cirrhosis. Nat Genet. 2015;47:1443–1448. - PubMed
    1. Romeo S., Kozlitina J., Xing C., Pertsemlidis A., Cox D., Pennacchio L.A., Boerwinkle E., Cohen J.C., Hobbs H.H. Genetic variation in PNPLA3 confers susceptibility to nonalcoholic fatty liver disease. Nat Genet. 2008;40:1461–1465. - PMC - PubMed
    1. Kozlitina J., Smagris E., Stender S., Nordestgaard B.G., Zhou H.H., Tybjaerg-Hansen A., Vogt T.F., Hobbs H.H., Cohen J.C. Exome-wide association study identifies a TM6SF2 variant that confers susceptibility to nonalcoholic fatty liver disease. Nat Genet. 2014;46:352–356. - PMC - PubMed

Publication types

Substances