. 2022 Feb;12(2):480-493.
doi: 10.1002/2211-5463.13353. Epub 2021 Dec 29.

RNA sequencing of glioblastoma tissue slice cultures reveals the effects of treatment at the transcriptional level

Affiliations

RNA sequencing of glioblastoma tissue slice cultures reveals the effects of treatment at the transcriptional level

Susann Haehnel et al. FEBS Open Bio. 2022 Feb.

Abstract

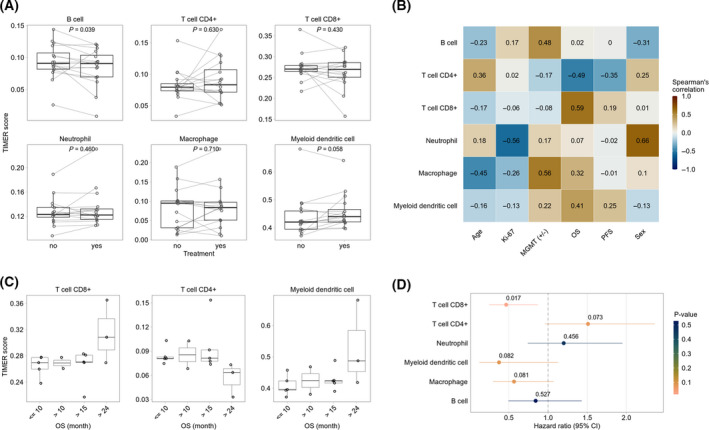
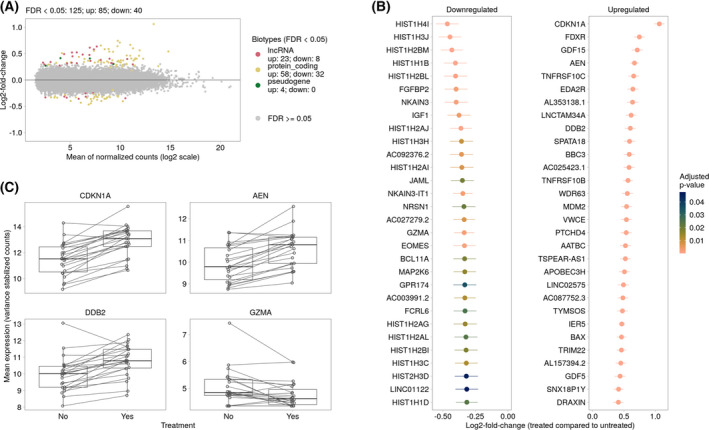
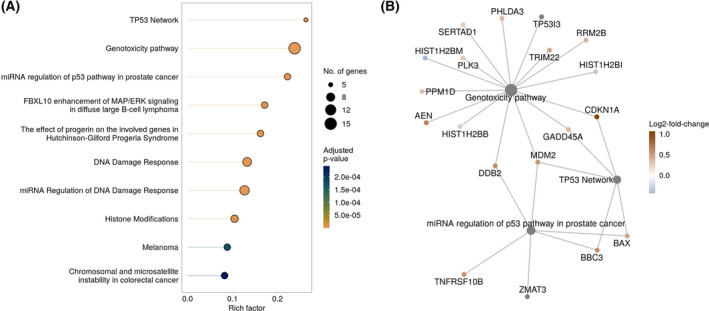
One of the major challenges in cancer research is finding models that closely resemble tumors within patients. Human tissue slice cultures are a promising approach to provide a model of the patient's tumor biology ex vivo. Recently, it was shown that these slices can be successfully analyzed by whole transcriptome sequencing as well as automated histochemistry, increasing their usability as preclinical model. Glioblastoma multiforme (GBM) is a highly malignant brain tumor with poor prognosis and little is known about its genetic background and heterogeneity regarding therapy success. In this study, tissue from the tumors of 25 patients with primary GBM was processed into slice cultures and treated with standard therapy (irradiation and temozolomide). Total RNA sequencing and automated histochemistry were performed to enable analysis of treatment effects at a transcriptional and histological level. Slice cultures from long-term survivors (overall survival [OS] > 24 months) exhibited more apoptosis than cultures from patients with shorter OS. Proliferation within these slices was slightly increased in contrast to other groups, but not significantly. Among all samples, 58 protein-coding genes were upregulated and 32 downregulated in treated vs. untreated slice cultures. In general, an upregulation of DNA damage-related and cell cycle checkpoint genes as well as enrichment of genotoxicity pathways and p53-dependent signaling was found after treatment. Overall, the current study reproduces knowledge from former studies regarding the feasibility of transcriptomic analyses and automated histology in tissue slice cultures. We further demonstrate that the experimental data merge with the clinical follow-up of the patients, which improves the applicability of our model system.

Keywords: RNA sequencing; glioblastoma multiforme; radiochemotherapy; tissue slice cultures.


Conflict of interest statement

The authors declare no conflict of interest.

Figures

Fig. 1
Fig. 1
TUNEL (A–D) and Ki67 (E–H) staining in treated (light gray) or untreated (dark gray) GBM tissue slices. Treated (light gray, ‘TMZ+4 Gy’) or untreated slices (dark gray, ‘untreated’) were stained with TUNEL assay (red, A–D) or with an antibody against Ki67 (green, E‐H). Fluorescence (A, E) and bright‐field images (B, F) were recorded by a digital slidescanner. Representative images of untreated sectional samples are presented (A‐B, E‐F). For quantification, the total tissue area, DAPI‐positive nuclei area, and the Ki67‐positive or TUNEL‐positive area were determined. Samples were assorted in groups concerning OS (months) and PFS (months). Numbers of biological replicates are as follows: OS ≤ 10: n = 10, OS > 10: n = 2, OS > 15: n = 7, OS > 24: n = 3, PFS ≤ 7: n = 9, PFS > 7: n = 5, PFS > 12: n = 4. Outliers are marked with small circles (O) and extreme values are marked with small asterisks (*). Scale bars: 500, 100 µm in the caption. P‐values were adjusted by Kruskal–Wallis test with Dunn's post hoc test for multiple comparisons. Large asterisks centered above the brackets indicate significant differences: ***P ≤ 0.001, **P ≤ 0.01, *P ≤ 0.05.
Fig. 2
Fig. 2
Immune microenvironment analyses. (A) Estimated relative abundance of tumor‐infiltrating immune cells using the TIMER deconvolution method in treated and untreated GBM tissue samples. Lines between dots indicate paired samples from the same patient. For patients with more than one replicate, the median relative abundance was calculated. The P‐values indicate the statistical significance from the Wilcoxon test for paired samples. (B) The heatmap presents Spearman’s correlation of clinical parameters and the relative abundance of tumor‐infiltrating immune cells in untreated samples. (C) Examples from correlation analysis (B) between relative abundance of immune cell types and OS. (D) Association of relative abundance of tumor‐infiltrating immune cells with overall patient survival. A univariate Cox regression was performed for untreated samples. The forest plot represents the HR and corresponding 95% confidence intervals (95%CI). The colors and the numbers above the HRs depict the statistical significance (Wald test).
Fig. 3
Fig. 3
Differential gene expression analysis between treated and untreated GBM tissue samples. (A) The MA‐plot represents the relationship between normalized mean expression values and lfcs for all analyzed genes. Each dot represents a gene. Significantly DEGs (FDR < 0.05) are colored according to their gene biotype. The legend shows the number of significantly upregulated (up) and downregulated (down) genes for each gene biotype. (B) Top 20 down‐ and up‐regulated significantly regulated genes (treated compared to untreated samples). Genes are ranked by their shrunken lfcs and colored according to their adjusted P‐values. The vertical lines represent their estimates of standard error. (C) Examples of DEGs between treated and untreated GBM samples. Each dot represents one patient, the line links treated and untreated samples. For patients with more than one replicate, the average variance stabilized expression values were calculated.
Fig. 4
Fig. 4
Pathway enrichment analysis of DEGs between treated and untreated GBM samples. (A) The top 10 significantly enriched pathways (FDR < 0.05) form the WikiPathways database identified by over‐representation analysis. The x‐axis indicates the rich factor which is the number of DEGs in the pathway divided by the number of background genes in the pathway. The size of the bubble indicates the number of involved DEGs in the pathway. The colors indicate adjusted P‐values of the significantly enriched pathways. (B) The linkages of genes and pathways as a network are shown. Significantly downregulated genes are shown in blue, upregulated genes in red. Shown are the identified DEGs of the three most enriched pathways.

References

    1. Louis DN, Perry A, Reifenberger G, von Deimling A, Figarella‐Branger D, Cavenee WK, et al. The 2016 World Health Organization Classification of Tumors of the Central Nervous System: a summary. Acta Neuropathol. 2016;131(6):803–20. 10.1007/s00401-016-1545-1 - DOI - PubMed
    1. Louis DN, Ohgaki H, Wiestler OD, Cavenee WK, Burger PC, Jouvet A, et al. The 2007 WHO classification of tumours of the central nervous system. Acta Neuropathol. 2007;114(2):97–109. 10.1007/s00401-007-0243-4 - DOI - PMC - PubMed
    1. Wesseling P, Capper D. WHO 2016 classification of gliomas. Neuropathol Appl Neurobiol. 2018;44(2):139–50. 10.1111/nan.12432 - DOI - PubMed
    1. Stupp R, Mason WP, van den Bent MJ, Weller M, Fisher B, Taphoorn MJB, et al. Radiotherapy plus concomitant and adjuvant temozolomide for glioblastoma. N Engl J Med. 2005;352(10):987–96. 10.1056/nejmoa043330 - DOI - PubMed
    1. Stupp R, Hegi ME, Mason WP, van den Bent MJ, Taphoorn MJB, Janzer RC, et al. Effects of radiotherapy with concomitant and adjuvant temozolomide versus radiotherapy alone on survival in glioblastoma in a randomised phase III study: 5‐year analysis of the EORTC‐NCIC trial. Lancet Oncol. 2009;10(5):459–66. 10.1016/S1470-2045(09)70025-7 - DOI - PubMed

Publication types