. 2022 Aug;18(8):1915-1931.
doi: 10.1080/15548627.2021.2008691. Epub 2021 Dec 19.

Autophagy modulates cell fate decisions during lineage commitment

Affiliations

Autophagy modulates cell fate decisions during lineage commitment

Kulbhushan Sharma et al. Autophagy. 2022 Aug.

Abstract

Early events during development leading to exit from a pluripotent state and commitment toward a specific germ layer still need in-depth understanding. Autophagy has been shown to play a crucial role in both development and differentiation. This study employs human embryonic and induced pluripotent stem cells to understand the early events of lineage commitment with respect to the role of autophagy in this process. Our data indicate that a dip in autophagy facilitates exit from pluripotency. Upon exit, we demonstrate that the modulation of autophagy affects SOX2 levels and lineage commitment, with induction of autophagy promoting SOX2 degradation and mesendoderm formation, whereas inhibition of autophagy causes SOX2 accumulation and neuroectoderm formation. Thus, our results indicate that autophagy-mediated SOX2 turnover is a determining factor for lineage commitment. These findings will deepen our understanding of development and lead to improved methods to derive different lineages and cell types.Abbreviations: ACTB: Actin, beta; ATG: Autophagy-related; BafA1: Bafilomycin A1; CAS9: CRISPR-associated protein 9; CQ: Chloroquine; DE: Definitive endoderm; hESCs: Human Embryonic Stem Cells; hiPSCs: Human Induced Pluripotent Stem Cells; LAMP1: Lysosomal Associated Membrane Protein 1; MAP1LC3: Microtubule-Associated Protein 1 Light Chain 3; MTOR: Mechanistic Target Of Rapamycin Kinase; NANOG: Nanog Homeobox; PAX6: Paired Box 6; PE: Phosphatidylethanolamine; POU5F1: POU class 5 Homeobox 1; PRKAA2: Protein Kinase AMP-Activated Catalytic Subunit Alpha 2; SOX2: SRY-box Transcription Factor 2; SQSTM1: Sequestosome 1; ULK1: unc-51 like Autophagy Activating Kinase 1; WDFY3: WD Repeat and FYVE Domain Containing 3.

Keywords: Autophagosome; SOX2; differentiation; ectoderm; endoderm; mesoderm; pluripotent stem cells.


Conflict of interest statement

No potential conflict of interest was reported by the author(s).

Figures

Figure 1.
Figure 1.
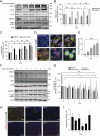
Autophagy is induced during DE differentiation. (A) Cell lysates from AG27 hiPSCs were collected at the indicated time points until DE formation (confirmed by RTqPCR and fluorescence microscopy) and analyzed by Western blotting using the indicated antibodies. The blots are representative of three independent experiments (n = 3). ACTB/beta actin was used as a loading control. (B–D) Quantification of the indicated protein levels during DE formation (0 and 48 h) in AG27 cells. The relative expression levels were normalized to that at 0 h and are presented as the mean of three independent experiments (n = 3); error bars represent SD. *P < 0.1, **P < 0.01, ***P < 0.001; (B) WDFY levels (relative to ACTB) and phospho-ULK1 (Ser-555):total ULK1 levels, (C) SQSTM1 levels (relative to ACTB), (D) LC3B-I and LC3B-II levels (relative to ACTB). (E) The human ESC line, H1, was differentiated to DE and lysed in RIPA buffer at 0 and 48 h, followed by Western blotting using the indicated antibodies. The blots are representative of three independent experiments. ACTB was used as a loading control. * represents RPS6KB p85 and ** represents phosphorylated RPS6KB p85 that are both recognized by the anti-RPS6KB kinase antibody. (F) Quantification of p-ULK1:ULK1 and p-RPS6KB:RPS6KB levels (relative to ACTB) during DE formation from H1 cells (0–48 h). The relative expression levels were normalized to that at 0 h and are presented as the mean of three independent experiments (n = 3); error bars represent SD. *P < 0.1, **P < 0.01, ***P < 0.001. (G) Quantification of SQSTM1 and LC3B-II levels (relative to ACTB) during DE formation from H1 cells (0–48 h). The relative expression levels were normalized to that at 0 h and are presented as the mean of three independent experiments (n = 3); error bars represent SD. *P < 0.1, **P < 0.01, ***P < 0.001. (H) Schematic diagram showing the principle of the mCherry-EGFP double-tag (dt) approach to monitor autophagic flux. mCherry-EGFP-tagged LC3B is visualized as yellow puncta in both phagophore and autophagosome structures, while after lysosomal fusion only red puncta are observed due to quenching of the EGFP signal in the acidic lysosome. (I) AG27 hiPSCs with stable doxycycline-inducible expression of mCherry-EGFP-LC3B were grown in full media or starved (EBSS) for 1 h in the absence or presence of the ULK1 inhibitor MRT68921 (EBSS+MRT) to study autophagosome formation and autophagic flux. Arrowheads indicate autolysosomes (red only structures). Image is representative of three independent experiments. Scale bar: 10 µm. (J) AG27 hiPSCs expressing mCherry-EGFP-LC3B were seeded as single cells and differentiated to DE. The cells were fixed at different time points after induction of differentiation and processed for microscopy. Images are representative of three independent experiments. Scale bar: 10 µm. (K) Quantification of the number of red-only puncta formed during DE differentiation from images as shown in (J). A minimum of 20 images at each time point (n = 20) were used for quantification with ImageJ analysis. Error bars represent SD. **P < 0.01. (L) AG27 iPSCs were fixed before (0 h) and after (48 h) DE formation and processed for immunofluorescence microscopy using an anti-LC3B antibody. Representative images with endogenous LC3B spots (green, arrowheads) are shown. Nuclei were counterstained with DAPI. Images are representative of three independent experiments. Scale bar: 10 µm. (M) The number of LC3B puncta formed during DE formation were quantified from a minimum of 20 images from each time point as shown in (L) using ImageJ analysis. Error bars represent SD. **P < 0.01.
Figure 2.
Figure 2.
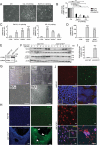
Kinetics of autophagy during differentiation to mesoderm and neuroectoderm. (A) Autophagy kinetics during cardiac differentiation. AG27 human iPSCs were seeded and treated with CHIR on day 3 (8 µM). On day 6, cells were treated with IWP2 (5 µM). Cells started beating between day 8 and 17. Cell lysates were collected at different time points and processed for Western blotting using the indicated antibodies. The blots are representative of three independent experiments (n = 3). ACTB was used as a loading control. (B) Quantification of SQSTM1 and LC3B-II levels (relative to ACTB) during mesoderm (cardiomyocyte) formation from AG27 cells. The relative expression levels were normalized to that at day 0 and are presented as the mean of three independent experiments (n = 3); error bars represent SD. *P < 0.1, **P < 0.01, ***P < 0.001. (C) Quantification of WDFY and p-ULK1 (Ser-555):total ULK1 levels (relative to ACTB) during mesoderm (cardiomyocyte) formation from AG27 cells. The relative expression levels were normalized to that at day 0 and are presented as the mean of three independent experiments (n = 3); error bars represent SD. *P < 0.1, **P < 0.01, ***P < 0.001. (D) AG27 hiPSCs with stable Dox-inducible expression of mCherry-EGFP-LC3B were seeded as single cells and differentiated to cardiomyocytes. The cells were fixed at different days after induction of cardiomyocytes differentiation until day 7 and processed for microscopy. Images are representative of three independent experiments. Scale bar: 10 µm (day 0–5), 100 µm (day 7). (E) The number of LC3B puncta formed during DE formation were quantified from a minimum of 100 cells from each time point (except day 7) as shown in (D) using ImageJ analysis. Error bars represent SD. ***P < 0.001. (F) Autophagy kinetics during neuroectoderm differentiation. AG27 cells were collected at the indicated time points during neuroectoderm differentiation and processed for Western blotting using the indicated antibodies (n = 3). ACTB was used as a loading control. (G) Quantification of WDFY, p-ULK1:ULK1 and LC3B-II levels (relative to ACTB) during neuroectoderm formation (day 0-day 6) from AG27 cells. The relative expression levels were normalized to that at day 0 and are presented as the mean of three independent experiments (n = 3); error bars represent SD. *P < 0.1, **P < 0.01, ***P < 0.001. (H) AG27 hiPSCs with stable Dox-inducible expression of mCherry-EGFP-LC3B were seeded as colonies (EDTA splitting) and differentiated to neuroectoderm. The cells were fixed at different days after induction of neuroectoderm differentiation and processed for microscopy. Images are representative of three independent experiments. Scale bar: 10 µm. (I) The number of red puncta were quantified from a minimum of 100 cells from each time point as shown in (H) using ImageJ analysis. Error bars represent SD.
Figure 3.
Figure 3.
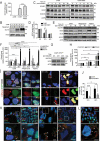
Inhibition of autophagy facilitates exit from pluripotency and drives hiPSC cells toward neuroectoderm. (A) AG27 iPSCs were treated or not with the autophagy inhibitors bafilomycin A1 (BafA1) or chloroquine (CQ) for 4 h before replacing with E8 medium. Representative images of the cell morphology at the 24 h time point are shown (n = 3). Scale bar: 50 µm. (B) AG27 iPSCs were treated as in (A) and processed for RTqPCR analysis at 24 h using TaqMan probes for major pluripotency genes (KLF4, SOX2, NANOG). Untreated iPSCs served as control. The graph shows the average of three independent experiments (n = 3). Error bars represent SD. **P < 0.01, ***P < 0.001. (C) AG27 iPSCs were treated as in (A) and processed for RTqPCR analysis at 24 h using an array card (Fig. S3A) to analyze the transcript levels of genes of various germ layers. The most significant changes in transcript levels are shown and graphs represent an average of three independent experiments (n = 3). Error bars represent SD. *P < 0.05, **P < 0.01, ***P < 0.001. (D) AG27 iPSCs were treated or not with BafA1 or CQ for 24 h and then processed for RTqPCR analysis using an array card (Fig. S3A) to analyze the transcript levels of genes of various germ layers. The graph shows PAX6 expression levels and represents an average of three independent experiments (n = 3). Error bars represent SD. ***P < 0.001. (E) AG27 iPSCs cells were electroporated with guide RNA for ATG7 (Table 1). The tracr-RNA was fluorescently labeled with ATTO dye. Clones were screened using restriction fragment length polymorphism (RFLP). Cell lysates from wild type (WT) and ATG7± hiPSC clones were analyzed by immunoblotting against LC3B to confirm the effect of ATG7 depletion on LC3B lipidation (LC3B-I to LC3B-II conversion) (n = 3). (F) Cells from wild type (WT) and ATG7± hiPSC were differentiated into neuroectoderm using SMAD inhibitors. Lysate was collected daily until day 6 and processed for Western blotting (n = 3). ACTB was used as a loading control. (G) WT and ATG7+/ -AG27 cells were grown as single cells in a 90 mm dish in E8 medium and observed for morphological changes over 30 days post-seeding. Medium was changed every day. Representative images of three independent experiments, taken at different time-points post-seeding are shown. Scale bar: 50 µm. (H) AG27 WT (upper panels) and ATG7± cells (lower panels) were seeded and stained with PAX6 antibodies 3 days after seeding. Nuclei were stained with Hoechst. Images are representative of three independent experiments. Scale bar: 100 µm. (I) RNA was isolated from WT and ATG7±hiPSCs cells grown in cultures for 2 weeks and then analyzed by RTqPCR (TaqMan assay) against PAX6. The graph is a representative of three independent experiments (n = 3). Error bars represent SD. ***P < 0.001. (J) AG27 WT (upper four panels) or ATG7± cells (lower four panels) were grown in cultures for 2 weeks, then fixed and stained with antibodies against TUBB3 and LC3B and analyzed by confocal microscopy. Nuclei were stained with DAPI. Images are representative of three independent experiments. Scale bar: 50 µm.
Figure 4.
Figure 4.
Autophagy modulation affects DE differentiation through SOX2 degradation. (A) AG27 iPSCs were treated with CHIR to induce DE formation in the absence or presence of the MTOR inhibitor rapamycin. After 48 h, SOX17 levels were assessed by RTqPCR. The graph is representative of three independent experiments (n = 3). Error bars represent SD. ***P < 0.001. (B) AG27 iPSCs were treated as in (A) and processed for Western blotting using a SOX17 antibody (n = 3). ACTB was used as a loading control. (C) AG27 cells were treated with CHIR to induce DE differentiation in the absence or presence of the ULK1 inhibitor MRT68921. Cell lysates were collected at different timepoints of DE differentiation and analyzed by Western blotting using antibodies against the pluripotency factors POU5F1, SOX2 and NANOG (n = 3). ACTB was used as a loading control. (D) Quantification of SOX2 levels (relative to ACTB) in lysates from cells treated as in (C) at 0, 12 and 48 h during DE differentiation. The relative expression levels were normalized to that at day 0 and are presented as the mean of three independent experiments (n = 3); error bars represent SD. *P < 0.1, **P < 0.01, ***P < 0.001. (E) Cell lysates from AG27 cells treated or not with autophagy inhibitor, BafA1 or autophagy inducer, rapamycin and were collected at different timepoints (0, 12 and 48 h) of DE differentiation, followed by immunoblotting with the indicated antibodies (n = 3). ACTB was used as loading control. (F) Quantification of SQSTM1, SOX2 and SOX17 levels (relative to ACTB) in cell lysates from BafA1 and rapamycin treated cells during DE differentiation (0, 12 and 48 h). The relative expression levels were normalized to that at day 0 and are presented as the mean of three independent experiments (n = 3); error bars represent SEM. *P < 0.1, **P < 0.01, ***P < 0.001, ****P < 0.0001. (G) Cell lysates from ATG7±cells directed toward DE differentiation at different time points (0, 12 and 48 h) were analyzed by Western blotting using antibodies against FOXA2 and SOX2. ACTB was used as loading control. Blot is representative of three independent experiments. (H) Quantification of SOX2, FOXA2 and SOX17 levels (relative to ACTB) in cell lysates from ATG7± cells during DE differentiation (0, 12 and 48 h). The relative expression levels were normalized to that at day 0 and are presented as the mean of three independent experiments (n = 3); error bars represent SD. *P < 0.1, **P < 0.01, ***P < 0.001. (I) AG27 with stable Dox-inducible expression of mCherry-EGFP-tagged SOX2 were treated with CHIR or CHIR+MRT to induce DE formation. MRT was removed after 8 h of treatment. The cells were fixed at 24 h (left panels) or 48 h (right panels) post treatment and processed for microscopy. Red puncta represent SOX2 in autolysosomes. Images are representative of three independent experiments. Scale bar: 10 µm. (J) Quantification of the number of red-only puncta formed (autophagic flux) during DE differentiation from images as shown in (J). A minimum of 20 images at each time point (n = 20) were used for quantification with ImageJ analysis. Error bars represent SD. **P < 0.01. (K) AG27 were treated with CHIR or CHIR+MRT to induce DE formation. MRT was removed after 8 h of treatment. Cells were fixed at 24 (upper left two panels) or 48 h (upper right two panels) post differentiation, followed by immunofluorescence analysis against endogenous SOX2 and LAMP1 (lysosome marker). Nuclei were counterstained with DAPI. The lower panel represents zoomed images on the indicated region. Images are representative of three independent experiments. Scale bar: 10 µm. (L) AG27 hiPSCs were treated with CHIR to induce DE formation and fixed 24 h post differentiation, followed by immunofluorescence analysis against endogenous SOX2 and SQSTM1. Nuclei were counterstained with Hoechst. Arrowheads show colocalization. Image is representative of three independent experiments. Scale bar: 10 µm.
Figure 5.
Figure 5.
Schematic illustration of the proposed model. Based on our data we propose a model where autophagy-mediated degradation of SOX2 facilitates differentiation toward mesendoderm, whereas downregulation of autophagy leads to SOX2 maintenance, promoting neuroectoderm differentiation. Thus, autophagy functions as a determining factor for lineage commitment.

References

    1. Dikic I, Elazar Z.. Mechanism and medical implications of mammalian autophagy. Nat Rev Mol Cell Biol. 2018;19:349–364. - PubMed
    1. Levine B, Kroemer G. Biological functions of autophagy genes: a disease perspective. Cell. 2019;176:11–42. - PMC - PubMed
    1. Morishita H, Mizushima N. Diverse cellular roles of autophagy. Annu Rev Cell Dev Biol. 2019;35:453–475. - PubMed
    1. Mizushima N, Levine B. Autophagy in mammalian development and differentiation. Nat Cell Biol. 2010;12:823–830. - PMC - PubMed
    1. Galluzzi L, Baehrecke EH, Ballabio A, et al. Molecular definitions of autophagy and related processes. EMBO J. 2017;36:1811–1836. - PMC - PubMed

Publication types