

Fiber mixture-specific effect on distal colonic fermentation and metabolic health in lean but not in prediabetic men
- PMID: 34923911
- PMCID: PMC8726743
- DOI: 10.1080/19490976.2021.2009297
Fiber mixture-specific effect on distal colonic fermentation and metabolic health in lean but not in prediabetic men
Abstract
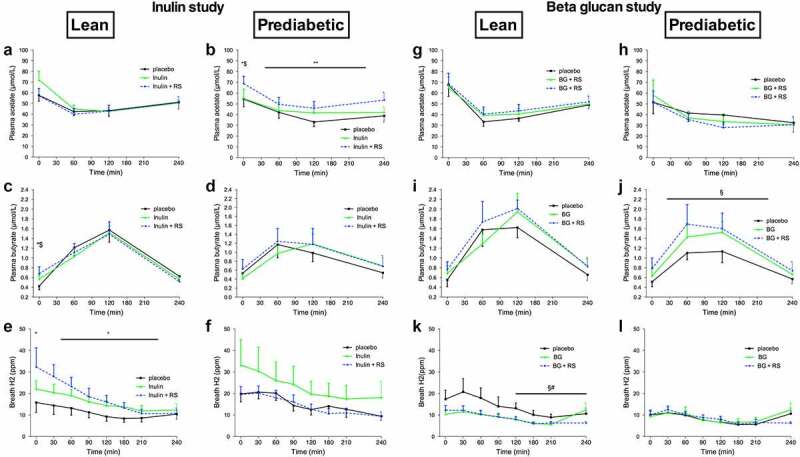
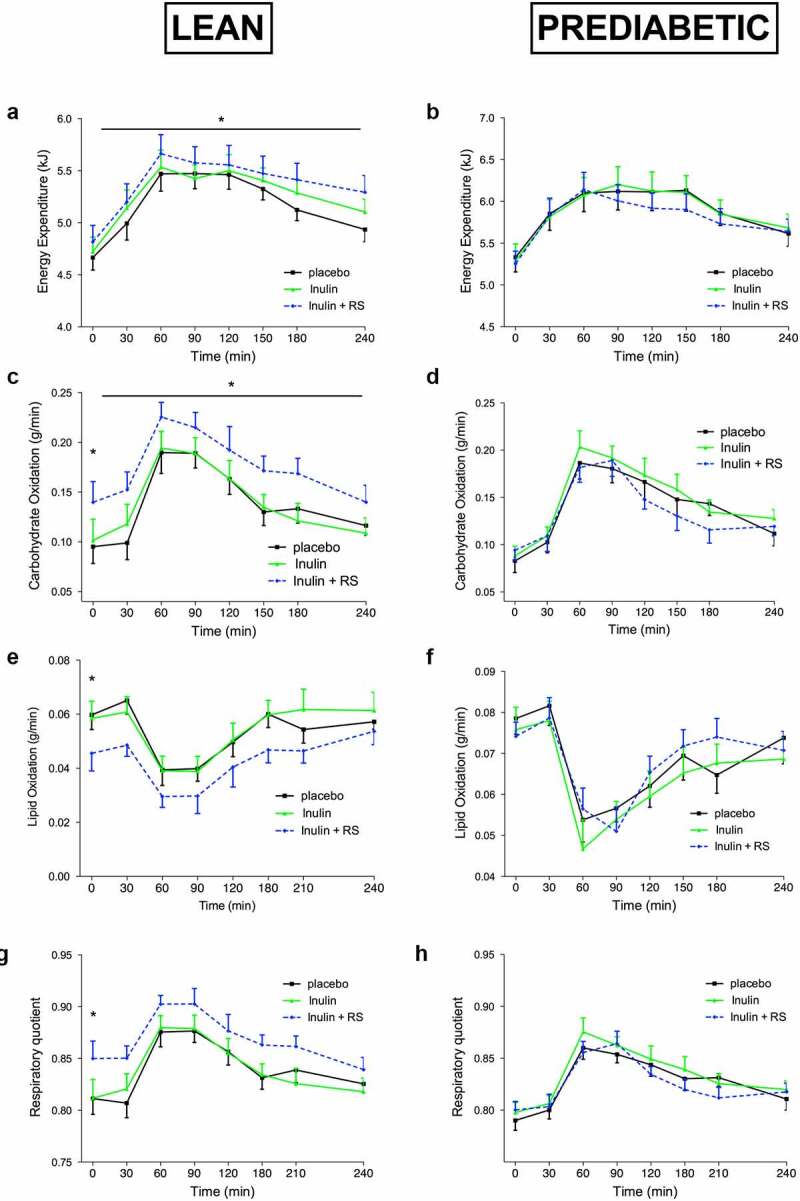
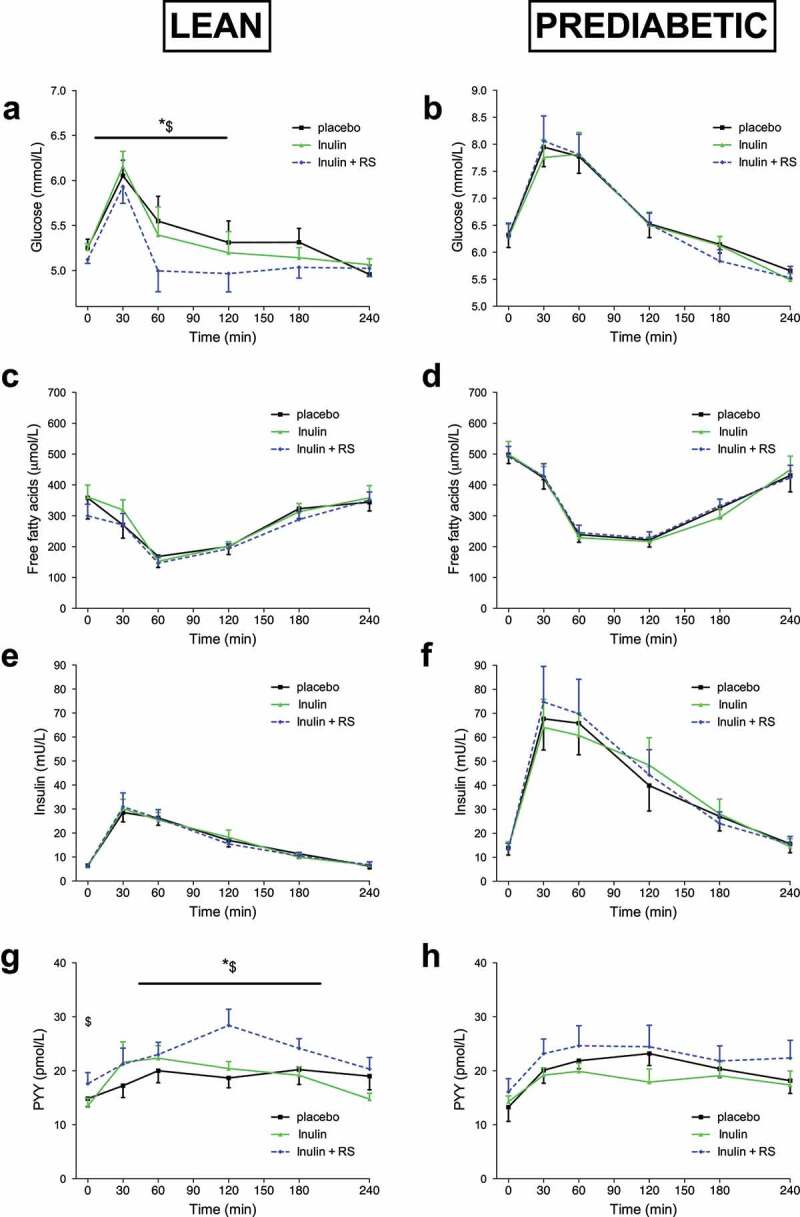
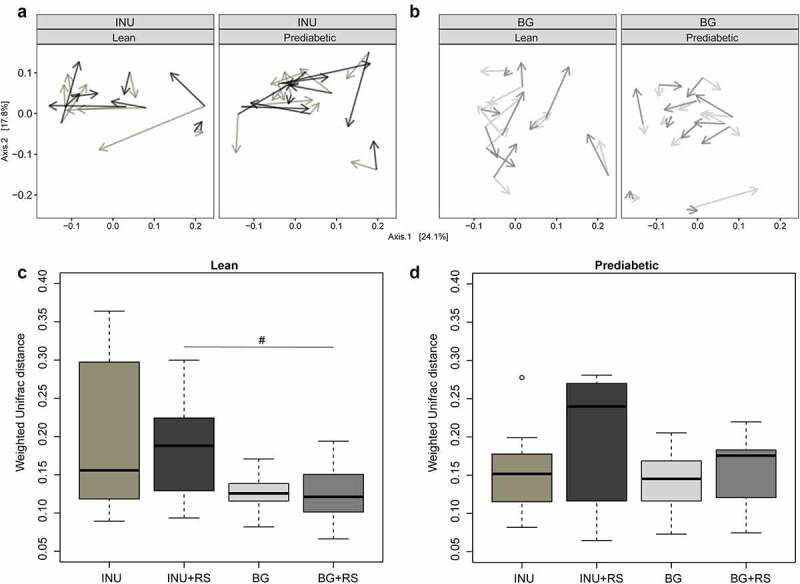
Infusions of the short-chain fatty acid (SCFA) acetate in the distal colon improved metabolic parameters in men. Here, we hypothesized that combining rapidly and slowly fermentable fibers will enhance distal colonic acetate production and improve metabolic health. In vitro cultivation studies in a validated model of the colon were used to identify fiber mixtures that yielded high distal colonic acetate production. Subsequently, in two randomized crossover studies, lean and prediabetic overweight/obese men were included. In one study, participants received supplements of either long-chain inulin+resistant starch (INU+RS), INU or maltodextrin (PLA) the day prior to a clinical investigation day (CID). The second trial studied beta glucan+RS (BG+RS) versus BG and PLA. During each CID, breath hydrogen, indirect calorimetry, plasma metabolites/hormones were assessed during fasting and postprandial conditions. Additionally, fecal microbiota composition and SCFA were determined. In prediabetic men, INU+RS increased plasma acetate compared to INU or PLA (P < .05), but did not affect metabolic parameters. In lean men, INU+RS increased breath hydrogen and fasting plasma butyrate, which was accompanied by increased energy expenditure, carbohydrate oxidation and PYY and decreased postprandial glucose concentrations (all P < .05) compared to PLA. BG+RS increased plasma butyrate compared to PLA (P < .05) in prediabetic individuals, but did not affect other fermentation/metabolic markers in both phenotypes. Fiber-induced shifts in fecal microbiota were individual-specific and more pronounced with INU+RS versus BG+RS. Administration of INU+RS (not BG+RS) the day prior to investigation improved metabolic parameters in lean but not in prediabetic individuals, demonstrating that effects were phenotype- and fiber-specific. Further research should study whether longer-term supplementation periods are required to elicit beneficial metabolic health in prediabetic individuals. Trial registration numbers: Clinical trial No. NCT03711383 (Inulin study) and Clinical trial No. NCT03714646 (Beta glucan study).
Keywords: Short-chain fatty acids; dietary fibers; gut microbiota; substrate metabolism.
Conflict of interest statement
The authors greatly thank all volunteers participating in the studies. The authors thank Prokopis Konstanti for help with 16S rRNA gene analyses. The authors thank all the consortium partners involved for the critical feedback during the development of this project. EEV is an employee of Sensus. MAvdB is an employee of DSM.
Figures
Similar articles
-
Specific dietary fibers steer toward distal colonic saccharolytic fermentation using the microbiota of individuals with overweight/obesity.Food Res Int. 2025 May;209:116271. doi: 10.1016/j.foodres.2025.116271. Epub 2025 Mar 16. Food Res Int. 2025. PMID: 40253188
-
The prebiotic inulin improves substrate metabolism and promotes short-chain fatty acid production in overweight to obese men.Metabolism. 2018 Oct;87:25-35. doi: 10.1016/j.metabol.2018.06.009. Epub 2018 Jun 25. Metabolism. 2018. PMID: 29953876 Clinical Trial.
-
Acute increases in serum colonic short-chain fatty acids elicited by inulin do not increase GLP-1 or PYY responses but may reduce ghrelin in lean and overweight humans.Eur J Clin Nutr. 2017 Aug;71(8):953-958. doi: 10.1038/ejcn.2016.249. Epub 2016 Dec 14. Eur J Clin Nutr. 2017. PMID: 27966574 Free PMC article. Clinical Trial.
-
The Short-Chain Fatty Acid Acetate in Body Weight Control and Insulin Sensitivity.Nutrients. 2019 Aug 18;11(8):1943. doi: 10.3390/nu11081943. Nutrients. 2019. PMID: 31426593 Free PMC article. Review.
-
Short-chain fatty acids and human colonic function: roles of resistant starch and nonstarch polysaccharides.Physiol Rev. 2001 Jul;81(3):1031-64. doi: 10.1152/physrev.2001.81.3.1031. Physiol Rev. 2001. PMID: 11427691 Review.
Cited by
-
Relationship between gut microbiota and the pathogenesis of gestational diabetes mellitus: a systematic review.Front Cell Infect Microbiol. 2024 May 28;14:1364545. doi: 10.3389/fcimb.2024.1364545. eCollection 2024. Front Cell Infect Microbiol. 2024. PMID: 38868299 Free PMC article.
-
Diet-Related Changes of Short-Chain Fatty Acids in Blood and Feces in Obesity and Metabolic Syndrome.Biology (Basel). 2022 Oct 24;11(11):1556. doi: 10.3390/biology11111556. Biology (Basel). 2022. PMID: 36358258 Free PMC article. Review.
-
Dietary butyrate ameliorates metabolic health associated with selective proliferation of gut Lachnospiraceae bacterium 28-4.JCI Insight. 2023 Feb 22;8(4):e166655. doi: 10.1172/jci.insight.166655. JCI Insight. 2023. PMID: 36810253 Free PMC article.
-
A comparison of the effects of resistant starch types on glycemic response in individuals with type 2 diabetes or prediabetes: A systematic review and meta-analysis.Front Nutr. 2023 Mar 27;10:1118229. doi: 10.3389/fnut.2023.1118229. eCollection 2023. Front Nutr. 2023. PMID: 37051127 Free PMC article.
-
Dietary Fiber Intake and Gut Microbiota in Human Health.Microorganisms. 2022 Dec 18;10(12):2507. doi: 10.3390/microorganisms10122507. Microorganisms. 2022. PMID: 36557760 Free PMC article. Review.
References
-
- Canfora EE, Meex RC, Venema K, Blaak EE. Gut microbial metabolites in obesity, NAFLD and T2DM. Nat Rev Endocrinol. 2019;1:261–273. - PubMed
Publication types
MeSH terms
Substances
Associated data
LinkOut - more resources
Full Text Sources
Medical