. 2021 Dec 11:14:6813-6831.
doi: 10.2147/JIR.S338242. eCollection 2021.

Microglia Impede Oligodendrocyte Generation in Aged Brain

Affiliations

Microglia Impede Oligodendrocyte Generation in Aged Brain

Weimin Luan et al. J Inflamm Res. .

Abstract

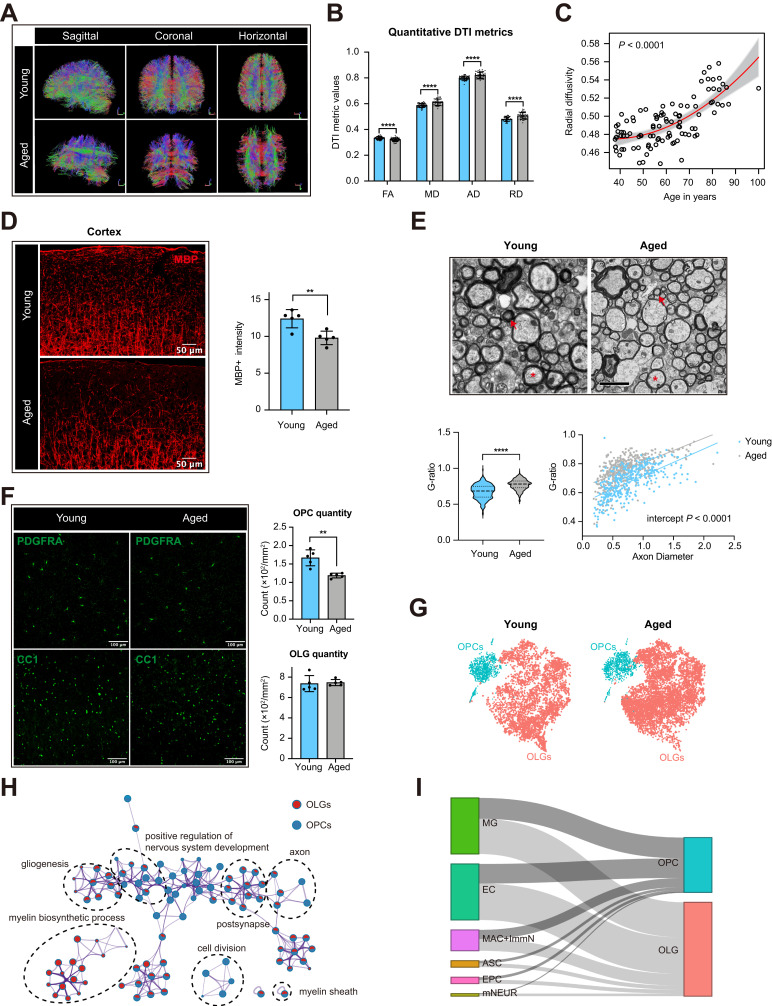
Purpose: Age-related increase in myelin loss may be responsible for brain atrophy, and the mechanism is not completely understood. We aim to comprehensively delineate oligodendrocyte heterogeneity in young and aged mice and to reveal the underlying mechanism for myelin loss during aging.

Methods: Diffusion tensor imaging and immunofluorescent staining were performed to verify the demyelination in the aged brains of both rodents and human. Further, the single-cell RNA sequencing data of all brain cells from young and aged mice were deeply analyzed to identify the subsets of oligodendrocyte lineage cells. Cell-to-cell interaction analysis was performed to detect the mechanism of observed changes in oligodendrocyte generation.

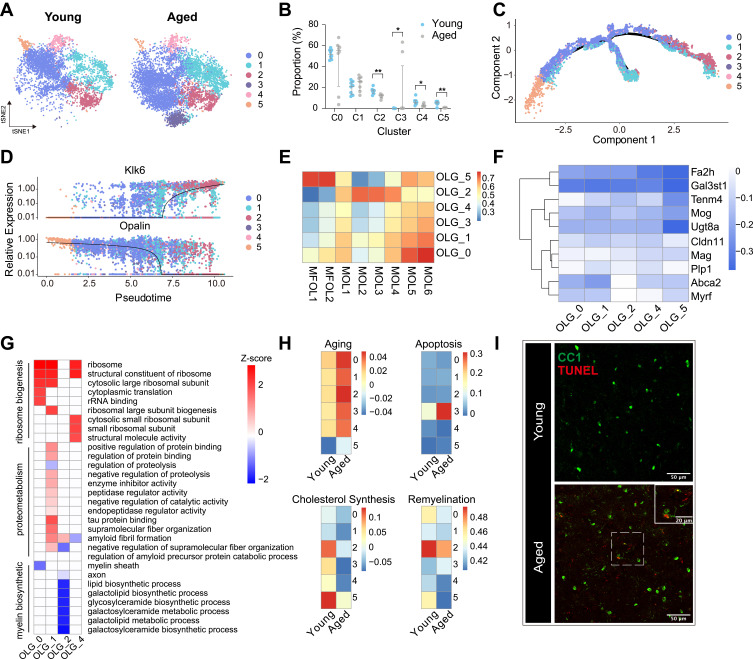
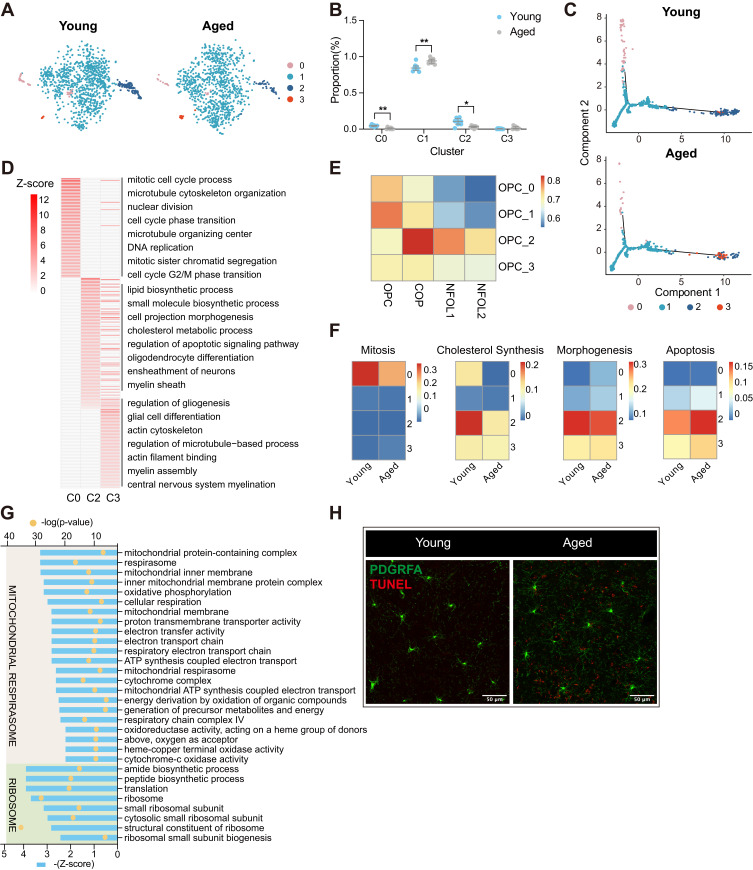
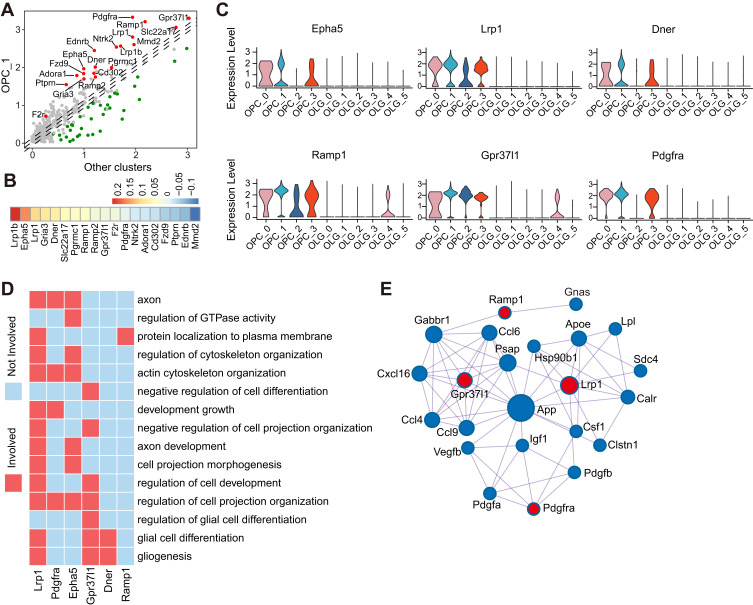
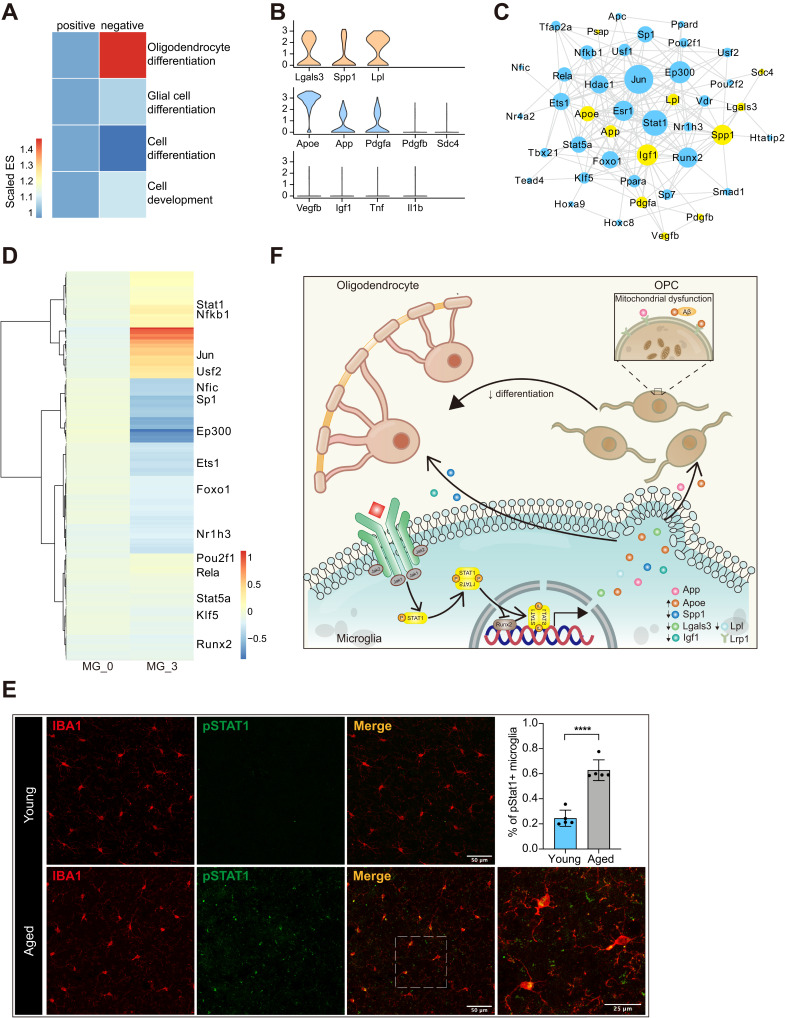
Results: Oligodendrocytes were observed to up-regulate several senescence associated genes in aged brain. Four clusters of oligodendrocyte precursor cells (OPCs) were identified in both young and aged brains. The number of those OPCs in basal state was significantly increased, while the OPCs in the procedure of differentiation were immensely decreased in aged brain. Furthermore, it was identified that activated microglia in the aged brain released inflammatory factors to suppress OPC differentiation. Stat1 might be a potential target to transform senescent microglia into tissue repair type to promote oligodendrocyte generation.

Conclusion: These results provided a perspective on how age activated microglia could impede remyelination and might give a new therapeutic target for age-related remyelinating diseases.

Keywords: microglia; oligodendrocyte precursor cells; oligodendrocytes; remyelination; single cell RNA sequencing.


Conflict of interest statement

The authors declare no conflicts of interest.

Figures

Figure 1
Figure 1
Age-related changes of myelin sheath and oligodendrocyte lineage cells in CNS. (A) Representative DTI-based white matter mapping images from young and aged adults. With the presented color-coding, red represents fibers crossing from left to right, green crossing in the posterior anterior direction, and blue crossing in the inferior–superior direction. (B) Comparison of DTI derived metrics between young and aged adults (****P-value < 0.0001 by student’s t test). (C) Linear regression plot showing the change in radial diffusivity with age (P-value < 0.0001). (D) Representative confocal microscopic images and quantification of mean MBP intensity (**P-value < 0.01 by student’s t test, n = 5 samples per condition). Scale bar: 50μm. (E) Representative TEM images in the external capsule for young and aged mice. Red asterisks and red arrows showing myelin thickness changes of axons with similar diameters, respectively. Scale bar: 2μm. Violin plots showing the g ratio of myelinated axons in aged mice versus young mice (****P-value < 0.0001 by student’s t test. The numbers of axons from four mice are indicated). Scatterplots depicting the g ratio as a function of axon diameters. (F) Representative confocal microscopic images in young and old cortex staining for PDGFRA and CC1. Scale bar: 100μm. Bar plots depicting the quantification of PDGFRA+ and CC1+ cells (** P-value < 0.01 by student’s t test. n = 5 samples per condition). (G) T-distributed stochastic neighbor embedding (t-SNE) projection of OPCs and OLGs from young and aged mice. (H) Gene ontology (GO) enrichment network plot was achieved using Metascape. Two gene lists of DEGs between aged and young OPCs or OLGs were submitted. The significantly overexpressed GO terms were grouped into several clusters based on their membership similarity. The contribution percentage of different cells was shown in each GO node. (I) Sankey diagram showing the interactions between resident cells in brain and OPCs or OLGs on GO term immune response (GO:0006955). The proportional flow represented the number of gene pairs.
Figure 2
Figure 2
Subgroup division and age-related transcriptomic alterations of OLGs. (A) T-distributed stochastic neighbor embedding (t-SNE) projection of six OLG subclusters from young and aged mice. (B) Dot plot showing the proportion of each subcluster in young and aged OLGs (**P-value < 0.01, *P-value < 0.05 by Wilcoxon Rank Sum test, n = 8 samples per condition). (C) Cellular trajectory of all OLGs subclusters, generated by Monocle DDRTree dimensionality reduction algorithm. (D) Pseudo-time trajectory plots showing the expression of representative well-known immature (Opalin) and mature (Klk6) oligodendrocyte marker genes. (E) Heatmap of Pearson correlation between each OLG subclusters with the corresponding populations mentioned by Marques et al (F) Heatmap depicting the transcriptomic alterations of well-known myelin protein or myelination regulator genes in aged OLGs compared to young ones. (G) Heatmap showing part of significant (P-value < 0.05) aging-related GO enrichment terms in oligodendrocyte subclusters. Numbers in legend represented Z-score, positive values indicated upregulation and negative ones indicated downregulation. (H) Heatmaps depicting the average gene expression on aging, apoptosis, cholesterol synthesis and remyelination module in subclusters from young and aged OLGs, respectively. (I) Representative confocal microscopic images in young and old cortex staining for CC1 and TUNEL. Scale bar: 50μm.
Figure 3
Figure 3
Cell–cell interactions between microglia and OLGs in aged CNS. (A) Dot plot depicting the interactions between different subclusters in microglia and OLGs regarding GO term immune response (GO:0006955), using DEGs for each subcluster in aged brain. Node color and size represented the strength and the count of interaction pairs, respectively. (B) Volcano plot showing the cytokines acting on OLG C2 subset released by microglia C3 subset. DEGs compared with other microglia subclusters (|log2 fold change| > 0.5 and Bonferroni adjusted P-value < 0.05) were colored, red for upregulation and blue for downregulation. (C) Heatmap of the average expression of white matter associated microglia (WAM) signature genes (Geneset 1–4) for each microglia subcluster, along with the populations mentioned by Safaiyan et al. Values were normalized per gene. (D) Expression profiles of phagosome and lipid metabolism related genes and homeostatic genes in microglia were shown with Uniform manifold approximation and projection (UMAP) visualization approach. (E) Dot plot depicting gene pairs between microglia and OLGs, along with all their co-occurring cell–cell interactions. DEGs for each subcluster in aged were used. Dot size represented the strength of gene pairs using the sum of log2 fold change of related genes and dot color meant the aggregated confidence for gene pairs.
Figure 4
Figure 4
Subgroup division and age-related transcriptomic alteration of OPCs (A) T-distributed stochastic neighbor embedding (t-SNE) projection of four OPC subclusters from young and aged mice. (B) Dot plot showing the proportion of each subcluster in young and aged OPCs (**P-value < 0.01, *P-value < 0.05 by Wilcoxon Rank Sum test, n = 8 samples per condition). (C) Cellular trajectory of all OPC subclusters, generated by Monocle DDRTree dimensionality reduction algorithm. (D) Heatmap showing part of significant (P-value < 0.05) GO enrichment terms using DEGs between the C0, C2, C3 and C1 subset of OPCs. Numbers in legend represented Z-score, positive values indicated upregulation. (E) Heatmap of Pearson correlation between OPCs subclusters with the related populations mentioned by Marques et al (F) Heatmaps depicting the average gene expression on mitosis, cholesterol synthesis, morphogenesis and apoptosis regulation module in four subclusters from young and aged OPCs, respectively. (G) Plot showing part of GO terms predicted to be inhibited significantly (Z-score ≤ −2, P-value < 0.05) along with aging in OPC C1. These terms were divided into two functional clusters (ribosome and mitochondrial respirasome) according to the biologic functions they were involved in. (H) Representative confocal microscopic images in young and old cortex staining for PDGFRA and TUNEL. Scale bar: 50μm.
Figure 5
Figure 5
Cell–cell interactions between aged microglia and OPCs. (A) Dot plot depicting differentially expressed receptor genes in OPC C1 compared with other subclusters. Receptors (|log2 fold change| > 0.1 and Bonferroni adjusted P-value < 0.05) were colored, red for upregulation and green for downregulation. (B) Heatmap showing the aging-related expression changes of those receptors marked by red in panel (A). (C) Violin plot depicting expression of receptors which were upregulated along with aging in panel (B) and differentially expressed in OPC C1 subset compared with other OPC subsets and OLGs. (D) Heatmap of part of gene ontology (GO) terms related to myelination in which the receptors in panel (C) were involved. (E) Network plot showing the interactions between extracellular ligands from microglia C3 subset and receptors in panel (C). Red for receptors and blue for ligands.
Figure 6
Figure 6
Microglia might impede remyelination via Stat1 pathway in aged CNS. (A) Heatmap of enrichment scores derived from GSEA showing the C3 subset of microglia suppressed OPC differentiation. Numbers in legend represented scaled enrichment scores. (B) Violin plot depicting expression of ligands identified to promote remyelination (first line) or impede OPC differentiation (second line) in aged microglia cluster. The third line showed that aged microglia did not highly express Vegfb, Igf1, Tnf or Il1b. (C) Network plot showing interactions between cytokines in panel (B) and their possible transcription factors inferred from TRRUST, yellow for cytokines and blue for transcription factors. (D) Heatmap derived from pySCENIC package showing the activity scores of different transcription factors in microglia C3 compared with the C0 subset. Values were normalized per gene. (E) Representative confocal microscopic images in young and old cortex staining for IBA1 and pSTAT1. DAPI labels cell nuclei. Scale bar: 50μm or 25 μm. Bar plots depicting the percent of pSTAT1+ microglia (**** P-value < 0.0001 by student’s t test. n = 5 samples per condition). (F) Schematic diagram depicting that Stat1 might regulate the production of different cytokines (upregulate Apoe and downregulate Spp1, Lgals3, Igf1 and Lpl) in microglia. Those cytokines acted on OPCs and OLGs alternatively, evoking OLG remyelination and impeding the differentiation process of OPCs.

References

    1. Pini L, Pievani M, Bocchetta M, et al. Brain atrophy in Alzheimer’s Disease and aging. Ageing Res Rev. 2016;30:25–48. doi:10.1016/j.arr.2016.01.002 - DOI - PubMed
    1. Mayne K, White JA, McMurran CE, Rivera FJ, de la Fuente AG. Aging and neurodegenerative disease: is the adaptive immune system a friend or foe? Front Aging Neurosci. 2020;12:572090. doi:10.3389/fnagi.2020.572090 - DOI - PMC - PubMed
    1. Li C, Zhang L, Chao F, Xiao Q, Luo Y, Tang Y. Stereological quantification of age-related changes in myelinated fibers of rat white matter. Neuroreport. 2017;28(1):42–49. doi:10.1097/WNR.0000000000000706 - DOI - PubMed
    1. Guttmann CR, Jolesz FA, Kikinis R, et al. White matter changes with normal aging. Neurology. 1998;50(4):972–978. doi:10.1212/wnl.50.4.972 - DOI - PubMed
    1. Stangel M, Kuhlmann T, Matthews PM, Kilpatrick TJ. Achievements and obstacles of remyelinating therapies in multiple sclerosis. Nat Rev Neurol. 2017;13(12):742–754. doi:10.1038/nrneurol.2017.139 - DOI - PubMed